


Introduction
This study is mostly concerned with the dating of ice cores from Arctic sub-polar glaciers and small ice caps, not including the cold snow layers of the Greenland plateau. Both melting and percolation occur at these locations and consequently dating based on stratigraphy or the annual variation of key parameters (stable isotopes, major ionic species, etc.) can be very uncertain. However, these ice cores can be dated accurately on the basis of well-known radioactive layers originating from past atmospheric nuclear tests (1954–74), and nuclear accidents (Chernobyl, 1986). Past volcanic events (e.g. Lakagigar Island, 1783 or Bezymianny–Kamtchatka, 1956) can in some cases substantiate the chronology obtained using these radioactive markers (Reference FritzscheFritzsche and others, 2002).
The aim of this study is to compare chronologies determined using different radioactivity profiles for ice cores retrieved from several glaciers in the high-Arctic area. Artificial isotopes from nuclear tests (3H and 137Cs) were analyzed along with natural isotopes (mainly 210Pb). These chronologies allow us to compare the behaviour of the different isotopes when subjected to post-depositional processes, in particular melting and percolation (and wind scouring for the Chernobyl layer), as studied by Reference Prantl, Ambach and EisnerPrantl and others (1973). The extent of these processes is estimated for each ice core studied. After correcting for the 1963 mean fall-out date or the absolute date of each snow layer, a melt index can be derived giving the relative magnitude of the melting and percolation processes. These ice-core chronologies can be used to determine the mean annual net mass balance (MANMB) from 1963 to the date of the drillings. The fall-out of 3H and 137Cs is studied over an archipelago (Svalbard, Norway) and over the Arctic area. We have used the Chernobyl layer extensively in previous studies for absolute dating of shallow ice cores (Reference Lefauconnier, Hagen, Pinglot and PourchetLefauconnier and others, 1994; Reference PinglotPinglot and others, 1994,Reference Pinglot1999, Reference Pinglot, Hagen, Melvold, Eiken and Vincent2001).
Study Area — Previous Work
We have studied the distribution of natural and artificial radio-isotopes (from atmospheric nuclear tests and the Chernobyl accident) in ice cores retrieved from high-Arctic glaciers, in particular from Devon Island (Canada), Svalbard (Norway) and Severnaya Zemlya (Russia) (Fig. 1a). Radioactivity was measured in samples from 13 ice cores (Table 1, see also for name abreviations) containing deposits from the atmospheric nuclear tests (from 1954–74). Eleven of the ice cores were drilled in Svalbard: Snøfjella (Reference Goto-AzumaGoto-Azuma and others,1995); Åsgårdfonna (Reference UchidaUchida and others,1996); Finsterwalderbreen (Reference Pinglot, Pourchet, Lefauconnier and CreseveurPinglot and others, 1997); Lomonosovfonna in 1997 (Reference IsakssonIsaksson and others, 2001) and 2000; and on Nordaustlandet, respectively, at Vestfonna in 1981 (Reference Punning, Martma, Tyugu, Vaikmäe, Pourchet and PinglotPunning and others, 1986) and Austfonna in 1985 and 1987 by former Soviet Union drilling teams (Reference Tarussov, Bradley and JonesTarussov, 1992); and at Vestfonna in 1995 and Austfonna in 1998 and 1999 by the Japanese National Institute of Polar Research (Reference WatanabeWatanabe and others, 2001) (Fig.1b).
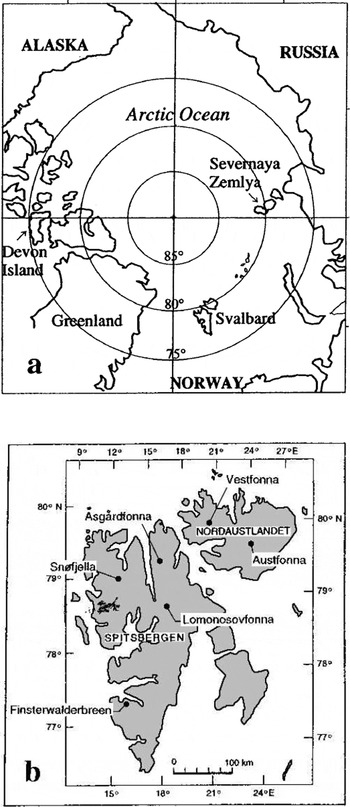
Fig. 1. Maps of the high Arctic (a) and Svalbard (b) showing ice-core locations.
Table 1. Locations of 13 ice cores retrieved from the high Arctic
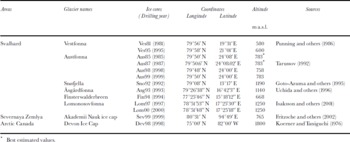
Complementary ice cores from the high Arctic were recovered from Devon Ice Cap, Devon Island, Nunavut, Canada, in 1998 and from Akademii Nauk ice cap, Severnaya Zemlya, Eurasian Arctic, in 1999 and 2000 (Reference FritzscheFritzsche and others, 2002) (Table 1). The ice cores were sampled from the surface to 30–40 m depth, depending on the location, for measurements of radioactivity. Ten of the ice cores were analyzed for both 137Cs and 3H from nuclear tests and 210Pb, while three cores were analyzed only for 137Cs and 210Pb.
Artificial and Natural Radioactivity
Artificial radioactivity in Arctic glaciers is mainly related to the atmospheric nuclear tests conducted from 1954 (the beginning of atmospheric fall-out) to 1974. The maximum radioactivity in the Arctic occurred in 1963 (UKAEA, 1957–97; Reference TheodórssonTheodórsson, 1977; IAEA, 1984) (Fig. 2). This was due to nuclear tests conducted in September–November 1961 at Semipalatinsk (50° N, 80° E; 120 Mt TNTeq.) and in August–December 1962 at Novaya Zemlya (71-73° N, 55° E; 180 MtTNTeq.) (Reference Aarkrog, Tsaturov and PolikarpovAarkrog and others, 1994). The long-lived products from these events are 137Cs (half-life of 30.15 years), 90Sr (28.15 years) and 3H (12.34 years) as well as transuranic elements (not studied in this paper).

Fig. 2. 137Cs fall-out at Tromsø and 3H content in fall-out at Isfjord Radio from atmospheric nuclear tests.
In order to compare the radioactivity profiles measured in ice cores with the original atmospheric signals, Figure 2 includes 137Cs fall-out at Tromsø, Norway, for 1955–80 (Reference Wright, Howard, Strand, Nylén and SickelWright and others, 1999) and 3H fall-out, expressed in TUm, at Isfjord Radio, Svalbard, for 1961–76 (1TU ≡ 0.118 Bq kg−1). Both profiles reflect the atmospheric nuclear tests. These locations are quite close to the high-Arctic glaciers, so they clearly indicate transfer from the atmosphere to the snow layers. The 137Cs record exhibits a first peak in 1959, and a maximum peak in 1963. Tritium was not monitored in Svalbard before 1961. 3H also peaked in 1959 and 1963. A peak of 3H fall-out (about ten times the annual natural average) also occurred at Isfjord Radio in 1972, a year with a high annual precipitation feature with twice the mean value (IAEA, 1984). As discussed below, this 3H peak in 1972 has not been detected in studies of high-Arctic ice cores from the Greenland ice sheet (Reference Koide, Michel, Goldberg, Herron and LangwayKoide and others,1982), Mount Logan, YukonTerritory, Canada (Reference Holdsworth, Pourchet, Prantl and MeyerhofHoldsworth and others,1984) and Agassiz Ice Cap, Ellesmere Island, Canada (Reference Kotzer, Kudo, Zheng and WorkmanKotzer and others, 2000).
More recently (26 April 1986), the Chernobyl accident also spread 137Cs all over the Northern Hemisphere glaciers (Reference Pourchet, Pinglot, Reynaud and HoldsworthPourchet and others, 1988). Both nuclear tests and the Chernobyl accident occurred in the Northern Hemisphere and most Arctic ice caps and glaciers received the corresponding fall-out (Reference Pinglot and PourchetPinglot and others,1994).
Natural radioactivity comes from 210Pb (half-life of 22 years), a decay product of 238U. When the parent isotope (238U) disintegrates to 226Ra, 222Rn (a noble gas) escapes from the soil. This isotope, after several short-lived disintegration processes, gives rise to 210Pb and tends to reach a secular equilibrium in the atmosphere. 7Be (53.6 days) originating from cosmic rays, is another natural isotope found in glaciers.
Both artificial and natural isotopes are deposited on the snow surface mainly by washout and to a lesser extent by dry fall-out (Reference Pinglot, Hagen, Melvold, Eiken and VincentPinglot and others, 2001).
Sampling and Analytical Methods
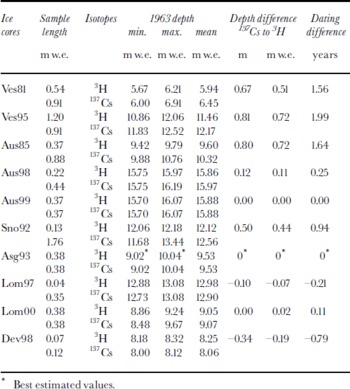
All ice-core samples were collected using shallow or deep electromechanical drilling equipment. Sub-samples for radioactivity measurements came from the surface down to about 40 m (maximum depth corresponding to the first fallout from atmospheric nuclear tests). The length of each sample varied from 5–200 cm, depending on the ice-core location and the measured isotope (Table 2). In order to obtain an age-scale equivalent, snow depths were converted to depths expressed in metres of water equivalent (m w.e.), using the densification of snow with depth.
Table 2. Depths (m w.e.) of the 1963 layer, from 3H and 137Cs, for ten ice cores, with corresponding depth and dating differences
The 3H analysis was conducted on melted sub-samples (5 cm long), followed by liquid-scintillation counting. The 1997 Lomonosovfonna profile was measured using low-level proportional counters, for which technique a sample amount of only 5 mL suffices. Therefore, the spatial resolution of this specific profile could be higher.
Total-beta measurements were carried out on melted samples filtered through ion-exchange papers (Reference Delmas and PourchetDelmas and Pourchet,1977; Reference Pinglot and PourchetPinglot and Pourchet,1979) and include 90Sr, 137Cs and 210Pb cations, which are insoluble particulates. All the above-described isotopes emit beta rays (3H and 90Sr are pure beta emitters). The total-beta-radioactivity measurement of snow samples from ice cores is the amount of both artificial and natural isotopes, without any possible discrimination. In Svalbard glaciers and in other locations in the Arctic, artificial and natural radioactivity are of equivalent magnitudes. This explains why the total-beta-counting technique is not always valid for the detection of the 1963 or Chernobyl layers.
In order to properly quantify 137Cs and 210Pb, we used high-resolution gamma-ray spectrometry. Our equipment is designed to detect very low levels of radioactivity, including a 20% high-purity Ge (N-type) detector, with an anti-Compton scintillation detector (Reference Pinglot and PourchetPinglot and Pourchet,1994). The detection levels for 137Cs and 210Pb are 4 and 10 m Bq, respectively, for 3 day measurements with a 97.5% confidence level. 137Cs and 210Pb are measured at the same time.
Results
Devon Ice Cap and Austfonna
As a reference, the radioactivity profiles of an ice core from 152 a glacier with negative (−23°C) 10 m temperature (Devon Ice Cap) will be compared with profiles from Austfonna, a sub-polar glacier. In cold glaciers the 10 m temperature is negative, closely representing the mean annual temperature. In the accumulation area of sub-polar glaciers, the 10 m temperature is generally about 0°C or slightly negative. It is negative in the ablation area.
For the Devon Ice Cap ice core, there is excellent agreement between total-beta 137Cs and 3H measurements, the 1963 peak of artificial radioactivity occurring at almost the same depth (Fig. 3a and b). The 1963 horizon was generally assigned to depths where there was a clear peak of radio-activity for either 3H or 137Cs. For at least two ice cores (Aus87 and Ves81) the identification of the 1963 horizon needs special attention. This 1963 date was fixed in the following way: after the large atmospheric nuclear tests in 1961 and 1962 there was a moratorium, with no other tests for some years. Even if there is not a clear maximum, one can consider that when the radioactivity, after ranging at a given level, falls to a low value at shallower depth, then the 1963 horizon is quite close to this depth.

Fig. 3. Radioactivity at time of fall-out (137Cs and 3H), and at time of measurement (total beta and 210Pb, respectively, 1986 and 1993) vs depth for Devon Ice Cap (a, b) and Austfonna (c, d).3H measurements from Devon Island (thin line) are not continuous.The arrow indicates the equivalent 1954 computed year.
The 3H profile is not continuous, and extrapolated values were included for estimating the fall-out. Thus the exact location of the 1963 maximum is estimated to occur at depths of 8.18–8.32 m w.e.(Table 2). The 137Cs profile also shows the 1959 peak. As will be shown later for other ice cores (Figs 4–6), the beginning of atmospheric fall-out in 1954 is well marked only for the Devon ice core (Reference Koerner and TaniguchiKoerner and Taniguchi,1976). The initial increase of 137Cs compared to 3H has already been pointed out by Reference Koide, Michel, Goldberg, Herron and LangwayKoide and others (1982) and Reference Holdsworth, Pourchet, Prantl and MeyerhofHoldsworth and others (1984).

Fig. 4. Radioactivity at time of fall-out (137Cs and 3H), and at time of measurement (total beta and 210Pb, respectively, 1988 and 1993) vs depth for three ice cores from Austfonna (a–d). The arrow indicates the equivalent 1954 computed year.
For the 1985 Austfonna ice core, the radioactivity profiles (Fig. 3c and d) include total beta,137Cs, 210Pb and 3H. For the 137Cs profile, a clear maximum occurs at 9.88–10.76 m w.e. depth, indicating the 1963 maximum. This is in close agreement with the 1963 3H maximum, which is, however, slightly shallower than the 137Cs maximum. The 3H atoms are constituents of the water molecule and, compared to the 137Cs particulates, much of the radioactivity (atoms) contributing to the 3H maximum was not propagated downwards. The 137Cs profile shows another maximum at about 13.5 m w.e., possibly representing the 1959 fall-out (Fig. 3c).
The total-beta profile (Fig. 3d) cannot be used for dating. The clear maximum corresponds to fall-out that occurred well before 1963, as measured from 137Cs. It is close to the bottom of the ice core and does not represent any artificial radioactivity. This maximum corresponds to a very high level of 210Pb, as shown on the profile (Fig. 3d). Very similar disturbed total-beta profiles were also measured for Austfonna 1987 (Fig. 4d) and Vestfonna 1981 (Fig. 5c). This 210Pb increase is not supported by long-lived parents ( 238U, 226Ra). The total-beta values involve beta activity from 210Pb, but also the accompanying alpha and beta activities from the 210Pb daughters (210Bi and 210Po) and to a lesser extent from radioactive dust particles (226Ra and 214Pb from 238U parent). Such a large 210Pb increase also occurs in all ice cores retrieved from Austfonna (1985, 1987 and 1998), except for the 1999 ice core. Although the 137Cs and 3H profiles provide valuable dating information at Austfonna and for ten other ice-core locations (Reference PinglotPinglot and others, 1994), the 210Pb and total-beta profiles reveal a strong scavenging process due to melting and infiltration for these particulate-composed elements, as for ionic species (Reference Goto-Azuma, Enomoto, Takahashi, Kobayashi, Kameda and WatanabeGoto-Azuma and others, 1993). Chronologies based on the radioactive decay of a given isotope (e.g. 210Pb) are generally corrupted by post-depositional processes.

Fig. 5. Radioactivity at time of fall-out (137Cs and 3H), and at time of measurement (total beta and 210Pb, respectively, 1982 and 1993) vs depth for three ice cores fromVestfonna (a–c).The arrow indicates the equivalent 1954 computed year.
Along the 137Cs profiles, the 1963 maximum is located at greater depth than in the 3H profiles (Fig. 4a and b, Table 2). For three ice cores from Austfonna, the 1963 depth difference ranges from 0–0.72 m w.e. corresponding to 0–1.6 years of net accumulation, while the atmospheric signals indicate that both 137Cs and 3H fall-out peaks occurred at the same time (1963; Fig. 2). This confirms that the 137Cs fall-out experiences downward migration due to melting and percolation. Total-beta and 210Pb profiles at Aus87 (Fig. 4d) and Aus85 (Fig. 3d) are disturbed. This demonstrates that the absolute dating of ice cores in this sub-polar ice cap depends onthe isotope measured: the 3H profile gives a better chronology than 137Cs.
Vestfonna
Samples from two ice cores from Vestfonna were also analyzed for 137Cs and 3H (Fig. 5a and b).
For the 1981 Vestfonna ice core (Fig. 5b), there is a clear deformation of the original atmospheric signal both for 137Cs and 3H. The tentative depth given for the 1963 peak is based on the 3H profile as the 137Cs profile shows a strongly disturbed signal. The depth difference ranges from 0.60–0.73 m w.e. and corresponds to about 1.7 and 1.9 years of net accumulation for Vestfonna 1981 and 1995, respectively (Table 2). Note that the summit of Vestfonna (580–600 m a.s.l.) is lower than Austfonna (758–783 m a.s.l.), so higher melting is more likely at Vestfonna.
Lomonosovfonna
The same analyses were conducted for two ice cores from Lomonosovfonna, drilled in 1997 (Lom97) and 2000 (Lom00) (Table 1), located about 150 m from each other (Fig. 6a and b). For the1997 core, there are similar trends for 137Cs and 3H and the 1963 peak is well-defined. The detailed 3H profile (preliminary, as all samples are not yet analyzed) was determined from the analysis of 5 cm resolution samples.

Fig. 6. Radioactivity at time of fall-out (137Cs and 3H), and at time of measurement (total beta and 210Pb, respectively, 1998 and 2000) vs depth for two ice cores from Lomonosovfonna (a, b) and for an ice core from Akademii Nauk ice cap (c). The arrow indicates the equivalent 1954 computed year.
For the core drilled in 2000, the 3H profile reflects the atmospheric signal while the 137Cs profile shows large temporal variations.The 1963 layer at Lom00 (9.05 m w.e.) is not as deep as the Lom97 ice core (12.98 m w.e.) (Table 2). As discussed below, the low 3H fall-out at Lom00 most probably indicates that the original precipitation is low, as is the MANMB. The 210Pb profile (Fig. 6b) at Lom97 indicates a general decrease of activity with depth. However, dating of this ice core from 210Pb decay does not reproduce the 1963 horizon.
Akademii Nauk ice cap
In order to extend our study of the spatio-temporal variations of the MANMB and the global mass budget to other glaciers and ice caps in the high Arctic, 137Cs and 210Pb profiles were also measured in an ice core from Akademii Nauk ice cap (Fig. 6c). The 1963 peak for 137Cs is well-defined between 15.55 and 16.73 m w.e. This is in agreement with the 1956 Bezymianni volcanic layer studied by Reference FritzscheFritzsche and others (2002). Previously, Vaikmäe and others (1980) analyzed 3H at the nearby Vavilov ice cap and concluded that the corresponding profile was disturbed. The 1954 computed year of 137Cs fall-out does not correspond to this absolute date. Therefore it could be concluded that melting also occurs at the summit of Akademii Nauk ice cap, which is supported by positive air temperatures recorded by an automatic weather station here in summer 2000 (Reference Hagen and MelvoldHagen and Melvold, 2001). Reference Vaikmäe, Punning, Romanov and BarkovVaikmäe and others (1981) even reported temperature of +10−15°C at Severnaya Zemlya.
Interpretation and Discussion
Chronology
The ice cores from the Arctic area have been dated using radioactivity measurements. The most accurate detection of the 1963 peak of artificial radioactivity is obtained from 3H using the proportional-counting technique, and then from 137Cs. This is due to the higher resolution of samples subjected to 3H analysis, 0.04 and 0.07 m w.e. for the Lom97 and Dev98 ice cores, respectively (Table 2). Gamma spectrometry of 137Cs needs samples with higher mass and length, compared to 3H analysis. 3H dates are also better than 137Cs because the 1963 horizons are much stronger for 3H and largely remain at the original fall-out depth.There is generally a stronger migration of 137Cs compared to 3H, as shown below (Fig. 7). The depth differences for the 1963 peak, based on 137Cs and 3H, are indicated in Table 2, together with the corresponding age differences. Minimum and maximum depths correspond to the length of samples representing the 1963 layer. While this layer is well defined for 3H, the 137Cs layer corresponding to 1963 was in some cases estimated to be just before the decrease of activity following the nuclear-test moratorium. However, for each ice core, the depth differences for 1963 is lower than the length of the corresponding 3H or 137Cs sample (Table 2).

Fig. 7. 137Cs and 3H fall-out ratio from atmospheric nuclear tests, determined from 1963 mean time of fall-out and absolute date of snow layers, respectively.
The differences in dating obtained using 137Cs and 3H are close to zero for several ice cores and may be not significant for the other ice cores.The maximum difference may extend up to 2 years at Vestfonna and slightly opposite (−0.8 year) for Devon Ice Cap.This may be due to the discontinuous 3H sampling, with one sample in the 1963 layer that was not analyzed. The total-beta activity profile was used to estimate the probable depth of the 1963 layer for 3H (i.e. 8.18–8.32 m w.e.).
Mean annual net mass balances (MANMB)
All ice cores were retrieved from the summits of the studied ice caps with very low horizontal velocities and terrain slopes. The thinning effect of deeper ice layers (down to 40 m in this study) is negligible, and we can use the chronology results to determine the MANMB.
The MANMB values range from 0.17 (Fin94) to 0.47 m w.e. a−1 (Aus85 and Sno92) (Table 3) from 1963 to the drilling dates (1981–2000). Apart from a MANMB value determined for Devon Ice Cap by Reference Koerner and TaniguchiKoerner and Taniguchi (1976), earlier MANMB values determined for other Arctic locations do not agree with our determinations, due to difficulties in interpreting the stratigraphy and total-beta profiles. This is particularly true for ice cores from Nordaustlandet (Vestfonna and Austfonna), where MANMBs were previously misinterpreted , as shown by Reference Pinglot, Hagen, Melvold, Eiken and VincentPinglot and others, 2001.
Table 3. 137Cs and 3H for 13 ice cores: MANMB from 1963 to date of drilling; fall-out from atmospheric nuclear tests (corrected for 1963 mean fall-out date and the absolute date of each snow layer); and fall-out ratio (fall-out at absolute date vs fall-out in 1963)

The MANMBs of Lom97 and Lom00 ice cores (1250 m a.s.l.) are 0.36 and 0.23 m w.e. a−1, respectively. These are much lower than the previous 0.82 m w.e. a−1 value determined for a 1000 m a.s.l. site (Reference Gordiyenko, Kotlyakov, Punning and VaikmäeGordiyenko and others, 1981). Earlier studies (Reference Zagorodnov, Klementyev, Nikiforov, Nikolaëv, Savatyugin and SasunkevichZagorodnov and others, 1990) reported MANMB values at the summit of Akademii Nauk ice cap ranging from 0.20–0.30 m w.e. a−1 compared to our determination of 0.45 m w.e. a−1.
137Cs and 3H fall-out and melt indexes
Both 137Cs and 3H fall-out from atmospheric nuclear tests (1954–74) over Arctic glaciers have been determined (Table 3). The transport mechanisms (residence time) of 3H and 137Cs through the atmosphere are almost the same (Reference Pourchet and PinglotPourchet and Pinglot, 1979), so they do not affect the location of the 1963 peak in the cores. Assuming a constant MANMB at each ice-core location, as already demonstrated for the period from 1963 to the date of the drillings (Reference PinglotPinglot and others, 1999), the 137Cs and 3H activity profiles have been decay-corrected, taking into account the precise date of the snow layers. This will enable us to compute the fall-out of both isotopes in two ways. The hypothesis is that the exact 1963 peak did not propagate downward. Even if 1963 is not the exact mean date of atmospheric nuclear tests fall-out, the melt index studied is representative of the strength of melting and percolation processes.
In the first correction for decay, we assume that the mean date of fall-out for all samples is 1963. This is a reasonable assumption, given that the total period of atmospheric nuclear testing extends equally before and after 1963. For the second correction, each sample radioactivity value is corrected to take into account the absolute date of the snow layers. From the date of drilling, dating is given by the equivalent depth (m w.e.) divided by the MANMB, as previously determined. Both corrections take into account the date of all measurements, extending from 1983–2000 (Table 3). The depth of the layer corresponding to the year1954 (first significant increase of artificial radioactivity in the Arctic) was then determined and included on all profiles (Figs 3–6).
There is a general disagreement between the 1954 computed equivalent depth and the first increase of isotopes. The 137Cs profiles apparently propagated to greater depths than the 1954 equivalent depth. This clearly demonstrates the post-depositional processes due to melting and percolation during successive summers. Periods of melting during warmer summers in the early 1950s have been reported (Reference Fisher and KoernerFisher and Koerner, 1994; Reference Førland, Hanssen-Bauer and NordliFørland and others, 1997). This is also in accordance with the 210Pb profile (Fig. 3d), showing a major activity peak at greater depths, as has been detected for other Austfonna ice cores (Reference PinglotPinglot and others, 1994). 137Cs and 3H fall-out will be overestimated as a result of the overestimation of the age of deeper samples. Figure 7 indicates both the 137Cs and 3H fall-out ratio, as determined either from a decay correction of fall-out computed for 1963 or for the absolute date of each snow layer.
This fall-out ratio represents a melt-index equivalent. Instead of a fall-out ratio ideally equal to 1 for cold glaciers and ice caps, the present fall-out ratios are close to 1.2 for ice cores from Lomonosovfonna (Lom97), Devon Ice Cap (Dev98) and Snøfjella (Sno92) (Table 3). For the other cores studied, the respective fall-out ratio increases, ranging up to about 2 for lower-altitude cores from Vestfonna (Ves81) and Finsterwalderbreen (Fin94), at 580 and 668 m a.s.l., respectively.
The fall-out ratio is generally higher for 137Cs than for 3H (five cores), except for Ves95 and Lom00. This melt-index study also demonstrates that percolation is less important for 3H than 137Cs. As the 137Cs profile at Lom00 core reveals large variations, perhaps the corresponding corrected fallouts were not determined accurately. This demonstrates that for a given ice-core location, the study of the fall-out of radioactivity can be used to determine the relative strength of the melting and percolation processes. There is evidence that cores from cold glaciers are less subjected to these processes. However, all cores from sub-polar glaciers experience large post-depositional processes, as described by Reference KoernerKoerner (1997) and Tarussov (1992).
The best estimates for 137Cs and 3H fall-out are determined from the 1963 decay-corrected values, as the decay correction of fall-out, applied for each snow-layer date, leads to overestimated values. As already specified, MANMB at each ice-core location is almost constant for periods extending from 1963–86 and from 1986 to the drilling dates (Reference PinglotPinglot and others, 1999). From this important feature for ice cores from Svalbard, 137Cs and 3H fall-out is studied in relation to the MANMB for each core location (Fig. 7a and b), even if the all periods are not the same.
137Cs fall-out from the nuclear tests for all studied cores spans from 224 (Ves81) to 549 Bq m−2 (Sev99) (Fig. 8a). Altogether, the mean 137Cs fall-out values for the 13 Arctic and 11 Svalbard ice cores are 355 Bq m−2 (±95 Bq m−2) and 341Bq m−2 (±81 Bq m−2), respectively. For four ice cores near the summit of Austfonna, the fall-out values extend from 269–434 Bq m−2. Fall-out values are 310 and 549 Bq m−2, respectively, for the Devon Ice Cap and Akademii Nauk ice cap cores (Table 3). The fall-out apparently tends to decrease from eastern to more western Arctic locations. This agrees with the 137Cs fall-out in the Arctic predicted by Reference Wright, Howard, Strand, Nylén and SickelWright and others (1999) using a geographical information system to combine 137Cs fall-out and precipitation data.

Fig. 8. 137Cs (a) and 3H(b) fall-out from atmospheric nuclear tests vs MANMB for 13 high-Arctic ice cores.
The mean 3H fall-out for the same 1954–74 period is 4762 ± 1126 TU m for eight ice cores and spans from 2979–6505 TU m (Fig. 8b). For comparison, the 3H fall-out measured for the Isfjord Radio coastal station in Svalbard (IAEA, 1984) for the period 1961–76 is 2793 TU m. This is in accordance with the 3H data from ice cores, as the 3H fall-out at Isfjord Radio (mean annual precipitation is 0.444 m) was not recorded before 1961. The 3H fall-out increases with MANMB (r = 0.56), from a previous study in Greenland (Reference Merlivat, Ravoire, Vergnaud and LoriusMerlivat and others, 1973). A null 137Cs fall-out corresponds to about a 1000 TU m 3H fall-out (Fig. 8b). This corresponds to the natural 3H fall-out (∼50 TU m a−1) over 20 years, the period when artificial 3H was also deposited (1954–74).
For all ice cores, there should be proportionality between 137Cs and 3H fall-out from atmospheric nuclear tests. This relationship prevails and exhibits a 0.69 correlation coefficient (Fig. 9). The 3H fall-out at Lomonosovfonna (Lom97 and Lom00), 3709 (estimated value, as some samples were not analyzed) and 2979 TU m, respectively, is low compared to the other ice cores (mean of 4913 TUm) (Fig. 8b).

Fig .9 3H vs 371Cs fall-out from atmospheric nuclear tests at eight Arctic ice-core locations.
137Cs fall-out in the Lom97 and Lom00 ice cores, 343 and 279 Bq m−2, respectively, is close to the mean value of Svalbard ice cores (341 Bq m−2), indicating that wind erosion may be low, but cannot explain the surprisingly low MANMB at the Lomonosovfonna sites at the summit of this ice cap. Analysis of three ice cores from the Lomonosovfonna dome did not show the presence of the Chernobyl signal, indicating that some wind scouring occurs at this location. However, the Chernobyl event was present in ice cores located at lower altitudes (1044 and 1173 m a.s.l.). A close examination at the relationship between 137Cs and 3H fallout (Fig. 9) reveals that both the Lom97 and Lom00 ice cores experience about 25% lower 3H fall-out than the mean values. This may be due to snow and 3H sublimation, as described byReference Winther, Bruland, Sand, Killingtveit and MarechalWinther and others (1998).
The 1986 Chernobyl layer
137Cs fall-out from the Chernobyl accident has been successfully detected in about 50 Svalbard ice cores (Reference Lefauconnier, Hagen, Pinglot and PourchetLefauconnier and others, 1994; Reference Pourchet, Lefauconnier, Pinglot and HagenPourchet and others, 1996; Reference PinglotPinglot and others, 1994, Reference Pinglot, Pourchet, Lefauconnier and Creseveur1997, Reference Pinglot1999, Reference Pinglot, Hagen, Melvold, Eiken and Vincent2001). More recently, we determined the Chernobyl fall-out for the Devon and Akademii Nauk ice caps. The 137Cs fall-out varies from 0–47 Bq m−2 for the Svalbard ice cores. Wind scouring has been determined to be the main factor explaining this variability, as the fall-out from Chernobyl only occurred during a few days (Reference Pinglot, Hagen, Melvold, Eiken and VincentPinglot and others, 2001). The fall-out on Devon Island is 5 Bq m−2 for two ice cores. This value is of the same order as the Svalbard and Greenland values (Reference DibbDibb, 1989). On Severnaya Zemlya, the 137Cs fall-out is about 1 Bq m−2, as determined from a shallow ice core retrieved in 2000. This low value is close to the detection limit of our low-level gamma spectrometer. It would appear however to be valid, given that the corresponding mass balance for 1986–2000 is 0.52 m w.e. compared to 0.45 m w.e. for 1963–2000(Table 3).
Dating from 210Pb profiles
Both 137Cs and 210Pb were simultaneously analyzed by gamma spectrometry. The 210Pb profiles for Aus85, Aus87 and Ves81 ice cores (Figs 3d, 4d and 5c) indicate a strong 210Pb increase between 18 and 24 m w.e. Samples from other ice cores from Austfonna,Vestfonna and Spitsbergen were also analyzed for 210Pb. The corresponding 210Pb profiles are included in Reference PinglotPinglot and others (1994). Other ice cores from Svalbard (Asg93 and Sno92) have also been analyzed for 210Pb (Reference Suzuki and FujiiSuzuki and Fujii, 1992; Reference Suzuki, Ohta and WatanabeSuzuki and others, 1995). There is no exponential decay starting from the surface down, for any profile. The 210Pb profile (Fig. 6b) for Lom97 indicates a general decrease of activity with depth. However, the dating of this ice core, based on 210Pb decay, does not correctly position the 1963 radioactive layer from atmospheric nuclear tests.
For Akademii Nauk ice cap, a formerly determined 210Pb profile (Reference Zagorodnov, Klementyev, Nikiforov, Nikolaëv, Savatyugin and SasunkevichZagorodnov and others, 1990) can be closely compared to the new profile (Fig. 6c). Instead of a regular decrease of the 210Pb activity with depth, the activity is almost stable (and even increases with depth in the first 10 m) from the surface down to about 25 m w.e. Then the activity regularly decreases, as expected. This unusual feature was already reported by Reference Zagorodnov, Klementyev, Nikiforov, Nikolaëv, Savatyugin and SasunkevichZagorodnov and others (1990). At a depth of about 20 m w.e., there is even a high level of 210Pb activity. The interpretation may be that 210Pb particulates travel downward into the deeper firn layers due to summer melting and percolation. Once the firn layers reach a density close to 0.9, the migration of 210Pb stops and its activity begins to decrease, as seen below 30 m depth. This indicates that dating based on the 210Pb half-life (22 years) may be impossible for most ice cores from sub-polar glaciers.
Conclusions
Dating of Arctic ice cores based on the 1963 maximum of artificial radioactivity originating from atmospheric nuclear tests was initially performed using the total-beta technique. This sensitive (and relatively inexpensive) method is valid for ice cores retrieved from cold glaciers, such as those in high-Arctic Canada, central Greenland and Antarctica. For ice cores retrieved from sub-polar glaciers that experience melting and percolation in summer, the best dating is accomplished using 3H and 137Cs. The original fall-out depth of the 1963 maximum is better preserved for the 3H profiles for most ice cores. Arctic ice cores have been successfully dated from both atmospheric nuclear tests and the Chernobyl accident based on 137Cs measurements in Svalbard, high-Arctic Canada (Devon Island) and Severnaya Zemlya. The 137Cs and 3H activity profiles have been decay-corrected either for the mean 1963 fall-out date or for the precise dates of the snow layers. A fall-out ratio, or melt index, has been derived from both fall-out values and represents the extent of melting and percolation for all 13 ice cores studied.
For several locations, the 210Pb profiles indicate a clear mixing of seasonal layers for certain chemical elements. Radioactivity measurements confirm that the seasonal signal may not be preserved in sub-polar Arctic glaciers. On the other hand, the Lomonosovfonna 1997 3H profile with high spatial resolution indicates the conservation of sub-annual signals to at least some extent. Continuation of the analysis of the 1970’s samples will reveal how far the semi-annual 3H precipitation signal is conserved in this core. The dating method based on the 210Pb exponential decrease with depth (expressed in water equivalent) is possibly valid for selected high-altitude sites in Svalbard.
These radioactivity measurements provide access to key parameters for the study of Arctic glaciers.The absolute chronology of ice cores is the most important feature. In relation to possible climate warming and sea-level rise, the MANMB with the associated spatio-temporal variations (1963–86 and 1986 to the date of drilling) can be studied using radioactive horizons. The total mass budget of the accumulation area of the studied glaciers is determined from the altitudinal gradient of the MANMB, which is also incorporated in mass-balance models. Radioactivity measurements also provide a better understanding of post-depositional processes, such as melting and percolation as well as wind scouring, which affect the distribution of both natural and artificial isotopes.
Acknowledgements
This study was funded by several EU contracts, including contract No. ENV04-CT97-0490: “The response of Arctic ice masses to climate change” (ICEMASS), coordinated by J. O. Hagen. Comments and advice from all colleagues of the International Arctic Science Committee–Mass balance of Arctic Glaciers and Ice sheets in relation to the Climate and Sea-level changes (IASC–MAGICS) group were very fruitful. Logistical and financial support respectively from the Norwegian Polar Institute and Institut Français de la Recherche et de la Technologie Polaires was greatly appreciated. H. Miller and L. M. Savatyugin initiated close cooperation with the Severnaya Zemlya programme. I. Clark, D. A. Fisher, K. Goto-Azuma and J. Chappelaz participated in Devon Island ice-core recovery, stratigraphy and sample management.We would also like to thank the ice-core drillers, including V. Zagorodnov and M. Miyahara. C. Pinglot, M. Kaczmarska and B. Lefauconnier took part in the chemical preparation of samples. Comments from two anonymous reviewers and from D. A. Peel and W. D. Harrison, respectively Scientific and Chief Editor, were greatly appreciated and improved this paper in many ways.


