


Introduction
The Ward Hunt Ice Shelf of northern Ellesmere Island (Fig. 1) is a 500 km2 sheet of floating ice, 43 m in average thickness. Its unique topography is marked by a succession of east–west ridges and troughs, 230 and 55 m respectively in average width, and several kilometers in average length. During the melt season the troughs become melt-water lakes, with water depths fluctuating between 3 and 1.5 m. Massive calving in 1962 has resulted in the loss of approximately half the original ice-shelf area (Reference Hattersley-SmithHattersley-Smith, 1963). Radio echo sounding (Reference Evans, Evans, Gudmandsen, Swithinbank, Hattersley-Smilh and RobinEvans and others, 1969) suggests that thicknesses of the ice shelf may vary between 20 and 85 m, which is a more extreme fluctuation than that detected by seismic methods (20–56 m; Reference CraryCrary, 1958; Reference Crowley, Rigsby and BushnellCrowley, 1961), or by levelling profiles (Reference ListerLister, 1962) combined with density determinations (Reference Ragle, Ragle, Blair and PerssonRagle and others, 1964), which yield calculated thicknesses of 26–48 m.

Fig. 1. Map showing the present and former extent of the Ward Hunt Ice Shelf and adjacent ice rises.
The Camp Creek (elevation 48 m). Ward Hunt (elevation 30 m) and Cape Discovery (elevation 160 m) ice rises (cf. Fig. 1) are irregularly ellipsoidal in ground plan and planoconvex in cross-section, and have maximum ice thicknesses of 46, 100 and 125 m, respectively. The latter two values, based on radio echo sounding (Reference Evans, Evans, Gudmandsen, Swithinbank, Hattersley-Smilh and RobinEvans and others, 1969), may be somewhat high and need to be confirmed by other methods. Comparison of elevation and ice-thickness values shows that the Cape Discovery and Camp Creek ice rises lie largely above mean sea-level, but the Ward Hunt ice rise extends to depths of possibly as much as 70 m below mean sea-level; a 38 m depth has been confirmed by drilling.
Results of surface mapping (Reference Lyons and LeavittLyons and Leavitt, 1961) and of core drilling (Reference Ragle, Ragle, Blair and PerssonRagle and others, 1964) show that the outer part of the Ward Hunt Ice Shelf consists of a 15–18 m thick platform of sea ice conformably overlain by approximately 25 m of iced firn and interstratified lake ice. From the latitude of Ward Hunt Island southward, an older “basement” Reference Marshall and BushnellMarshall, 1960) of interdigitating sea and brackish ice (Reference Lyons, Lyons, Savin and TamburiLyons and others, 1971) lies with angular unconformity beneath the interstratified iced firn and lake ice. A thick capping of ablation-produced dust marks the surface of unconformity. Conflicting radiocarbon dates on the dust (Reference CraryCrary, 1960, p. 45) suggest an age of 1 600(?) years.
The Camp Creek and Cape Discovery ice rises have been drilled to depths of 25 m and the cores show only iced firn to these depths. Vertical cyclic variations in average grain diameter and in bubble concentration within the iced firn range from 2 to 8 cm in spacing, and are interpreted as stratigraphic indicators of the annual rate of accumulation of the firn (cf. also Reference Marshall and BushnellMarshall, 1960, p. 45–46). Camp Creek has cut into its ice rise, exposing iced firn almost to its base, where three heavy dust layers appear, beneath which are 2 m of bluish basement(?) ice. If the Camp Creek dust layers are the equivalent of the 1 600(?) year old ice-shelf dust layer, the long-term average annual firn accumulation rate for the Camp Creek ice rise would be approximately 3 × 10⁻² m year−1. Elsewhere (Reference Lyons and RagleLyons and Ragle, 1962), we have presented stratigraphic and thermal evidence that the iced firn and interstratified lake ice of the Ward Hunt Ice Shelf built up at an average rate of 2.5 × 10⁻² m year−1.
The two southernmost holes drilled into the Ward Hunt ice rise (Fig. 1) show only iced firn to depths of 25 m, but in the northernmost hole 33 m of interlensed iced firn and lake ice overlie 19 m of sea ice. That hole bottomed in till at 52.3 m. The absence of a dust ablation layer in this core, as well as in cores from the ridge and trough holes 1.6 km to the north (cf. Fig. 1) implies that all ice in the three cores is younger than 1 600(?) years.
Thermal data
Figure 2 presents depth-temperature data accumulated by Ragle, Blair and Lyons in 1960, and by Tamburi and Lyons in 1969. We have also included two points recorded by Reference CraryCrary 1958) on one of the ridges of the Ward Hunt Ice Shelf for which his field notes indicated constant thermocouple readings during a period of more than 2 months.

Fig. 2. Thermal profiles through the Ward Hunt Ice Shelf and adjacent ice rises.
The 1960 data were taken partly with thermistors calibrated to an accuracy of ±0.1° C. An equipment break-down necessitated a switch to lagged thermometers for the 52 m ice rise hole, with a consequent decrease in accuracy to ±0.25° C. All readings were taken in air, after the thermistor or thermometer had been lowered to a predetermined position in the hole and had been kept there for periods ranging from 2 to 12 h.
Manual core drilling to depths of 25 m was undertaken in 1969, but for some holes we also used a modified Philberth thermal probe (Reference AamotAamot, 1968) to which a thermistor string had been attached. Ethylene glycol was used to prevent freezing so that part of the thermistor cable was immersed in an antifreeze-rich slush. Readings on the calibrated thermistor were taken only after a lapse of 3 days in the slushy holes, and were repeated in some cases at intervals of up to 3 weeks. The maximum observed drift was −0.3° C.
Because the surface elevation at the drilling sites ranged from 0.5 to 160 m above sea-level, we have corrected all readings to sea-level using a lapse rate of 0.65° C/100 m. With this correction it is significant that, with the exception of the trough and re-entrant curves, the temperature observations below 10 m fall along least-squares fitted straight lines which extrapolate back to −18.1° C. We take this to be the mean annual sea-level surface temperature at this latitude of Ellesmere Island.
Thermal perturbations
Deviations of thermal profiles from linearity above the 10 m depth are so well understood that we can profitably neglect this region of Figure 2. Similarly, the extrapolation of the trough profile to a surface temperature approximately 3° C higher than the ridge or ice-rise profiles is explicable in terms of the latent heat of freezing which must be lost from melt-water lakes after the fall freeze-up commences. This heat loss is retarded by the insulating effect of snow which mantles the lake ice shortly after the initial ice skin has formed.
An important question is the effect of the melt-water lakes on the thermal profile through a ridge. To answer this, we may adopt a model of the lakes as thin slab-like heat sources of semi-infinite length in one dimension, with an average half-width of 27.5 m. To simplify, the ±3 m vertical difference in elevation between the drilling sites on the ridge and the trough is disregarded. The ridge drill site is approximately 142 m from the center of the lakes on either side. The following S.I. unit physical constants have been used (cf. Reference CraryCrary, 1960, p. 33): density (δ) = 0.90 Mg m−3, specific heat (c) = 2.052 kJ kg−1 deg−1, diffusivity (α) = 1.1 × 10⁻⁶ m2 s−1, thermal conductivity (K) = δcα = 2.03 × 10⁻² W m−1 deg−1.
The stratigraphy of the Ward Hunt Ice Shelf and of T-3 (Reference CraryCrary, 1958; Reference SmithSmith, 1960) shows that the position of melt-water lakes has shifted with time during the build-up of the ice shelf. For the purpose of calculation, we consider the lakes as strips 3 deg warmer than the mean annual temperature of the ice-shelf surface, and compute the transient and equilibrium effects of these heat sources at varying distances from the centers of the strips. Reference LachenbruchLachenbruch (1957[b]) has formulated solutions to this problem in dealing with the effects of heated buildings on permafrost. Using his methods, one may calculate that the equilibrium thermal disturbance at distances greater than 100 m from the center of a lake is approximately 0.1 deg or less. In short, the lakes will have no measurable thermal effect upon a ridge thermal profile within the limits of precision of our temperature readings.
Another question concerns the effect of a change in mean annual air temperature, or in the sub-ice-shelf temperature. The latter is relevant, because ice stratigraphy (Reference Lyons, Lyons, Savin and TamburiLyons and others, 1971) shows an alternation of sea ice and brackish ice within parts of the lower Ward Hunt Ice Shelf, implying a temperature fluctuation of 1.8 deg. This type of problem has been solved by Reference LachenbruchLachenbruch (1957[a]) in terms of the advance of the ocean over permafrost, and by Reference WexlerWexler (1960) in terms of the time necessary to thermally equilibrate a glacial tongue which becomes a floating ice sheet. If the temperature change at the surface or sub-surface of the Ward Hunt Ice Shelf were 2 deg, all points within the ice would equilibrate to within ±0.2 deg of their equilibrium values within a 25–50 year period. We interpret Figure 2, therefore, as showing that at the sites drilled there has been no significant temperature change at the surface or sub-surface of the Ward Hunt Ice Shelf within the past few decades.
Sinking and bottom melting, or rising and bottom accretion to the ice shelf (assuming a constant thickness), should cause a deflection of the thermal curves from linearity to a concave-upward profile in the former case and to a convex-upward profile in the latter. Solutions to this problem have also been presented by Reference WexlerWexler (1960). His equations, applied to the Ward Hunt Ice Shelf, show that the maximum offset from linearity would be ±0.6° C (at a depth of 22 m) for a rate of sinking or rising of 0.25 m year−1, or ±0.25°C for a rate of 0.10 m year−1. Our thermal measurements and profiles (Fig. 2) thus suggest a long-term sinking or rising rate of less than 10 × 10−2 m year−1, which is consistent with our long-term estimate of a surface accretion rate of 2 to 3 × 10⁻² m year−1.
Latent heat of crystallization effects of entrapped brines have not been considered because of the low salinities in all ice from the ice shelf and rises (Reference Ragle, Ragle, Blair and PerssonRagle and others, 1964; Reference Lyons, Lyons, Savin and TamburiLyons and other, 1971). Low rates of firn accumulation also mean that temperature perturbations because of this factor (Reference BenfieldBenfield, 1951) may also be disregarded. We believe, therefore, that all major factors which are likely to cause deflection of the thermal profile from linearity have now been taken into account, and that their straight-line configurations (Fig. 2) are consistent with predictions from heat-conduction theory, and with glaciological observations.
If the Earth’s normal sea-level heat flow is taken as 5.024 × 10⁻² J m−1 s−1, and the Ward Hunt Ice Shelf has an average conductivity of 2.217 × 10⁻² W m−1 deg−1, from the relation that heat flow equals thermal gradient times thermal conductivity, the “normal” geothermal gradient through the ice should be approximately 23 deg km−1. The best-fit straight line for the combined Cape Discovery, Camp Creek and innermost Ward Hunt ice rise holes, however, lies along a thermal gradient of 63.5 deg km−1, implying heat flow from the Earth of 14.235 × 10⁻² J m−1 s−1. Reference LachenbruchLachenbruch (1957[a], p. 1524–29) has discussed a similarly high heat-flow value from Resolute Bay, N.W.T., and has demonstrated that the effect there is due to the fact that the ocean formerly covered the area, providing heat which entered the Earth and is now being released along with radiogenically produced heat. At Resolute Bay, a geologically reasonable assumed retreat of the ocean 7 500 years ago explains the geothermal anomaly. Along northern Ellesmere Island, it is certain that the land immediately beneath the three ice rises now under discussion was covered by the ocean at least in the interval from 7 200 to 3 000 years ago, and possibly longer (Reference CraryCrary, 1960, p. 43), but that the ocean is retreating because of isostatic rebound (Reference Hattersley-SmithHattersley-Smith, 1969) or grounding of the ice rises. We believe that the thermal profiles from the ice rises represent approximate long-term thermal equilibrium, as measured in terms of a few thousands of years, and that these abnormally high thermal gradients, like those at Resolute Bay, are a necessary consequence of oceanic advance and retreat in post-Pleistocene time.
Grounding of the ice shelf
It is seen (Fig. 2) that the gradients in the grounded outermost and middle Ward Hunt ice rise holes are intermediate between those measured in freely floating ice (ridge thermal profile) and those which would be associated with the present abnormally high geothermal gradient. This suggests that thermal profiles in the grounded ice represent a transient thermal state, an analysis of which may lead to an age of the grounding. The assumption is made for reasons which have already been elaborated upon, that the thermal profiles are linear, and that ice has essentially the same diffusivity as the earth materials it contacts upon grounding.
Under these conditions, the ridge and ice-rise thermal profiles of Figure 2 may be taken to represent a special case of heat conduction through a semi-infinite solid with constant surface temperature (θ 3) and also an initial temperature of f (x) at some specified depth. We select this depth (a) as the bottom of the ice shelf at the instant of grounding.
At the time (t = 0) that the ice shelf contacts the ocean bottom, thermal conditions at its base will change, and the grounded ice will tend to establish equilibrium with present earth temperatures. These conditions may be visualized with the aid of Figure 3, in which curve I represents the thermal profile of the ice shelf at t = 0, curve II the present geothermal gradient below the ice at the instant of grounding, and curve III the present geothermal gradient through the ice in equilibrium with a surface at θ 3 = − 18.1° C. Curves between curves I–II and curve III are time-dependent; the effects of conduction subsequent to grounding will cause curves I–II to pass through the equilibrium configuration, curve III, which is parallel to curve II.
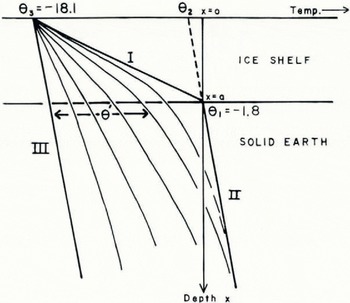
Fig. 3. Model showing the effect of grounding of an ice shelf, which causes the ice-shelf thermal profile (curve I) to migrate towards the equilibrium geothermal profile (curve III).
The departure of the family of curves illustrated from the equilibrium curve III will be called θ′. it is obtained from the following equation for one-directional heat conduction (Reference Carslaw and JaegerCarslaw and Jaeger, 1959, p. 24):

where α = thermal diffusivity, and boundary conditions are

Boundary condition (2) states that there is no temperature difference and no temperature change at the surface of an ice rise and an ice shelf at all times subsequent to ice-shelf grounding. Condition (3) specifics that below a floating ice shelf which has grounded and in an ice rise at thermal equilibrium there are two parallel geothermal profiles (curves II and III); the difference (θ 2−θ 3) is a measure of the maximum temperature shift which the base of the ice shelf undergoes subsequent to grounding. Condition (4), the equation for curve I (the ridge thermal profile) specifies conditions within the ice shelf at the instant of grounding, and (5) states that, as grounding occurs, at all depths below the bottom of the ice shelf, as in condition (3), there are two parallel geothermal profiles whose difference is (θ 2−θ 3). Implicit in conditions (3) and (5) is the assumption that the thermal diffusivity of ice and of the solid earth are essentially equal, so that there is no deflection of the thermal profile of an ice rise as it passes downward from the ice into the ground. θ′ is a variable with limits between 0 and (θ 2−θ 3), and is dependent upon x, a and t.
The general solution for this special case of the semi-infinite solid with constant surface temperature and initial bottom temperature f(x) is (Reference Carslaw and JaegerCarslaw and Jaeger, 1959, p. 59):

Equation (6) may be integrated into the following form:

At the interface between ice and ground (x = a) this simplifies to

A major uncertainty connected with the calculations concerns the depth x = a. The outermost Ward Hunt ice rise hole has a depth of 52 m, but the average ice-shelf thickness is 43 m. Consequently, in Table I, several values of a have been tried. The temperature at the base of the ice at the instant of grounding is also assumed to be −1.8° C (sea-water temperature), although it is entirely possible that for some parts of the ice shelf a temperature of 0° C is more appropriate because brackish ice is crystallizing there (Reference Lyons, Lyons, Savin and TamburiLyons and others, 1971). Computations have been made using Equation (8) and data from Figure 2.
Table I. Calculated Times of Grounding of the Ward Hunt Ice Shelf

Because brackish ice is not found in the outer ice shelf and ice rise cores, we regard a bottom temperature of − 1.80° C as more probable. We also believe, for reasons to be discussed, that thickening of the ice, rather than isostatic rebound, is the main cause for grounding of the Ward Hunt ice rise. Consequently, we prefer the 55 m thick models and ages of 247–275 and 313–337 years for times of grounding at the outermost (northernmost) and intermediate drilling sites of the Ward Hunt ice rise (cf. Fig. 1).
An alternative but difficult-to-defend approach to the thermal data would be to assume that the present geothermal gradient does not reflect a disturbance owing to retreat of the Arctic Ocean and that all thermal profiles should be considered in reference to the “normal” profile of 23° C km−1. It would also be necessary to assume that all three ice rises had been grounded, in their presently thickest parts, at approximately the same time. For a 55 km thick ice shelf, times of grounding of the Ward Hunt ice rise would be 1 436, 192 and 163 years for the southernmost (inner), middle and northernmost (outer) drilling sites, respectively. Although these ages are not totally unreasonable, we regard them as unlikely in the light of the stratigraphic–structural and thermal considerations we have already described.
Discussion
The thermal conductivity approach to the unraveling of late-glacial events is independent of ice stratigraphy or radiocarbon dating, and yet provides a consistent cross-check with the results of these methods. Our original aim, in the 196g drilling, was to determine depth (and elevation) of the top of the sea ice in a series of north–south holes in the Ward Hunt ice rise, and to combine this information with thermal conductivity calculations of the times of grounding in order to measure the rate of isostatic rebound along northern Ellesmere Island. Unfortunately, difficulties with both the thermal and mechanical drills prevented the full realization of this objective.
The best quantitative data on the rate of isostatic rebound of Ellesmere Island are those of Reference Hattersley-Smith and LongHattersley-Smith and Long (1967) which show that in the last 250–350 years isostatic uplift should have amounted to no more than 1.5 m. Grounding of the Ward Hunt Ice Shelf, and its partial conversion into the Ward Hunt ice rise is, therefore, primarily due to two factors:
-
1. A gradual thickening of the ice in a southward direction toward Ward Hunt Island, reflecting an increasing rate of firn accumulation in that area; this factor alone would cause the outer part of the Ward Hunt ice rise, were it freely floating, to project 8 m below the average depth of the bottom of the ice shelf.
-
2. The availability of a gently sloping sea floor north of Ward Hunt Island, which has been contoured (from gravity observations) by F. A. Crowley of Air Force Cambridge Research Laboratories. Crowley’s map (unpublished) shows a fiord extending to depths of 860 m below sea-level between Ward Hunt and Ellesmere Islands.
The localization of the Camp Creek, Cape Discovery and Ward Hunt ice rises is apparently topographically controlled (cf. Fig. 1); all three may be thought of as massive snowdrifts which have developed where coastline deflections and topographic highs presented obstructions to the west-north-westerly storm tracks across northern Ellesmere island, and where suitable areas existed for build-up of firn.
If, as is proposed, snowdrift accumulation is the main cause of the growth of the Ellesmere Island ice rises, it is noteworthy that there is no topographic build-up on the lee (easterly) and southerly sides of Ward Hunt Island, as we might expect in the case of a snowdrift developing about a large obstruction (i.e. Ward Hunt Island). This is because, as firn accumulates on these areas of the ice shelf, and as the ice shelf is depressed, it has no platform on which it can come to rest. Instead, an equilibrium ice-shelf thickness is maintained because of ablation on the underside of the ice shelf by fresh or brackish melt water originating largely from Ellesmere Island. The synclinal structure shown by the heavy dust layer of the ice shelf between Ellesmere and Ward Hunt Islands is explicable on this basis. Elsewhere (Reference Lyons and RagleLyons and Ragle, 1962, p. 94), we have shown that a heat influx of 3 300–4 200 J m−1 year−1 at the underside of the ice shelf is sufficient to maintain equilibrium thickness of 43 m if firn is accumulating at the surface at the rate of 2 to 3 × 10⁻² m year−1.
We have no way of establishing a chronology for the initial time of formation of the Ellesmere Island ice rises except to note that it must be later than the initial time of formation of the Ward Hunt Ice Shelf 3 000 years ago (Reference CraryCrary, 1960). Reference Dansgaard, Dansgaard, Johnsen, Møller and LangwayDansgaard and others’ (1969) detection of climatic amelioration in Greenland 2 000–1 600 years ago tends to support Reference CraryCrary’s (1960) estimate of 1 600 years as the termination date of the ablation cycle now represented by the heavy dust later of the Ward Hunt Ice Shelf. It is curious, however, that the ice-shelf stratigraphy as we now understand it does not record the climatic optimum bracketed by Reference Dansgaard, Dansgaard, Johnsen, Møller and LangwayDansgaard and others (1969) between 1 450 and 810 years ago. Accepting the 1 600 year date for the dust means, as we have pointed out at Camp Creek, that most of the build-up of these ice rises must be younger than 1 600 years. Dansgaard’s results further suggest that major ice-shelf growth probably occurred between 1 000 and 150 years ago.
The calculated age of 250–350 years for the grounding of part of the Ward Hunt ice rise is consistent with a climatic deterioration in Greenland (Reference Dansgaard, Dansgaard, Johnsen, Møller and LangwayDansgaard and others, 1969, fig. 2) at that time (the so-called “Little Ice Age” of the seventeenth and eighteenth centuries), and the net negative mass balance of the ice shelf during the past century (Reference CraryCrary, 1960; Reference Hattersley-Smith and SersonHattersley-Smith and Scrson, 1970) is also predicted by the Greenland data.
Acknowledgements
Dr A. H. Lachenbruch first pointed out to the writers the methods for setting up and solving the heat-conduction relations used in this paper and, although he has declined co-authorship, we are indebted to him for one of the central ideas of this contribution. H. W. C. Aamot, R. T. Atkins and L. E. Stanley of U.S. Army C.R.R.E.L. were most helpful with technical advice and the loan of equipment for thermal drilling and thermistor readings. The Canadian Defence Research Board, and Dr G. Hattersley-Smith, J. Keys and H. Serson of that organization, helped both logistically and in the field. Financial and logistic support was also provided by Air Force Cambridge Research Laboratories, U.S. Army C.R.R.E.L. and the Arctic Institute of North America. Finally, none of our results would have been possible without the excellent co-operation of field assistants J. R. T. Molhohn, R. G. Blair, F. G. Leavitt and R. B. Petrie.
We should also like to record our appreciation to Dr G. Hattersley-Smith for a critical reading of an earlier draft of this paper.


