


1. Introduction
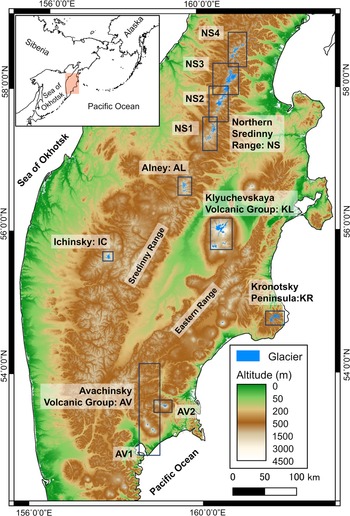
The Kamchatka Peninsula is a 1250 km long (51–61° N) and 450 km wide (155–163° E) peninsula located in the Russian Far East (Fig. 1). The land is bounded by the North Pacific Ocean to the east and the Sea of Okhotsk to the west. The geography of the Kamchatka Peninsula is characterized by numerous volcanoes and glaciers (Braitseva and others, Reference Braitseva, Melekestsev, Ponomareva and Sulerzhitsky1995, Reference Braitseva, Ponomareva, Sulerzhitsky, Melekestsev and Bailey1997; Muravyev, Reference Muravyev1999; Ponomareva and others, Reference Ponomareva2007). Two volcanic ranges situated parallel to the peninsula are the Eastern and the Sredinny Ranges (Fig. 1). The Eastern Range, located along the east coast of the peninsula, consists of a number of active volcanoes, ~30 of which are covered by glaciers (Muravyev, Reference Muravyev1999). The Sredinny Range runs through the central part of the peninsula, dividing Kamchatka into eastern and western regions. In contrast to the Eastern Range, volcanoes in the Sredinny Range are mostly inactive, and parts of the eastern and western slopes are covered by valley glaciers. Glaciers also cover non-volcanic mountains on the Kronotsky Peninsula on the mid-eastern coast of Kamchatka (Fig. 1). These glaciers are distributed in significantly lower elevation areas (<1300 m a.s.l.) as compared with those in the Eastern (<4500 m a.s.l.) and Sredinny Ranges (<3650 m a.s.l.).

Fig. 1. Map of the Kamchatka Peninsula with elevation based on ALOS World 3D shown by the color scale. The inset shows the location of the study area in the North Pacific area. Glacier-covered areas based on Randolph Glacier Inventory (RGI) (RGI consortium, 2017) are shown in blue. Studied regions are indicated by the boxes: AV (Avachinsky Volcanic Group), KR (Kronotsky Peninsula), KL (Klyuchevskaya Volcanic Group), IC (Ichinsky), AL (Alney) and NS (Northern Sredinny Range). The numbers show sub-regions in AV (Avachinsky and Zhupanovsky) and NS (NS1 (Shishel), NS2 (Khuvkhoitun), NS3 (Ostry) and NS4 (Tylele and Pauk).
The climate in Kamchatka is strongly affected by the Siberian High and the Aleutian Low. In winter, low-pressure systems migrating to the northern Pacific Ocean deliver a large amount of precipitation to the east coast of the peninsula. Along the west coast, precipitation in winter is relatively low because sea ice covers the Sea of Okhotsk. For this reason, there is a vast difference between winter precipitation on the eastern and western coastlines (Muravyev, Reference Muravyev1999; Shiraiwa and Tchoumitchev, Reference Shiraiwa and Tchoumitchev2002; Solomina and others, Reference Solomina, Wiles, Shiraiwa and D'Arrigo2007). This precipitation pattern affects the equilibrium line altitude (ELA) of the glaciers, i.e. the ELA lies at a lower elevation in the east (e.g. 700 m a.s.l. in the Kronotsky Peninsula) and at a higher elevation in the west (e.g. 2400 m a.s.l. in Ichinsky) (Muravyev, Reference Muravyev1999).
In recent years, glaciers on the Kamchatka Peninsula have been rapidly retreating. The total area of glaciers in Kamchatka decreased from 874 km2 in the period 1940–70 (Khromova and others, Reference Khromova, Nosenko, Kutuzov, Muraviev and Chernova2014) to 593 km2 in 2000–14 (Lynch and others, Reference Lynch, Barr, Mullan and Ruffell2016). The areal loss accelerated from 0.24–0.29% a−1 in the period 1950s–2000 to 1.76% a−1 in 2000–14 (Lynch and others, Reference Lynch, Barr, Mullan and Ruffell2016). Ananicheva and others (Reference Ananicheva, Krenke and Barry2010) projected that the total glacier area will reduce by 70% from the measurements taken in the period 1960–91 to the middle of the 21st century (2049–60). Despite studies on the areal changes of the glaciers, glacier volume change on the Kamchatka Peninsula is poorly understood because mass balance has been reported only for the past century based on glaciological measurement on several glaciers. Glacier mass balance for Mutnovsky Glacier on the southern Eastern Range was recorded for the period 1979–84 (World Glacier Monitoring Service (WGMS), 2020), for Kozelsky Glacier in the Avachinsky Volcanic Group (AV1 in Fig. 1) from 1972 to 1997 (WGMS, 2020), for Kropotkin Glacier on the Eastern Range from 1984 to 1985 (WGMS, 2020), for Koryto Glacier on the Kronotsky Peninsula from 1959 to 2000 (Yamaguchi and others, Reference Yamaguchi, Naruse, Sugiyama, Matsumoto and Muravyev2003; WGMS, 2020) and for Grechishkin Glacier in the Northern Sredinny Range (NS3 in Fig. 1) from 1978 to 1979 (WGMS, 2020). No mass-balance data are available for individual glaciers after 2000, at which time glaciers on the Kamchatka Peninsula began rapidly retreating (Lynch and others, Reference Lynch, Barr, Mullan and Ruffell2016).
Mass loss of mountain glaciers accounted for ~80% of the global sea level rise from 2006 to 2016 (Zemp and others, Reference Zemp2019). For this reason, accurate quantification of glacier change all over the world is important. Total ice mass loss in Northern Asia (Altai, Ural, Russian Far East including the Kamchatka Peninsula) was reported as −0.37 ± 0.31 m w.e. a−1 for the period 2006–16, but this value was based on data from only <4% of the glaciated area (Zemp and others, Reference Zemp2019). More recently, Hugonnet and others (Reference Hugonnet2021) reported a mass loss of −1.3 ± 0.4 Gt a−1 in the North Asia region for the period 2000–19 based on more extensive satellite datasets. Despite the new datasets provided by the recent studies, the ice loss on the Kamchatka Peninsula was reported as a portion of the global analysis. Thus, a more comprehensive regional study is required to understand the detailed changes of the glaciers, which account for 23% of the glacier area in Northern Asia (Khromova and others, Reference Khromova, Nosenko, Kutuzov, Muraviev and Chernova2014). Glaciers on the Kamchatka Peninsula are also important because of their link to ocean circulations in the Sea of Okhotsk and the Pacific Ocean. Freshwater input to the Sea of Okhotsk from the surrounding land controls the formation of the dense shelf water, which plays a key role in the circulation of the North Pacific Intermediate Water (e.g. Ohshima and others, Reference Ohshima, Nakanowatari, Riser, Volkov and Wakatsuchi2014). Changes in the glaciers impact the ocean system because runoff from the Kamchatka Peninsula is a major source of fresh water for the Sea of Okhotsk (Uehara and others, Reference Uehara2014; Shi and others, Reference Shi, Shiraiwa, Mitsudera and Muravyev2021).
In this study, we quantified the glacier mass change in the Kamchatka Peninsula during the period 2000–16, based on available DEMs as well as those we generated by satellite photogrammetry. The results were analyzed with climatic trends and glacier geometries to investigate the mechanism driving the recent glacier mass loss in the region and its spatiotemporal variations.
2. Study site
On the Kamchatka Peninsula, 80% of glacier area is located in the Eastern Range (28%), the Kronotsky Peninsula (9%) and the Sredinny Range (44%) (Muraviev, Reference Muraviev2017). In the Eastern Range, several glaciers cover stratovolcanoes in the Avachinsky Volcanic Group and the Klyuchevskaya Volcanic Group (Fig. 1). Many of the glaciers are affected by volcanic activities in these regions. Three glaciers in the Klyuchevskaya Volcanic Group are advancing, which is attributed to volcanogenic landslide deposition on the glacier surface, as well as glacier sliding caused by volcanic earthquakes and basal melting due to high geothermal heat flux (Muraviev and Muraviev, Reference Muraviev and Muraviev2016; Dokukin and others, Reference Dokukin, Seynova, Savernyuk and Chernomorets2017; Barr and others, Reference Barr, Lynch, Mullan, De Siena and Spagnolo2018a, Reference Barr2018b). The ice cap on the caldera of Mount Ushkovsky is frequently covered by volcanic ash, which enhances melting by reducing surface albedo (Shiraiwa and others, Reference Shiraiwa2001). Bogdanovich (41.4 km2) and Erman glaciers (40.5 km2), which flow down from Mount Ushkovsky and Klyuchevskaya, are the largest and the second largest glaciers on the Kamchatka Peninsula (Dokukin and others, Reference Dokukin, Seynova, Savernyuk and Chernomorets2017). During the period from 1950 to 2015, glacier areas in the Avachinsky and Klyuchevskaya Volcanic Groups increased by 4.3 and 6.5%, respectively (Muraviev and Muraviev, Reference Muraviev and Muraviev2016; Muraviev, Reference Muraviev2017). Glaciers on the Kronotsky Peninsula are situated in relatively low elevation areas (280–1270 m a.s.l.) and are characterized by debris-free ice surfaces. The glaciers are subjected to maritime climate. Thus, glacier mass balance is dominated by intensive summer melting and large amounts of winter precipitation (~700 mm from November to March) (Solomina and others, Reference Solomina, Wiles, Shiraiwa and D'Arrigo2007; Yamaguchi and others, Reference Yamaguchi, Naruse and Shiraiwa2008). In this region, the glacier area decreased by 27.6% from 1957 to 2013, which was the most rapid glacier retreat in Kamchatka during the period (Muraviev, Reference Muraviev2017). The largest glacierized region, Sredinny Range, is subdivided into Ichinsky, Alney and the Northern Sredinny Ranges (Fig. 1). In the Ichinsky region, a large volcanic mountain, Mount Ichinsky, is covered by a dome-shaped glacier and 13 outlet glaciers (Matoba and others, Reference Matoba2007, Reference Matoba, Shiraiwa, Tsushima, Sasaki and Muravyev2011; Muraviev, Reference Muraviev2017). Most of the glaciers in Alney and Northern Sredinny Ranges are valley or cirque glaciers (Muravyev, Reference Muravyev1999; Shiraiwa and Yamaguchi, Reference Shiraiwa and Yamaguchi2002). During the period 1950–2014, glacier area decreased in Alney (−19.5%) and Northern Sredinny Ranges (−16.6%), but was relatively stable in Ichinsky (−0.7%) (Muraviev, Reference Muraviev2017).
In this study, we measured changes in glacier area and surface elevation in the major six regions described above – AV: Avachinsky Volcanic Group, KR: Kronotsky Peninsula, KL: Klyuchevskaya Volcanic Group, IC: Ichinsky, AL: Alney and NS: Northern Sredinny Ranges (Fig. 1). Furthermore, the AV and NS regions are divided into sub-regions – AV1: Avachinsky, AV2: Zhupanovsky, NS1: Shishel, NS2: Khuvkhoitun, NS3: Ostry and NS4: Tylele and Pauk. These regions cover 89% of the total glacier area on the Kamchatka Peninsula. Small glaciers scattered throughout other regions are analyzed only for changes in the area, but not for the surface elevation. These glaciers cover 60 km2 in total, which accounts for 11% of the entire glacier area in Kamchatka.
3. Data and method
3.1. Glacier outline and area
Glacier outlines were delineated manually based on the Landsat 7 Enhanced Thematic Mapper Plus (ETM+) and Landsat 8 Operational Land Imager (OLI) images acquired in 2000‒02 and 2014‒16 (Table S1). The images were downloaded from the Earth Explorer website maintained by the United States Geological Survey (http://earthexplorer.usgs.gov/). We used the ETM+ and OLI images with a spatial resolution of 30 m. Debris-covered glaciers located in AV, KL and IC were delineated with the aid of surface topographic features arising from ice movement (Barr and others, Reference Barr, Lynch, Mullan, De Siena and Spagnolo2018b). Debris-covered and debris-free areas were distinguished based on surface features on the Landsat false color imagery. The ArcticDEM shade maps with 7 m resolutions were used for this purpose (Noh and Howat, Reference Noh and Howat2015; Morin and others, Reference Morin2016). Based on the outlines obtained, the glacier area in each region was calculated for the periods 2000/01/02 and 2014/15/16. Uncertainty in the area measurement δA was estimated as

where n is the number of glaciers in the region, A i is the area of an individual glacier computed from a manually delineated outline and $\hat{A}_i$ is the area obtained after the conversion of the polygon to a raster image composed of 30 m × 30 m pixels (Bajracharya and others, Reference Bajracharya, Maharjan and Shrestha2014).
3.2. Surface elevation and mass change
3.2.1. Data
Changes in glacier surface elevation from 2000 to 2016 were analyzed using DEMs generated in this study, as well as those available in the study region. If available, DEMs obtained in summer (June–September) were chosen, in order to minimize the influence of seasonal variations (Tables S2 and S3). We used DEMs from four data sources:
(1) SRTM: SRTM DEM is an elevation model obtained from a synthetic aperture radar survey performed in February 2000 (Farr and others, Reference Farr2007). C-band void-filled elevation data (SRTM Global 1 arcsec V003) is distributed by the National Aeronautics and Space Administration at the Earthdata website (https://search.earthdata.nasa.gov/). The spatial resolution is 30 m and the accuracy of the elevation was reported as being 6.9 m (Mukul and others, Reference Mukul, Srivastava and Mukul2015). The DEM was bilinearly resampled into a mesh based on WGS 84/UTM zone 57.
(2) ArcticDEM: ArcticDEM is a set of DEMs generated from high-resolution stereo pair imagery acquired by Worldview series and GeoEye-1 satellites (Noh and Howat, Reference Noh and Howat2015; Morin and others, Reference Morin2016). The DEMs are provided by the Polar Geospatial Center at https://data.pgc.umn.edu/elev/dem/setsm/ArcticDEM/. We used ArcticDEM Release 7, which covered the Kamchatka Peninsula for the period 2014–16 (Table S2). Original data available with a 2 m pixel size in NSIDC Sea Ice Polar Stereographic North were bilinearly resampled into a 30 m pixel size in UTM zone 57. The RMSE of ArcticDEM is reported as being 3.8 m in horizontal and 2.0 m in vertical directions (Noh and Howat, Reference Noh and Howat2015).
(3) ALOS: ALOS operated in 2006–11 was equipped with the PRISM sensor, which simultaneously obtained forward, nadir and back imagery in a resolution of 2.5 m. In this study, we generated DEMs for 2006 and 2010 from forward and nadir 1B2 level stereo imagery provided by the Remote Sensing Technology Center of Japan (Table S3). The rational polynomial coefficients files were used for geo-referencing the imagery.
The stereo pair imagery was processed for generating DEMs with a digital map plotting apparatus consisting of a stereo mirror monitor (SD2020, Planar Systems), 3-D-mouse (Topo Mouse, Leica Geosystems) and digital photogrammetric software (ERDAS IMAGINE 2018). Ground surface elevations were measured manually in a stereoscopic 3-D space generated by the mirror monitor, so that the study area was covered by a triangulate irregular network (TIN). Details of the procedure are described in the work of Kääb and others (Reference Kääb, Haeberli and Gudmundsson1997). Elevations were measured more densely near topographic tipping points (i.e. ridges and valleys), so that surface topography was smoothly represented by a TIN. The TIN was converted into a 30 m pixel size raster DEM with linear interpolation. The maximum elevation error of DEMs generated by the same apparatus and procedure was between 4 and 10 m (Lamsal and others, Reference Lamsal, Sawagaki and Watanabe2011; Sawagaki and others, Reference Sawagaki, Lamsal, Byers and Watanabe2012).
(4) ASTER: The ASTER sensor mounted on the Terra satellite has been operating since 1999. We generated DEMs for 2011, 2014, 2015 and 2016 from nadir and backward stereo imagery with a resolution of 30 m (Table S3). Imagery downloaded from https://search.earthdata.nasa.gov/ were processed using the same apparatus and procedures as described above. The RMSE of ASTER DEMs computed with SRTM DEMs as a reference was reported as being 34.8 m (Cuartero and others, Reference Cuartero, Felicísimo and Ariza2004).
3.2.2. Horizontal bias, C-band radar penetration and snow depth
Co-registration of the DEMs was performed to correct the horizontal biases (Nuth and Kääb, Reference Nuth and Kääb2011). By using ArcticDEM as a reference, the horizontal biases of the DEMs were determined using the aspect dependence of elevation difference over stable off-glacier areas.
SRTM C-band DEM is affected by the penetration of the radar signal into snow and ice (Gardelle and others, Reference Gardelle, Berthier and Arnaud2012). The influence of the penetration was reduced by comparing the data with SRTM X-band DEM, which was simultaneously acquired with the C-band DEM. Since the penetration depth of the X-band radar signal is short, we corrected the C-band DEM elevation for the difference from the X-band DEM (e.g. Gardelle and others, Reference Gardelle, Berthier and Arnaud2012; Zhou and others, Reference Zhou, Li, Li, Zhao and Ding2018). The X-band DEM was co-registered to the C-band DEM, following the method proposed by Nuth and Kääb (Reference Nuth and Kääb2011). The influence was not entirely removed because the X-band radar still penetrates into dry snow. Nevertheless, its impact on long-term mean elevation change rates is small and the penetration effectively eliminates the bias due to snow deposition in the ablation area as explained below.
We used DEMs acquired in the ablation season (preferably at the end of summer) as available. However, SRTM DEM and two ArcticDEMs were acquired in the accumulation season (February and April). In this study, we disregarded the possible influence of snow cover on the analysis because of the following reasons:
(1) Correction is difficult because snow depth data are unavailable.
(2) According to the survey performed by the Academic Alpine Club of Hokkaido University (AACH) in the NS region in April 2016 (1st–21st), the snow depth at 20 locations on and off the glaciers at 160–1960 m a.s.l. was 0.13–2.26 m with a mean of 1.09 m (Hazuki and others, Reference Hazuki, Fukumoto, Kondo, Yamazaki and Nakaoka2016). The influence of this amount of snow on annual mass change in 2000–16 is equal to only 0.03 m w.e a−1 with a snow density of 500 kg m−3.
(3) The snow depth surveyed by AACH showed a minor difference on and off glaciers (Hazuki and others, Reference Hazuki, Fukumoto, Kondo, Yamazaki and Nakaoka2016). Therefore, the effect of the snow cover was canceled out by the corrections of the DEMs for vertical shift as described in the following section.
(4) For the SRTM DEM, the effect of snow deposition was reduced by penetration of the X-band radar into seasonal dry snowpack, which was disregarded in the correction described above.
3.2.3. Elevation change
Glacier surface elevation changes were measured by calculating the differences between DEMs in two different years t 1 and t 2 (Δh 1–2). The vertical coordinates of the DEMs were corrected for elevation difference in ice-free areas ($\Delta h_{1\ndash 2}^{{\rm ground}}$ , Table 1). The ice-free areas were taken over an area greater than the glaciers, excluding steep terrain with a slope >30°. The correction was performed by subtracting the mode of pixelwise elevation change calculated in the ice-free area.
Table 1. DEMs used in this study for surface elevation change measurement

In each 50 m elevation band, pixels showing elevation change greater than three times the std dev. were excluded as outliers. We also eliminated pixels showing more than 100 m elevation change, which occurred mostly along the glacier boundaries.
In general, photogrammetric analysis is difficult in regions which are cloud-covered, snow-covered or have low-contrast areas and hill shading. For regions where elevation measurements were unavailable, we assumed the mean elevation change as being the value obtained in the same elevation range in the same region. The mean elevation change was calculated for every 50 m elevation bin in each of the six study regions. With this method, so-called global mean hypsometric method, errors are introduced in each individual glacier, but reasonably good estimation is acquired for a regional mean elevation change (McNabb and others, Reference McNabb, Nuth, Kääb and Girod2019). In case no measurement was obtained in an elevation band, we applied third-order polynomial fitting to interpolate or extrapolate a relationship between altitude and elevation change. This procedure was applied to 7.9% of the glacier area studied.
3.2.4. Mass change
Surface elevation change was integrated over glacier areas to obtain volume change from t 1 to t 2 (ΔV 1–2). Specific mass change (Δb 1–2) was calculated by following Zemp and others (Reference Zemp2019):

where A is the glacier area averaged over the period from t 1 to t 2. ρ w and ρ i are the densities of water (1000 kg m−3) and snow/ice, respectively. We assumed the density of snow/ice as being 850 kg m−3, which is a value commonly applied to alpine glaciers (Huss, Reference Huss2013). Uncertainty in the specific mass change (δb 1–2) was computed by

where Δt = t 2 − t 1, Δh 1–2/Δt is the elevation change rate, δA is the uncertainty in the glacier area described in Eqn (1) and δρ i is the uncertainty in the snow/ice density. We assumed δρ i as being ±60 kg m−3 (Huss, Reference Huss2013). The standard error of the elevation change rate δ(Δh 1–2/Δt) was calculated by

where σ(Δh 1–2/Δt) is the std dev. of the elevation change rate, and N eff is the number of the elevation measurement used to obtain the mean elevation change (Gardelle and others, Reference Gardelle, Berthier, Arnaud and Kääb2013). The values of N eff for the manually generated ALOS and ASTER DEMs were obtained by counting the measurements of photogrammetric analysis (mean densities: 112 and 45 km−2 for ALOS and ASTER). Because N eff is not reported for ArcticDEMs, the value was estimated from the distance of autocorrelation of off-glacier elevation change:

where N tot is the pixel number in the ice-free area, Δx is the pixel size (30 m) and d is the distance of autocorrelation. We applied Moran's I autocorrelation index on elevation change in ice-free areas to estimate d (90–1230 m) (Bolch and others, Reference Bolch, Pieczonka and Benn2011; Gardelle and others, Reference Gardelle, Berthier, Arnaud and Kääb2013). When compared with SRTM DEM, the standard errors of the elevation change were in the range of 0.05–0.27 m (ArcticDEMs), 0.04–0.06 m (ALOS DEMs) and 0.09–0.67 m (ASTER DEMs), respectively.
3.3 Climate data
We analyzed the National Centers for Environmental Prediction Climate Forecast System Reanalysis (NCEP/CFSR) for summer temperatures (June–September) and winter precipitation (November–April) from 1985 to 2013 (Saha and others, Reference Saha2010; Fuka and others, Reference Fuka, MacAllister, Degaetano and Easton2013; Dile and Srinivasan, Reference Dile and Srinivasan2014). We assumed the contribution of liquid precipitation is negligible from November to April. The dataset, with a resolution of 0.3° ´ 0.3°, was downloaded from the Texas A&M University website (https://globalweather.tamu.edu/) and analyzed for an area of 52.9–59.8° N and 156.9–163.4° E. The influence of Pacific climate variability on glacier changes in the Kamchatka Peninsula was examined, using the Pacific decadal oscillation (PDO) index from 1990 to 2016 as downloaded from the website of the National Centers for Environmental Information (https://www.ncdc.noaa.gov/teleconnections/pdo/) (e.g. Mantua and others, Reference Mantua, Hare, Zhang, Wallace and Francis1997).
4. Results
4.1. Glacier area change
During the study period from 2000 to 2016, the total area of the glaciers on the Kamchatka Peninsula decreased from 800.6 ± 13.0 to 646.7 ± 10.6 km2 (Table 2). The greatest change was observed in NS (−6.8 ± 0.9 km2 a−1 from 2002 to 2016), which accounted for 70% of the total area lost during the study period (Table 2, Figs 2a, c). This result can be attributed to the largest glacier area among the six regions, i.e. glaciers in NS cover 36.1% of the total glacier area in Kamchatka. The area-loss rate relative to the glacier area was the greatest in AL (−2.9% a−1 from 2002 to 2016) (Table 2, Figs 2a, c). In contrast to the overall trend of glacial retreat, 17 glaciers located on active volcanoes in the KL region have shown an increase in area (e.g. +0.8 km2 at Erman Glacier in 2000–14).
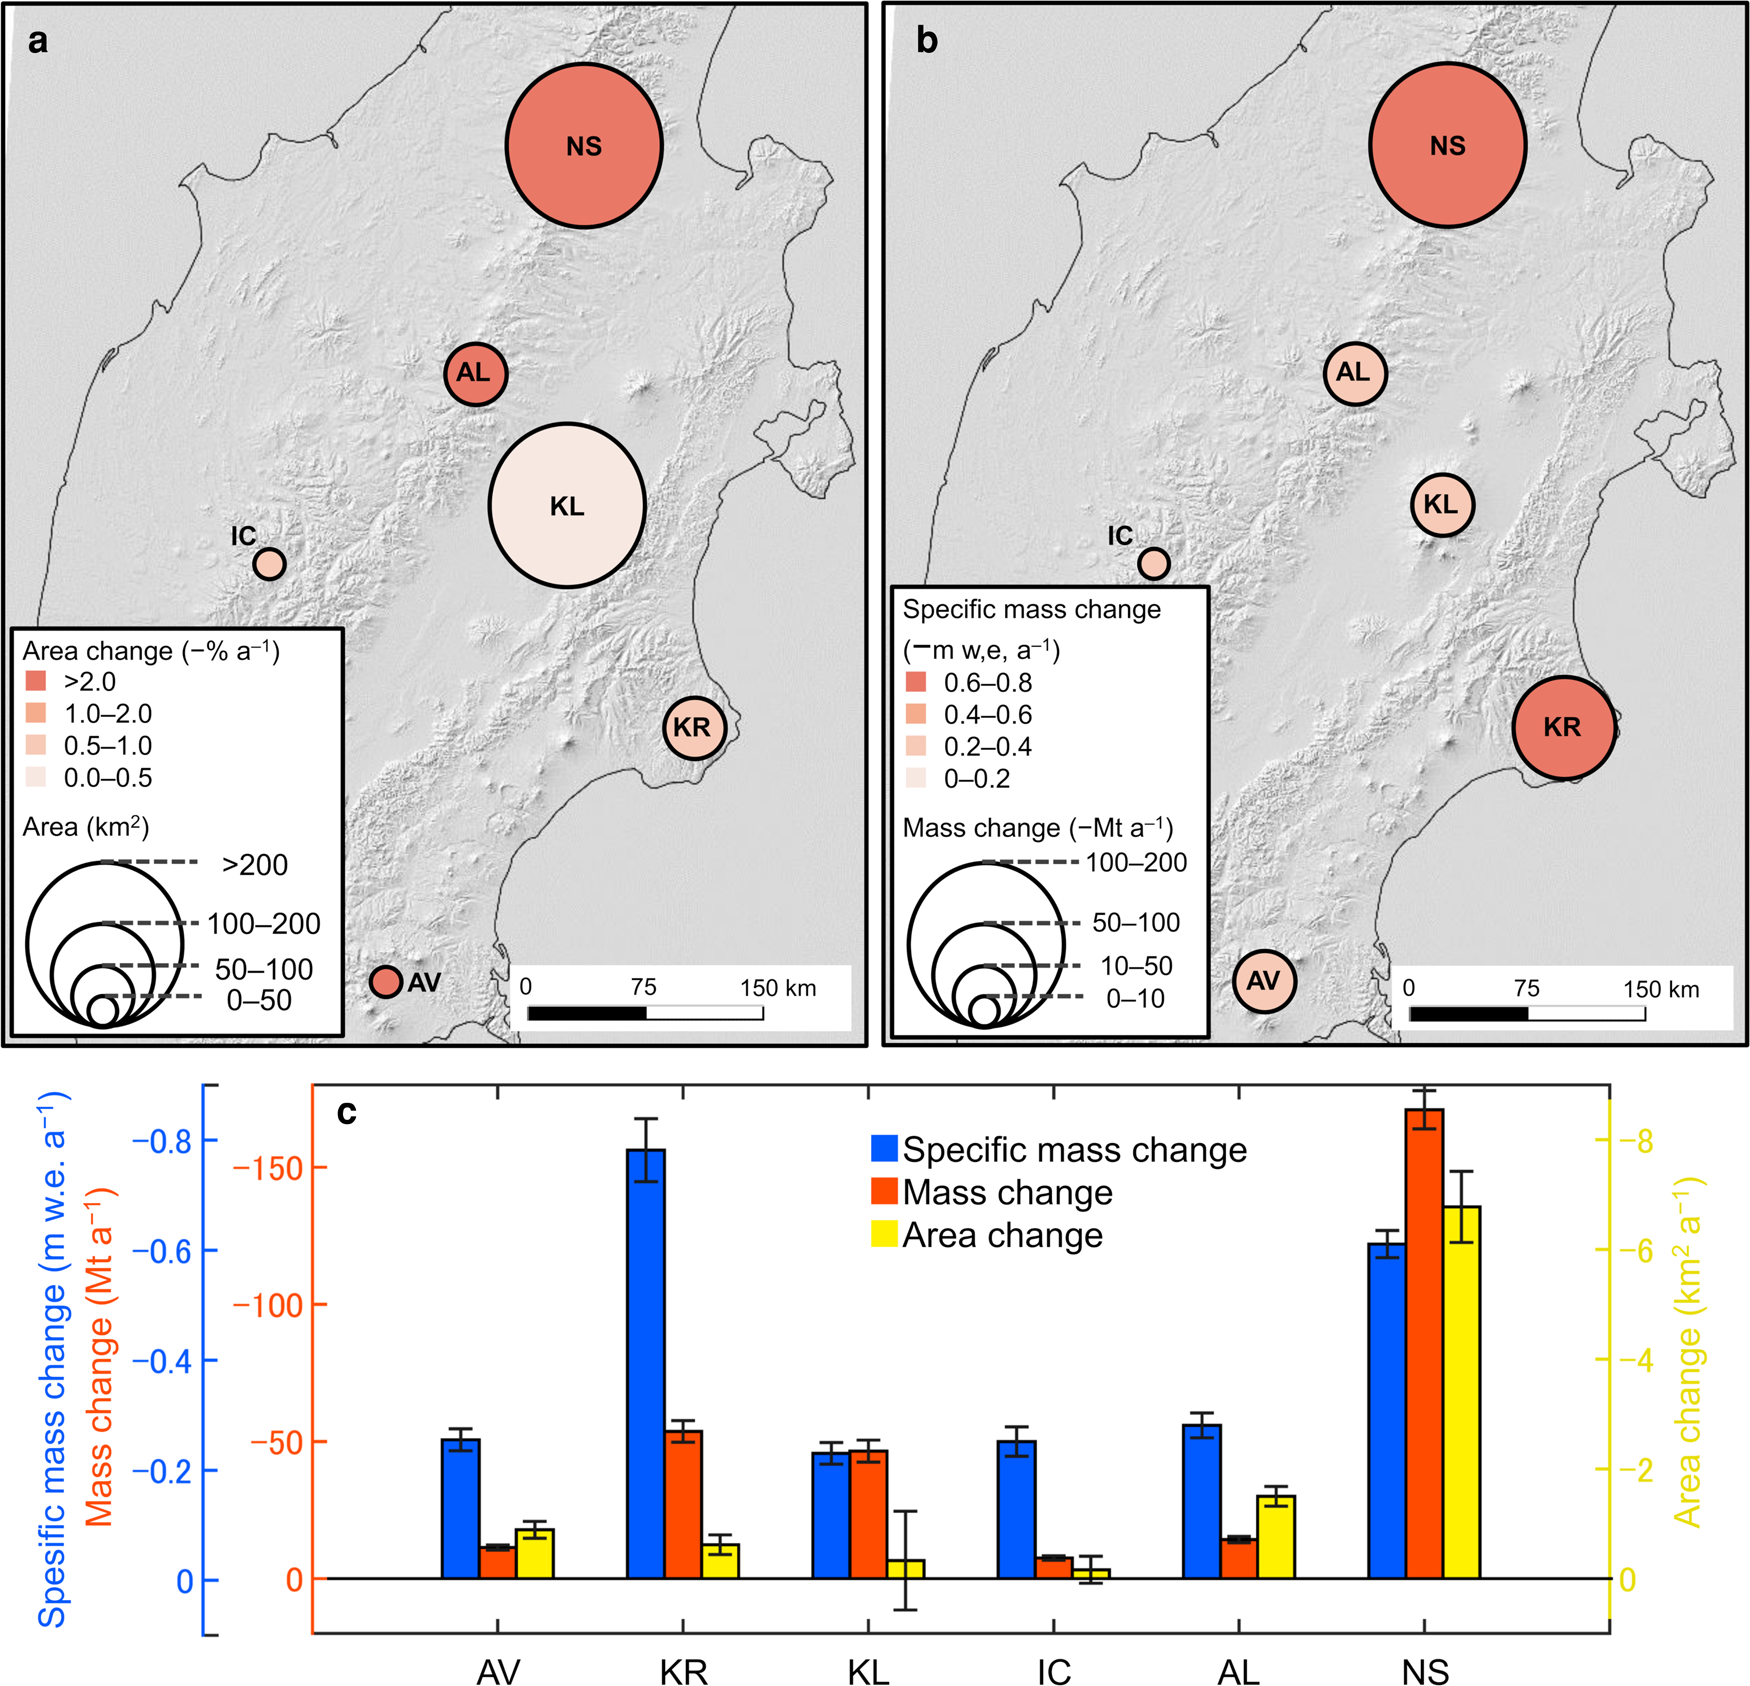
Fig. 2. (a) Glacier area (marker size) and areal change rate from 2000/2002 to 2014/15/16 (color scale) in each region. (b) Rates of glacier mass change (marker size) and mean specific mass change (color scale) from 2000 to 2014/15/16 in each region. (c) Mass change (red), specific mass change (blue) and areal change (yellow) in each region as presented in (a) and (b).
Table 2. Glacier areas and rates of areal and mass changes in the study regions

Glacier areas are as in the years given by t 2.
4.2. Glacier mass change
Over the Kamchatka Peninsula, glacier surface elevation showed a generally decreasing trend (−0.47 ± 0.03 m a−1) (Figs 3, 4). The mean specific mass change of the glaciers studied in 2000–16 was −0.46 ± 0.01 m w.e. a−1 (Table 2). The greatest specific mass loss was observed in KR (−0.78 ± 0.06 m w.e. a−1) (Table 2, Figs 2b, c and 3c), a region located near the east coast, characterized by maritime climate conditions. The second largest mass loss was observed in NS (−0.61 ± 0.02 m w.e. a−1) (Table 2, Figs 2b, c and 4b–e), the northernmost region, where 41% of the studied glacier area is located. Similar changes were observed in AV, KL, IC and AL (Table 2, Figs 2b, c, 3a, b, d, e and 4a). Specific mass loss in AV was only 32% of KR, although both of these two regions are situated near the eastern coastline (Table 2, Figs 2b, c and 3a–c). While IC, AL and NS are located on the same mountain range, the specific mass loss in IC and AL was only 41 and 46% of NS, respectively. No correlation between specific mass loss and areal reduction in each region was observed (Table 2, Fig. 2).

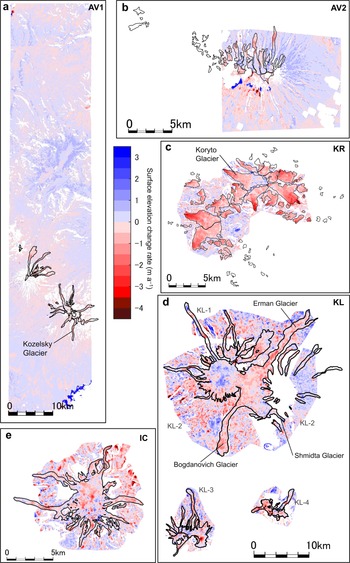
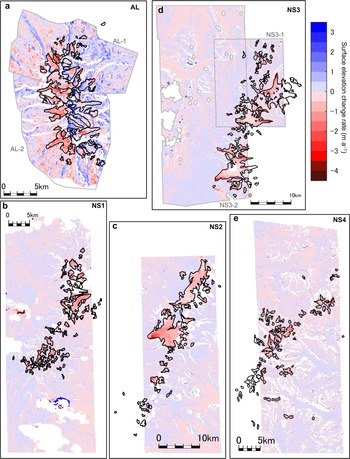
Fig. 3. Maps of glacier elevation change in (a) AV1 (2000–15), (b) AV2 (2000–16), (c) KR (2000–15), (d) KL (2000–14), (e) IC (2000–14) (see Fig. 1 for the locations of the regions). The color scale shows surface elevation change rate (m a−1). The black lines indicate the glacier boundaries and the color map out of the glaciers shows areas where the vertical offsets of the DEMs were corrected. KL-1–4 in (d) indicate regions analyzed with separated DEMs (see Table 1).

The rate of glacier mass loss in the Kamchatka Peninsula was quantified as −304.2 ± 9.1 Mt a−1 for the period 2000–16 (Table 2). More than 50% of the mass loss occurred in NS due to it covering the greatest glacier area of all the regions. The magnitude of the mass loss in each region generally correlated with the glacier area (Table 2, Fig. 2).
The glacier mass change between 2000 and 2016 was partitioned into sub-periods for the regions KR and NS (Table 2, Fig. 5a). Mass loss in KR rapidly accelerated from the period 2000–06 (0.19 ± 0.02 m w.e. a−1) to the period 2006–10 (‒1.65 ± 0.12 m w.e. a−1). The rate slightly decreased in the later period from 2010 to 2015 (‒1.11 ± 0.08 m w.e. a−1), resulting in a significantly rapid ice wastage from 2006 to 2015 (Table 2, Fig. 5a). Similarly, a large acceleration in the mass loss was observed in NS, where mass loss increased from ‒0.33 ± 0.02 m w.e. a−1 in 2000–10 to ‒1.16 ± 0.07 m w.e. a−1 in 2010–16 (Table 2, Fig. 5a). Therefore, glacier mass loss accelerated significantly on the Kamchatka Peninsula from ~2005 to 2010 (Fig. 5a).

Fig. 5. Time series of (a) specific mass change, (b) mean summer temperature (June–September) and (c) cumulative winter precipitation (November–April) in KR and NS. Temperature and precipitation series are based on NCEP/CFSR data. (d) Annual mean PDO index from 1985 to 2016 based on ERSST Version 5. Dotted and solid lines in (b) show the linear regression of summer temperature in each region from 2000 to 2013 and 1985 to 2013, respectively.
5. Discussion
5.1 Glacier areal change
The rate of the areal change in the 21st century (−1.4% a−1, −9.6 ± 2.1 km2 a−1) (Table 2, Figs 2a, c) is significantly more rapid than those reported for earlier periods. Muraviev (Reference Muraviev2017) reported a rate of −0.32% a−1 from 1950/1957 to 2002/2015, whereas −0.29 to −0.24% a−1 was reported for 1950–2000 by Lynch and others (Reference Lynch, Barr, Mullan and Ruffell2016). Acceleration in areal loss in the 21st century is consistent with a result reported by Lynch and others (Reference Lynch, Barr, Mullan and Ruffell2016) (−1.76% a−1 in 2000–14).
The greatest area-loss rate in terms of a fraction to the glacier area was observed in AL. We attribute this result to relatively small glaciers being distributed throughout this region, based on the mean perimeter-to-area ratio in AL (10.0 km−1 in 2002) which was greater than the mean over the entire region (9.1 km−1 in 2000/2002). Glacier area reduces along the margins, meaning that the fraction of area loss relative to the total area is generally greater at smaller glaciers (e.g. Granshaw and Fountain, Reference Granshaw and Fountain2006; Tennant and others, Reference Tennant, Menounos, Wheate and Clague2012).
5.2 Contribution of the glaciers in Kamchatka to sea level rise
The total glacier mass loss over the entire Kamchatka Peninsula from 2000 to 2016 (−4.9 ± 0.1 Gt) is equivalent to a sea level rise of 0.013 mm (8.4 × 10⁻⁴ mm a−1). This ice loss corresponds to 10% of the glacier volume on the Kamchatka Peninsula (Khromova and others, Reference Khromova, Nosenko, Kutuzov, Muraviev and Chernova2014), and 4.1% of the total ice volume in North Asia (Farinotti and others, Reference Farinotti2019). Furthermore, the mass loss on the Kamchatka Peninsula (−304.2 ± 9.1 Mt, Table 2) accounted for 23% of the total ice loss in North Asia in the period 2000–14 (Hugonnet and others, Reference Hugonnet2021). Therefore, the recent glacier change on the Kamchatka Peninsula is critically important for the glacier mass loss in the North Asia region. The specific glacier mass loss in Kamchatka (−0.46 ± 0.01 m w.e. a−1) is similar to that reported in North Asia (Ural, Altai and Far Eastern Russia) from 2006 to 2019/2016 (−0.37 ± 0.31 m w.e. a−1) and less than the glacier mass loss in other mid-latitude and subarctic regions (e.g. Alaska: −0.85 ± 0.19 m w.e. a−1, Iceland: −0.71 ± 0.43 m w.e. a−1, Central Europe: −0.87 ± 0.07 m w.e. a−1) (Zemp and others, Reference Zemp2019). In KR and NS, however, the specific mass change rate from 2006/2010 to 2010/2016 accelerated to −1.65 ± 0.12 and −1.16 ± 0.07 m w.e. a−1, respectively (Table 2, Fig. 5a), which is consistent with the mass loss acceleration reported in North Asia (Hugonnet and others, Reference Hugonnet2021). It should be noted that the acceleration in Kamchatka is greater than the mean over North Asia (−0.434 ± 0.095 in 2000–05 to −0.554 ± 0.095 m w.e. a−1 in 2010–15) (Hugonnet and others, Reference Hugonnet2021). The values measured after the mass loss acceleration are similar to the rates in the Southern Andes (‒1.18 ± 0.38 m w.e. a−1) and low-latitude regions (‒1.03 ± 0.83 m w.e. a−1), where the most rapid mass loss was reported in 2006–16 (Zemp and others, Reference Zemp2019). Therefore, the specific glacier mass loss in some regions on the Kamchatka Peninsula (KR and NS) has increased to a level equivalent to the most negative values in the world.
5.3 Climatic influence on glacier mass loss
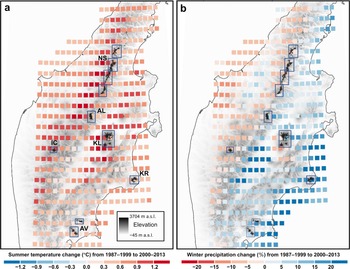
The rates of glacier mass change were non-uniformly distributed over the Kamchatka Peninsula (Table 2, Figs 2b, c). For example, relatively large specific mass loss was observed on the eastern coast (KR) and in the northern area (NS) (Fig. 2b). To investigate the driver of the spatial variability, changes in summer temperatures and winter precipitation from the period 1987–99 to 2000–13 were analyzed using NCAR/CFSR data (Fig. 6).

Fig. 6. (a) Changes in summer temperature (June–September) and (b) winter precipitation (November–April) from 1987–99 to 2000–13 based on NCEP/CFSR data. Also indicated on the map are glacier covered areas (black) and regions studied (box) and surface elevation based on ALOS World 3D (grayscale).
Summer temperatures have increased over the entire Kamchatka Peninsula (+0.68°C on average), which is consistent with the observed glacier mass loss. The magnitude of the warming was slightly enhanced on the western slope of Sredinny Range (IC, AL and NS) and the region surrounding KL (Fig. 6a). A relatively large temperature rises in NS (+0.78°C) is a likely driver of the significant mass loss observed in the region, which was the second largest in Kamchatka (Table 2, Fig. 2c). The rate of the mass loss was less significant in KL and IC (−0.23 ± 0.02 and −0.25 ± 0.03 m w.e. a−1), despite a significant temperature rise being observed in these regions (+1.11 and +0.95°C, Figs 2c and 6a). Factors affecting the relatively small glacier changes in these areas are discussed in the next subsection.
Winter precipitation has increased by 5% (29 mm) on average. Clear spatial variations were observed across the peninsula, i.e. a positive trend was more evident on the eastern half of the peninsula (Fig. 6b). The most significant increase was found along the southeastern coast, including AV and KR (+12 and +18%), whereas a positive trend was less evident around the inland volcanic mountains in the KL region (Fig. 6b). On the western half of the peninsula, winter precipitation decreased, as represented by −8% in IC. On the Sredinny Range, winter precipitation increased in AL (+8%) and decreased in NS (−3%). These changes in the precipitation are greater than the RMSE reported for the same precipitation dataset in the Arctic region (15 mm) (Barrett and others, Reference Barrett, Stroeve and Serreze2020). Therefore, the increase in total precipitation on the peninsula is one of the possible reasons why the mass loss in Kamchatka Peninsula is less significant than that observed in other mid-latitude and subarctic regions. In AV and KR, it is likely that the magnitude of the mass loss after 2000 was reduced by the increase in precipitation (Figs 5c and 6b). On the contrary, decreased precipitation in NS probably affected the significant mass loss in the region (Table 2, Figs 2c, 5c and 6b).
The multi-temporal elevation changes suggest the impact of the warming trend on the recent glacier change. The specific mass change rates in KR and NS dropped by more than −1 m w.e. a−1 in the second period (2006–10 and 2010–16 each other) (Fig. 5a). The acceleration in mass loss corresponded to warming in KR, where the mean summer temperature increased by 0.8°C from 2000–06 to 2006–10 (Fig. 5b). Linear temperature trends from 2000 to 2013 were +0.10 and +0.03°C a−1 in KR and NS, respectively. Thus, we attribute the acceleration in mass loss to the rise in summer temperatures. Based on the available data, the influence of precipitation change on the glaciers is unclear based on available data. Winter precipitation increased in KR (10.3% from 2000–06 to 2007–13), whereas it decreased in NS (−26.0% from 2000–10 to 2011–13) (Fig. 5c). Therefore, we presume that the accelerated glacier mass loss on Kamchatka in the 21st century has been influenced by the warming trend rather than reduced snowfall. The variation in regional precipitation trends in precipitation might have affected spatial heterogeneity in the glacier change.
No in situ glacier mass-balance measurement took place on the Kamchatka Peninsula after 2000, whereas long-term glaciological observations were performed in the 20th century at Koryto Glacier in KR and Kozelsky Glacier in AV (Yamaguchi and others, Reference Yamaguchi, Naruse, Sugiyama, Matsumoto and Muravyev2003; WGMS, 2020). For Koryto Glacier, the third largest glacier in KR (Fig. 3c), the specific mass change rate from 1956 to 2000 was estimated at −0.60 m w.e. a−1, based on in situ observations and climate data from a nearby weather station (Muraviev and others, Reference Muraviev1999; Shiraiwa and Yamaguchi, Reference Shiraiwa and Yamaguchi2002). We obtained a similar rate of ‒0.41 ± 0.11 m w.e. a−1 for 2000–15, indicating a prolonged mass loss since the 20th century. At a location 260 km southwest of Koryto Glacier, Kozelsky Glacier (Fig. 3a) showed minor changes over the second half of the 20th century (0.0 m w.e. a−1 in 1956–97) (Vinogradov and Muraviev, Reference Vinogradov and Muraviev1992; Shiraiwa and Yamaguchi, Reference Shiraiwa and Yamaguchi2002). Yet we found the mass loss in the following period (2000–15) to be at a rate of ‒0.37 ± 0.40 m w.e. a−1. Observation in the 20th century is limited, but comparisons with reported data suggest that the long-term trend of glacier change is heterogeneously distributed over the Kamchatka Peninsula.
A previous study suggested that winter precipitation in Kamchatka is negatively correlated with the PDO index (Shiraiwa and Yamaguchi, Reference Shiraiwa and Yamaguchi2002). During a positive phase of PDO (relatively high sea surface temperature in the Pacific coast of North America), tracks of low-pressure systems in the North Pacific shifted eastward. This shift resulted in a decrease in winter precipitation along the west coast of the Pacific Ocean, where the Kamchatka Peninsula is located (e.g. Mantua and others, Reference Mantua, Hare, Zhang, Wallace and Francis1997). The time series of annual mean PDO index indicates a decrease by 0.67 from 1985–2000 to 2001–15 (Fig. 5d). The decrease in the PDO index suggests an increase in winter precipitation in Kamchatka, which is consistent with the trend evident in the reanalysis data on the eastern half of the peninsula (Fig. 6b). Therefore, as discussed in Section 5.1, the increase in winter precipitation most likely counterbalanced part of the melt enhanced by atmospheric warming, resulting in less significant mass loss as compared to other mid-latitude and subarctic regions. Nevertheless, the PDO index shows an increasing trend for the recent period (Fig. 5d), suggesting a possible decrease in precipitation in Kamchatka and an acceleration in mass loss in the immediate future.
5.4 Controls on glacier mass loss
The data suggest the influence of climate on the glacier changes on Kamchatka, but our observations cannot be explained only by changes in temperature and precipitation. To investigate other factors controlling the regional variations in the observed glacier changes, we analyzed altitudinal distribution of glacier areas, debris cover and volcanic activity.
Climate change causes a shift in ELA, which results in a change in the accumulation area ratio (AAR) and mass loss of the glacier. Nevertheless, the impact of the shift in ELA on AAR is not uniform among the regions studied. According to our experiment based on altitudinal distributions of the glacier areas with the AAR assumed to be in the range of 0.4–0.7, the impact of a 100 m ELA rise on AAR is the greatest in the KR and NS regions (Fig. 7). For example, if we assume the AAR in 2000 as being 0.6, a 100 m increase in ELA in KR and NS would have caused a more than 50% reduction in the accumulation area (62 and 54%, respectively) (Fig. 7). Relatively large areas distributed near the ELA imply a greater sensitivity of mass balance to climate change, which explains the relatively rapid mass loss observed in these regions in the period 2000–16 (Table 2, Figs 8c, g–j). The same amount of change in the ELA in KL and IC would have caused only a 17 and 16% reduction in the accumulation areas, respectively (Fig. 7). The smaller impact is due to the glacier areas distributed over a broad elevation range (Figs 8d, e). This is consistent with our observations in these regions, because the magnitude of the mass loss was smaller than the total mean, despite a significant increase in summer temperatures and a decrease in winter precipitation (Table 2, Figs 2b, c and 6).

Fig. 7. Change in the accumulation area (%) expected after an increase in ELA by 100 m. The change is given for each study region for initial AAR assumed in a range of 0.4–0.7.

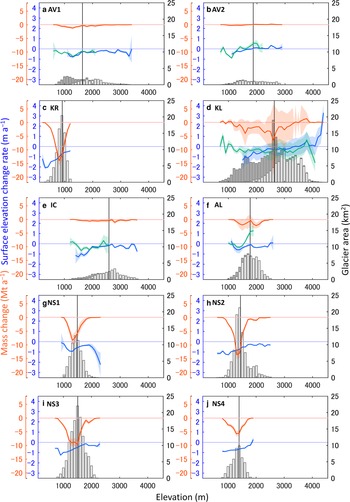
Fig. 8. Mass change (red), surface elevation changes on debris-free (blue) and debris-covered areas (green) and glacier area (light gray for debris-free and dark gray for debris-covered areas) in 100 m elevation bins in each region (Fig. 1). Shaded areas represent ranges of uncertainty. The vertical black line shows the median elevation of the glaciers in the region. Horizontal lines indicate zeros.
The magnitude of the elevation change was generally greater in the lower elevation areas. In the Ostry region in the Northern Sredinny Range (NS3), for example, the mean rate of elevation change below 1500 m a.s.l. was ‒0.76 ± 0.15 m a−1, whereas the rate in the areas with higher elevation was only ‒0.35 ± 0.25 m a−1 (Fig. 8i). A similar elevation dependence was observed in most of the regions studied, except for areas covered by debris (Fig. 8). The greater mass loss in lower areas correlates with trends reported in other regions, e.g. Alaska, Himalaya and Central Europe (Larsen and others, Reference Larsen, Motyka, Arendt, Echelmeyer and Geissler2007; Bris and Paul, Reference Bris and Paul2015; Fischer and others, Reference Fischer, Huss and Hoelzle2015; Vijay and Braun, Reference Vijay and Braun2016; Bandyopadhyay and others, Reference Bandyopadhyay, Singh and Kulkarni2019). Lower elevation areas are more affected by rises in temperature because of the increase in the positive degree-days and the change from solid to liquid precipitation. Furthermore, reduction in surface albedo is expected in the ablation area because of bare ice exposure and darkening ice surface (i.e. Saito and others, Reference Saito, Sugiyama, Tsutaki and Sawagaki2016), which also enhances mass loss in low elevation areas. As a result of the elevation dependence, mass change averaged over each individual glacier in AV, KR and NS correlates directly with the median elevation of the glaciers (correlation coefficient: r = 0.24–0.72 with 95% confidence interval). Glaciers in KL and IC were insensitive to the rapid temperature rise (Fig. 6a), probably because glaciers in these regions are located in relatively high-elevation areas (Figs 8d, e). Median elevations of glacier areas in KL (2664 m a.s.l.) and IC (2620 m a.s.l.) are substantially higher than the median of the other four regions (927–1812 m a.s.l.) (Fig. 8).
In contrast to the general trend, no significant correlation was obtained between the specific mass changes and median glacier elevations in AL (correlation coefficient: −0.08). This can be attributed to the contrast in the mass loss on the eastern and western slopes of the mountain ridge (Fig. 4a). In this region, glaciers on the eastern slope extend further into lower elevation areas (median elevation: 1690 m a.s.l.) than on the western slope (1947 m a.s.l.), being under the influence of high accumulation due to avalanches from steep mountain walls. Glaciers on the eastern slope were relatively stable from 2000 to 2016 (0.24 ± 0.01 m a−1), whereas those on the western slope showed substantial mass loss during the same period (‒0.73 ± 0.01 m a−1). This difference is greater than the eastwest bias due to the distortion of the DEMs observed off glacier terrain (Fig. 4a). Total mass loss in AL during the study period (0.00 ± 0.15 m w.e. a−1) was less significant than that in NS, situated in the north of the same mountain range (−0.61 ± 0.02 m w.e. a−1). An increase in precipitation after 2000 on the eastern side of AL (+8%, Fig. 6b) might have increased the accumulation on the glaciers on the eastern slope.
In AV, KL, IC and AL, less negative or positive surface elevation changes were observed near the glacier fronts (Figs 3a, b, d, e, 4a and 8a, b, d–f). Lower reaches of the glaciers in these regions are covered by debris layers composed of volcanic (in AV and KL) or morainal depositions (in IC and AL) (e.g. Mattson and others, Reference Mattson, Gardner and Young1993; Vijay and Braun, Reference Vijay and Braun2016; Muraviev, Reference Muraviev2017; Bandyopadhyay and others, Reference Bandyopadhyay, Singh and Kulkarni2019), which are thick enough (i.e. >50 mm on Kozelsky Glacier in AV) to insulate ice. Thus, we attribute the relatively insignificant mass loss in AV, KL, IC and AL to a reduction in surface melt due to the insulation provided by the layers of debris (Figs 8a, b, d–f). The influence of debris on surface mass balance in these regions has been reported previously (Shiraiwa and Yamaguchi, Reference Shiraiwa and Yamaguchi2002; Muraviev, Reference Muraviev2017; Khromova and others, Reference Khromova2019).
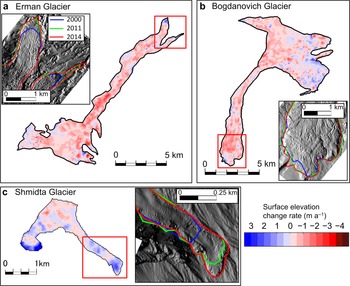
The KL region is characterized by a number of active volcanoes. Their influence on the glaciers, including the role of volcanic activities in glacier advance in the region, has been discussed in previous studies (e.g. Yamaguchi and others, Reference Yamaguchi, Sawagaki, Matsumoto, Muravyev and Naruse2007; Muraviev and Muraviev, Reference Muraviev and Muraviev2016; Barr and others, Reference Barr, Lynch, Mullan, De Siena and Spagnolo2018a). However, details of the volcanic influence on the glacier mass budget in KL are poorly understood. In spite of the significant atmospheric warming during the study period (Fig. 6a), glaciers on the Klyuchevskaya Volcano have advanced and thickened near the termini (Figs 3d, 8d and 9). The advance of the Erman Glacier (Fig. 9a) was attributed to the eruption of the Klyuchevskaya Volcano in the 1930s and 1940s. This resulted in the deposition of debris on the upper part of the glacier and, later, in the ice insulated by the debris being transported downglacier (Muraviev and Muraviev, Reference Muraviev and Muraviev2016; Dokukin and others, Reference Dokukin, Seynova, Savernyuk and Chernomorets2017; Barr and others, Reference Barr2018b). Among the advancing glaciers, Bogdanovich and Erman glaciers showed significant mass loss from 2000 to 2014 (−0.41 ± 0.09 and −0.27 ± 0.05 m w.e. a−1) (Figs 9a, b). These glaciers flow >100 m a−1 faster than other glaciers, possibly because of sliding enhanced by seismic events, or due to basal melting resulting from high geothermal heat flux (Barr and others, Reference Barr, Lynch, Mullan, De Siena and Spagnolo2018b). A likely interpretation of the thinning of the advancing glaciers is the active transport of ice to the low elevation areas. Fast ice flow caused ice wastage in the upper regions and enhanced melting in the lower reaches. In contrast to Bogdanovich and Erman glaciers, Shmidta Glacier gained mass at a rate of +0.14 ± 0.16 m w.e. a−1 during the same period (Fig. 9c). Previous studies suggest that this glacier is in the process of restoration after the collapse of the terminus due to the eruption of Mount Klyuchevskaya in 1987 (Muraviev and Muraviev, Reference Muraviev and Muraviev2016; Dokukin and others, Reference Dokukin, Seynova, Savernyuk and Chernomorets2017). Our results confirm the important and complex impact of volcanic activity on glacier mass change on the Kamchatka Peninsula.

Fig. 9. Surface elevation change rate from 2000 to 2014 (color scale) and glacier terminus positions in 2000, 2011 and 2014 (blue, green and red) for (a) Erman, (b) Bogdanovich and (c) Shmidta glaciers (see Fig. 3d for the locations of the glaciers). The red boxes show terminus areas covered by the insets. The imagery in the insets is shade maps of ArcticDEMs acquired on (a) and (b) 17 April 2014 and (c) 10 October 2015.
6. Conclusion
In this study, changes in glacier area and mass on the Kamchatka Peninsula were quantified for the period 2000–16 based on multi-sensor remote-sensing datasets. The results showed glacier retreat and mass loss in the region. The total glacier area reduced from 800.6 ± 13.0 km2 in 2000/01/02 to 646.7 ± 10.6 km2 in 2014/15/16 at a rate of −1.4% a−1. The glaciers lost 4.9 ± 0.1 Gt of ice from 2000 to 2014/15/16 with a mean specific mass change rate of −0.46 ± 0.01 m w.e. a−1. The mass loss of the glaciers corresponds to a sea level rise of 0.013 mm (8.4 × 10⁻⁴ mm a−1). On the Kamchatka Peninsula, the magnitude of glacier mass loss was smaller than those reported in other mid-latitude and subarctic regions. Nevertheless, ice loss in Kamchatka significantly increased after 2005–10, to a rate exceeding −1.0 m w.e. a−1. The recently accelerated ice loss was attributed to atmospheric warming rather than a change in winter precipitation. A recent trend in the PDO index suggests drier conditions in the future, which may cause further ice loss acceleration. Glacier mass loss was most rapid in the Pacific coastal region (KR; −0.78 ± 0.06 m w.e. a−1) and along the central ridge in the northern region (NS; −0.61 ± 0.02 m w.e. a−1). In addition to the warming climatic conditions, geographical settings, debris cover and volcanic activity also affect the glacier mass balance. Careful monitoring is required to understand the future evolution of the glaciers in Kamchatka and the impact on the regional environment.
Supplementary material
The supplementary material for this article can be found at https://doi.org/10.1017/jog.2022.50.
Acknowledgements
We thank Takanobu Sawagaki for providing technical support for the photogrammetric analysis. Thanks are also to Will Kochtitzky and an anonymous reviewer for providing constructive comments. The paper was handled and commented by the Scientific Editor Iestyn Barr and the Associate Chief Editor Hester Jiskoot. This research was funded by JSPS KAKENHI, Grant Number JP17H01156, and the Arctic Challenge for Sustainability Project (ArCS II), Grant Number JPMXD1420318865.


 Open access