


Introduction
A significant body of literature exists on snow-avalanche dynamics, in particular on the modelling and prediction of flow velocities and depths, run-out distances, and impact pressures. Far less attention has been devoted to the estimation of avalanche masses, even though the inherent properties of snow may make mass, rather than fluid-flow characteristics, a more appropriate measure of avalanche size and destructive power (Reference Schaerer and FitzharrisSchaerer and Fitzharris, 1984), A measure of avalanche size based on mass is also useful in hydrological studies of avalanche-snow transport, since in this context the amount of water available in avalanche deposits at the beginning of the ablation season is a crucial data requirement (Reference IveronovaIveronova, 1966).
The purpose of the research reported here was to estimate annual avalanche masses in the Himalaya of Pakistan and to test the applicability of an existing equation for predicting these masses. The predictive equation is based on data from western Canada (Reference SchaererSchaerer, 1988). Of particular interest was the robustness of the empirical coefficient contained within this equation in a different avalanche-generating environment. Data were collected for the two winters of 1985–86 and 1986–87 as part of the Snow and Ice Hydrology Project, a joint undertaking between the International Development Research Centre (Canada), the Water and Power Development Authority (Pakistan), and Wilfrid Laurier University (Canada).
Avalanche-mass Estimation
The methods of estimating avalanche mass have been discussed by Reference Schaerer and FitzharrisSchaerer and Fitzharris (1984). They noted that, with the current state of avalanche statistical records and understanding of the complex mechanisms of avalanche-generation, empirical methods provide better estimates than statistical and conceptual ones. An empirical equation was first attempted by Reference ZalikhanovZalikhanov (1975) from data in the Caucasus Mountains. This equation was difficult to apply to other mountain ranges because of the heavy dependence of a coefficient X on specific and local climatic and terrain conditions. A more useful equation, which combines a theoretical or conceptual understanding of the factors contributing to avalanche mass with statistically inferred empirical relations, was developed for the Rogers Pass area (Selkirk Mountains), B.C., Canada, by Reference SchaererSchaerer (1984, 1988). This equation estimates the annual mass of avalanche snow M a (in tonnes) on a path by
where ƒ is the yield coefficient or proportion of snow on the avalanche path which avalanches (t m−3), A is the area of the catchment (starting and track zones of the path, in m2), and S a is the amount of precipitation (water equivalence ot snowfall and rain into snow) which falls in the catchment from the time it is covered with snow until the termination of avalanche activity in the spring (in m). As Equation (1) indicates, Reference SchaererSchaerer (1984, 1988) found the area of the catchment (A) and the total avalanche-season precipitation (S a) to be the most significant determinants of avalanche mass. The yield coefficient (ƒ) averages 0.11241 m−3 at Rogers Pass for all avalanche paths and years, but varies widely (s = 0.0809 t m−3) from year-to-year and path-to-path (Reference SchaererSchaerer, 1988).
Research Area
This research was conducted in Kaghan Valley, situated on the southern slopes of the Himalaya in northern Pakistan (Fig. 1). The combination of an extremely rugged topography, heavy winter snowfall, and deforested slopes results in intense avalanche activity up-valley of Kaghan village (Fig. 1). Valley-slope relief is on the order of 2500 m and consequently large avalanche paths have vertical falls approaching 2000 m. The total winter (November-April) precipitation in Naran (2400 m) averages 1080 mm and is mostly in the form of snow (Water and Power Development Authority, 1969). Most avalanches are produced by loading from intense snowfalls and by rain which often accompanies the winter storms (Reference Scally de and Gardnerde Scally and Gardner, 1986). Triggering by thawing may also be important, because daily temperature maxima, even in winter, exceed 0°C (unpublished data from Seed Potato Research Programme).
DATA COLLECTION
Nine avalanche paths in the Naran area were selected for detailed study. Seven of the paths have a north-west aspect which represents the most active orientation with respect to avalanche activity in the Naran area. Path relief ranges from 317 to 1715 m and track gradients range from 22° to 34° (Figs 2 and 3). Catchment areas (starting and track zones) range in size from 50 940 m2 to 5 323 500 m2. All of the paths are confined in steep valley-slope basins, which are deeply dissected on the large paths (Figs 2 and 3).
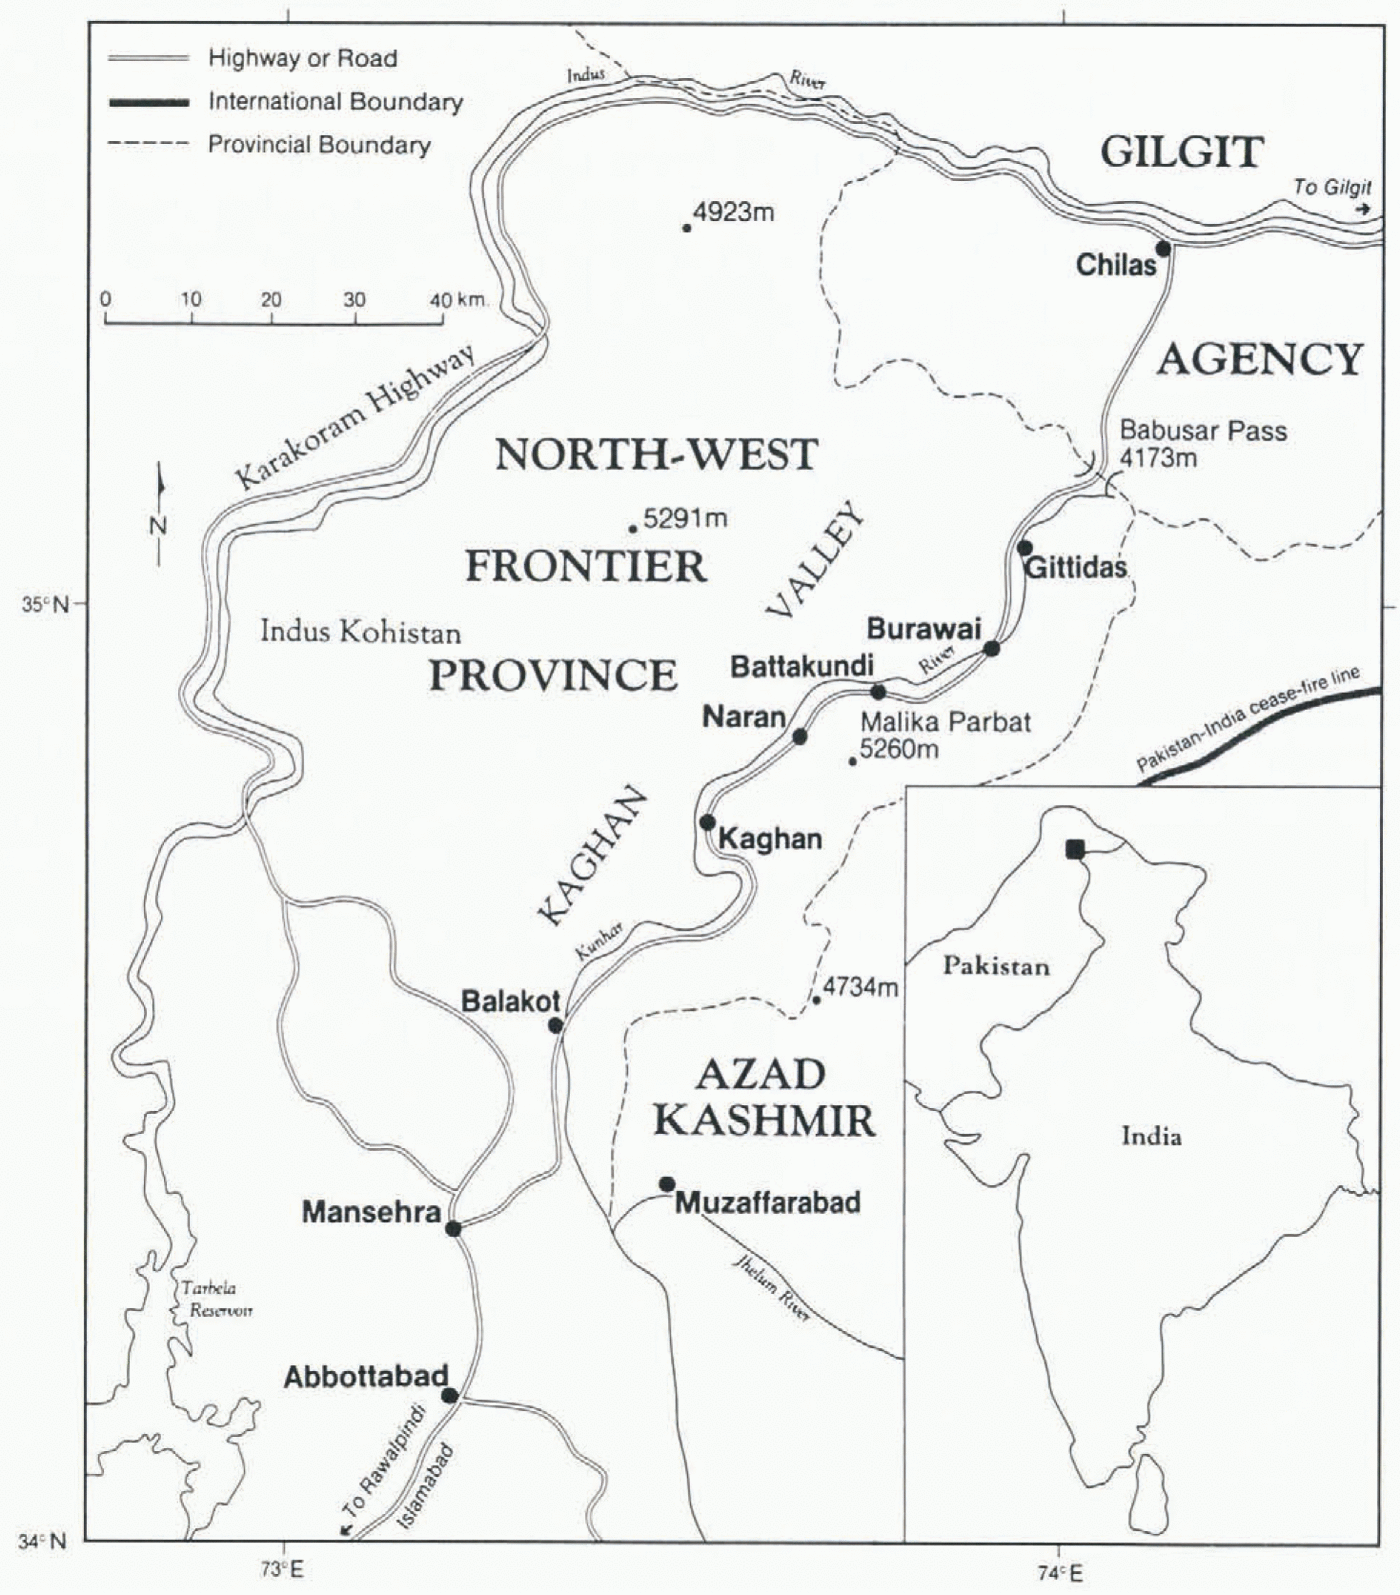
Fig.1. General location of Kaghan Valley, Pakistan.
The parameters required for Equation (1) are: wind exposure of the starting zone and incline of the track zone to produce the yield coefficient ƒ; and the size of the starting zone and track zone for the total catchment area A. While all these parameters may be measured from large-scale topographic maps and aerial photographs (Reference SchaererSchaerer, 1977, 1988; Reference Schaerer and FitzharrisSchaerer and Fitzharris, 1984), in Kaghan Valley the lack of these data sources necessitated laborious and time-consuming field surveys. Each path was ascended for this purpose using an altimeter, Abney level, and hip-chain for the measurements. The starting-zone area was estimated by assuming a hemispherical shape and measuring the length and diameter of this hemisphere. The surface area of each starting zone was then drafted and its size measured. While such an assumption about the shape of the starting zones obviously incorporates some errors into the measurement of their surface areas, this technique may in fact be more accurate than planimetric measurements considering the deeply dissected nature of the basins. Field surveys also permitted those areas of the starting zones which do not contribute to avalanche mass, for example patches of dense forest, to be excluded from the size estimates. The surface area of the track zones was relatively easy to calculate from measurements of their width, length, and incline.
The mass of the avalanche deposit on each path was estimated after both winters for comparison with the mass derived using Equation (1). Although better results can be obtained by totalling the measurements of individual avalanches over the winter (Schaerer, 1984, 1988), the measurements in this study were confined to the spring due to the inaccessibility of Kaghan Valley in winter.
The volume of snow in the run-out and track zones was measured using a cross-section survey technique (Schaerer, 1984, 1988). Two surveys were required on each deposit each spring: first, to obtain the surface profile at each cross-section transect; and secondly, to obtain the ground profile, due to the uneven run-out zones and gullied tracks. The ground position was estimated by probing through the remaining snow in those places where avalanche deposits remained at the time of the second survey. This was a particular problem in the deeply gullied tracks on the large paths.
The deposit volumes were converted to masses with measurements of the snow densities using a McCall dense-snow sampler to depths of approximately 2 m. In this manner, the accuracy of the mass values was greater than if an average density had been assumed in that the deposit snow exhibited an increase in density over the ablation season from 500 to 720 kg m−3 (both figures are the mean of approximately 15 samples) (Fig. 4).
Results
The estimates of annual avalanche mass using Equation (1) are summarized in Table I. The total precipitation Sa for each winter was obtained from records collected in Battakundi (unpublished data from Seed Potato Research Programme) (Fig. 1) and corrected to the elevation of each path catchment. The yield coefficients (ƒ) used in the calculations (column 4 of Table I) were supplied by P. Schaerer from data obtained at Rogers Pass, Canada. Schaerer (1984, 1988) demonstrated that the yield coefficient is related to the wind exposure of the starting zone (which determines the degree of additional snow loading in the catchment area A), the incline of the track zone (which determines the proportion of avalanches which reach the run-out zone), and the presence or absence of artillery control (the former results in a higher proportion of the catchment precipitation S a being avalanched but is not pertinent in Kaghan Valley). For this study only starting-zone wind exposure was used as a basis for selecting ƒ. Since the track deposit is included in the measured deposit mass in Table I, it does not make sense to base ƒ on the track incline. The calculated masses show a wide range (Table I). Six out of the ten paths had masses exceeding 105 tonnes in both years.

Fig.2. “Gorian” avalanche path on 22 May 1986. illustrative of the larger paths in this study. Visible across the avalanche deposit is the jeep track to Naran (jeeps for scale on the left) and the Kunhar River dissecting the lower deposit.

Fig.3. “Saiful Maluk” avalanche path on 15 May 1987, illustrative of the moderate-size paths in this study. A large impact pit is hidden beneath the avalanche deposit, immediately below the dirty snow in the lower track zone.

Fig.4. Increase in avalanche snow density during the ablation season.
Table.1. Comparison of measured and calculated annual avalanche masses

The measured deposit masses at the end of each avalanche season are also shown in Table I and they similarly show a wide range. Four of the ten paths had deposit masses exceeding 105 tonnes in both years, while on “Chappran Nala” this figure was just exceeded in 1987. A break-down of these measured masses into the run-out and track components indicates that the latter can be extremely significant, accounting for 70–96% of the total deposit in some cases (Fig. 2).
A comparison of the calculated and measured avalanche masses indicates that agreement between them ranges from relatively good to very poor (column 3, Table I). The greatest congruence occurs on the largest paths (“Gorian”, “Kapan”, “Dhumduma”, and “Bagnar”). On the two moderate-sized paths “Chappran Nala” and “Saiful Maluk”, Equation (1) underestimated the masses in both winters by an average of 49.0%. On the “Jabbah Di Narr”, “Rahi”, and “Kamra I” paths, the calculated masses were much too high compared to the measured masses, with the overestimation averaging 468.6%. If the last three paths are disregarded, the calculated masses generally agreed better with the measured masses in 1986 (mean difference ±22.8%) than in 1987.
Each path’s real yield coefficient for each winter was calculated in order to compare these to the yield coefficients from Rogers Pass in column 4 of Table I. This annual yield coefficient ƒa can be derived from:

where the terms are the same as for Equation (1). The mean yield coefficient of 0.0991 m−3 derived for both winters on all paths (column 5 in Table I) is very close to that obtained at Rogers Pass for paths which are not subjected to avalanche control (0.1091 m−3; Schaerer, 1988), but the sample similarly shows a great deal of variation (s = 0.0721 m−3). This variation is much less between the two winters on a given path (except on “Chappran Nala”) than between paths.
Discussion
*Data from Rogers Pass, British Columbia, Canada; courtesy of P. Schaerer, National Research Council of Canada, Vancouver, British Columbia.
† Melting occurred prior to measurement.
The estimation of annual avalanche masses using Equation (1) was successful on the largest paths but significant differences from the measured masses occurred on the other paths. In general, these differences can be attributed to two factors: inaccuracies in the measurement of the catchment area A and winter precipitation S a parameters in the equation, and seemingly random variations in the empirically derived yield coefficient ƒ. Problems in the measurement of A and S a are due to the paucity of topographic and climatic information sources in the study area. The variability of ƒ, which cannot be explained by the major controlling factors described earlier in this paper, is however a more universal problem (Schaerer, 1984, 1988). The variation between paths can probably be attributed to differences in the catchment topography and the small-scale terrain configuration which together affect the structure, anchoring, loading, and failure characteristics of the snow-pack. Problems with defining the catchment precisely may also contribute to the variability (Schaerer, 1988). The year-to-year variations of ƒ on a given path, which were not nearly as significant in this study as were the variations between paths, probably can be explained by the specific pattern of weather in any given winter which determines the stratigraphie development of the snow-pack and particularly the location of weaknesses within it. This determines the depth of the bed surface of any avalanche and consequently the amount of snow which is entrained in it. The similarity in average yield coefficients from Kaghan Valley and Rogers Pass may be misleading because of the high sample variability in both cases and the small sample size (n = 17) in this study. The relative success of Equation (1) on the largest paths in this study indicates that, despite the very different character of the terrain and winter climate in these two mountain areas, the same empirical relations between catchment size, precipitation, and avalanche-snow yield may hold in certain cases.
The discrepancies between calculated and measured masses in Table I also deserve some specific comment. On the “Chappran Nala” and “Saiful Maluk” paths, the underestimation of mass using Equation (1) is only partly explained by the possible addition of mass to the avalanche deposits by subsequent snowfalls. More likely the somewhat steeper starting zones in these paths with sparse vegetation covers (Fig. 3) allowed a greater proportion of the snow-pack to avalanche, producing higher yield coefficients. On “Saiful Maluk”, the 1985–86 coefficient approaches Schaerer’s (1988) 30 year maximum for uncontrolled paths (0.2991 m−3). The great overestimation of mass by the equation on the “Jabbah Di Narr”, “Rahi”, and “Kamra I” paths is difficult to explain but must have been produced by some combination of overestimation of catchment area or winter precipitation, or under-measurement of the deposit mass. The last may have been the result of a dominance of dry-snow avalanches whose deposits would melt rapidly and thus not be included in the measurements. For example, on “Rahi” in 1986–87 no trace remained of a large powder-snow avalanche which had severely damaged a restaurant at the run-out zone limit. Other possible reasons for the discrepancies are removal of a part of the deposit by the Kunhar River (”Rahi”) and melting prior to the surveys (“Kamra I”). A dense vegetation cover in the starting zone of “Kamra I” also appears to have reduced the yield coefficient.
Conclusions
The results of this study have shown that the prediction of avalanche mass is difficult and uncertain, particularly in a poorly known mountain region such as the Himalaya. Schaerer’s (1984, 1988) equation developed in western Canada does provide some estimate of expected annual avalanche masses. However, the errors were significant on all but the largest paths when compared to actual measurements of avalanche-deposit masses at the end of the two winters. From a hydrological point of view, the equation may be useful because it is the large paths which are most important in terms of the area of snow cover affected and thus the amount of water stored in the avalanche deposits at the beginning of the ablation season. The average coefficient of avalanche snow yield (0.0991 m−3) is very similar to Schaerer’s (1984, 1988) figure but shows a large variation between paths.
More accurate prediction of annual avalanche masses in Kaghan Valley requires Improved measurements of the equation parameters, refinement of the empirical yield coefficient in the equation, and in addition improved measurements of avalanche mass for verification purposes. The most difficult task is the refinement of the yield coefficient due to its erratic variability. If one also considers the problems of winter access, and data availability and collection, there is little chance of improving the prediction of avalanche masses in Kaghan Valley.
Acknowledgements
The financial and logistical support of the International Development Research Centre (Canada) and the Water and Power Development Authority (Pakistan) to the Snow and Ice Hydrology Project (Wilfrid Laurier University, Waterloo, Canada) is gratefully acknowledged. IDRC also provided a personal research award to F. de Scally. The field assistance of G. Veale and L Bell (University of Waterloo), H. Afzal, M. Mohammad, M. Anwar, and M. Younis (WAPDA), and R. Lall (formerly WLU) is appreciated. The authors would also like to thank the Seed Potato Research Programme (Abbottabad, N.W.F.P., Pakistan) for supplying climate data from Kaghan Valley. The generous assistance of P.A. Schaerer of the National Research Council of Canada, Vancouver, British Columbia, who provided unpublished data and many helpful suggestions, is also gratefully acknowledged. Last, the authors would like to thank the villagers of Naran and Battakundi, Kaghan Valley, for their hospitality and co-operation.


