


Introduction
Polar ice sheets are considered a unique paleo-climatic archive spanning up to 800 ka before present (EPICA Community Members, 2004). They are most prominently used to analyse in situ greenhouse gas concentrations (Nakazawa and others, Reference Nakazawa1993), impurities (Gfeller and others, Reference Gfeller2014) which are used as a proxy for atmospheric transport and biogeochemical activity and stable water isotopes which are used as a proxy for temperature (Jouzel and others, Reference Jouzel1997). However, a reliable interpretation of all analysed records is based on a profound understanding of the mechanisms involved in the transfer of climatic signals from the atmosphere into the snowpack and their modification during the exposure of surface snow to the atmosphere. Among several (post-) depositional processes the re-distribution and erosion of snow by wind hampers the consecutive burial of the topmost snow layer, introducing stratigraphic noise into the time series of any proxy record used for paleo climate reconstruction (Fisher and others, Reference Fisher, Reeh and Clausen1985). However, firn- and ice core drill campaigns usually do not recover the uppermost metre(s), as the snow is soft and fragile hampering the handling and storage of the snow cores in the same manner as ice. Hand-corers enable the drilling of the first metres, but the irregular shapes and volume of the retrieved pieces are not suitable for comparative statistical studies of the spatial distribution of paleo proxies in snow. Dedicated sampling efforts to retrieve ambiguous snow samples have therefore been conducted in the recent past. First results have shown that sampling more than one profile, for example, a row of profiles such as a trench wall, substantially improves the signal-to-noise ratio of the proxy record (Laepple and others, Reference Laepple2016; Münch and others, Reference Münch, Kipfstuhl, Freitag, Meyer and Laepple2016). The corresponding sampling campaigns used tubes made of carbon fibre which was pushed into the snow and subsequently excavated. We will hereafter refer to the application of these tubes (100 mm diameter, 1 mm thickness and 1 m length) as the liner technique, offering sampling an exact 1 m long high-quality cylinder of preserved snow. Nevertheless, digging each full-length tube out of the snowpack is exhausting and time-consuming, and thus extending such an attempt to larger spatial scales remains a logistical challenge. In addition, the amount of snow sampled with the liner technique is adapted for firn-densification studies by means of X-ray computer tomography (Freitag and others, Reference Freitag, Wilhelms and Kipfstuhl2004), but the amount of snow sampled can be significantly reduced for proxy measurement sampling of the snowpack. We upgraded the liner technique to propose the following dual-tube technique (Fig. 1) that meets the following requirements: (a) is fast and effortless, (b) mechanically simple, (c) collects a minimal but representative amount of snow with an accurate and reproducible depth/sampling interval and (d) obtains 1 m of snow with separation of its subsections at each location.
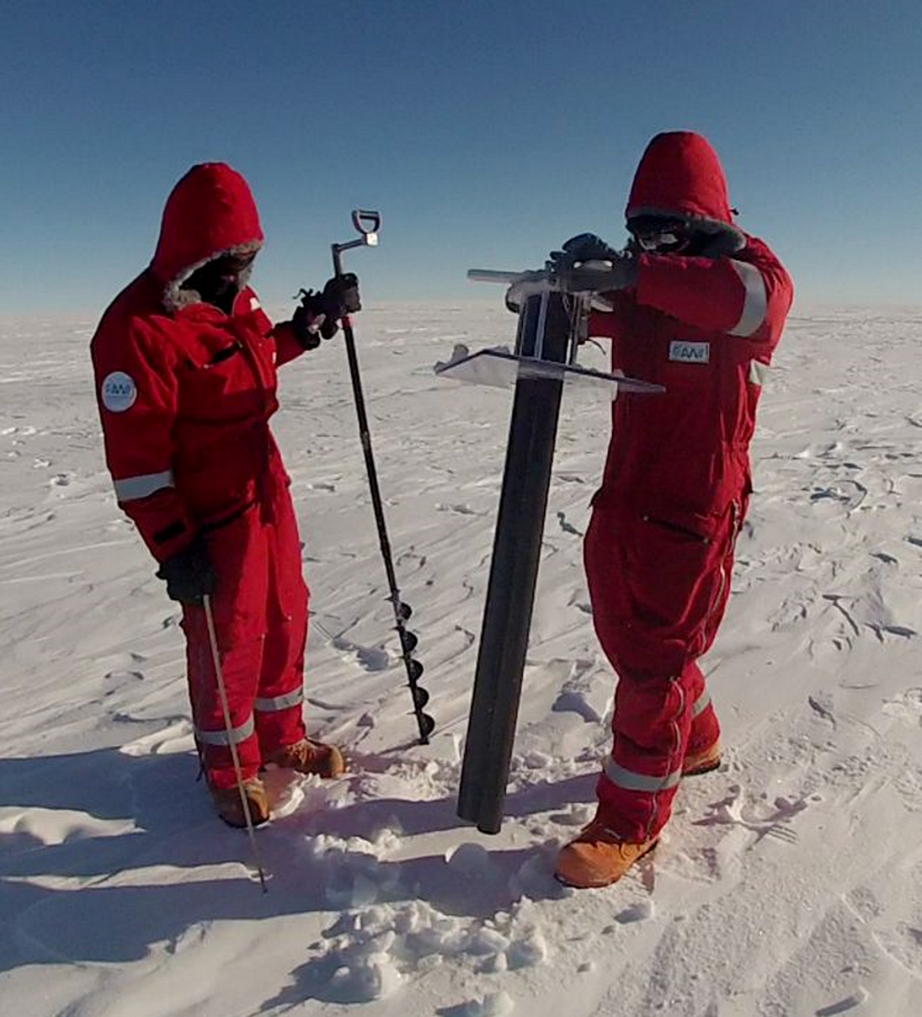
Fig. 1. Dual-tube sampler in action.
After describing the newly developed device and the associated sampling procedure, we present two applications related to the isotopic composition of the snowpack in Dronning Maud Land on the East Antarctic plateau. This first small-scale study allows us to validate our device by comparing our stable water isotope variability measurements with similar results from published studies in the same area. As a second example, a 5 km transect delivers the results of a first large-scale application of the sampling device.
Description of the technique
Philosophy and challenges
Polar ice sheets are isolated areas with extreme conditions. In addition to the reliability and reproducibility of sampling an exact amount of snow in a contamination-free way in such an extreme environment, the key points to a successful technique are convenience and simplicity of use, together with easy repairs. Based on this philosophy, we adapted and implemented the liner technique to a higher degree of efficiency:
• To avoid digging we attached alongside the sampling tube a second tube, where the snow is removed using a hand auger. Once emptied, the bottom of the sampling tube is accessible and a custom-designed core-cutting structure can be inserted to cut the bottom of the sample core, cover it and retrieve the core from the snowpack.
• With the aim of only collecting small sample amounts of dry snow zone, we conducted preliminary tests with different sampling tubes and determined as an optimal combination a 1 mm sharp edge with a minimum sampling diameter of 50 mm. Regarding the targeted analysis, only a fraction of the tube diameter is needed; however, using a smaller diameter would lead to compaction when pushing the tool into the dry snow. Therefore, the technique must also offer the ability of splitting the 1 m long core longitudinally before final collection of sample bags, in addition, to be able to precisely separate the subsections along the core axis.
Description of the implemented snow-sampling device
Sampler
We chose to use carbon fibre tubes (Carbon-Werke GmbH) as they have a low thickness/solidity ratio, are chemically inert and are lightweight. The sampler (see Fig. 2, panel A) features two tubes of 1.2 m length. One with a 50 mm diameter (hereafter referred to as the sampling tube) to contain the snow core sample and one with a 100 mm diameter (hereafter referred to as the auger tube) to insert the cutting structure. The diameter of the auger tube was chosen to fit the 90 mm diameter auger (conventional soil auger, Fig. 2, panel B). The two tubes are mounted in the body of the device at both the top of the device and at the snow surface level (e.g. the snow surface plate, Fig. 2, panel A). With this set-up, the top 0.2 m of the tubes stays above the snow surface to maintain and ensure the vertical alongside alignment of both tubes and the remaining 1 m sits within the snowpack.
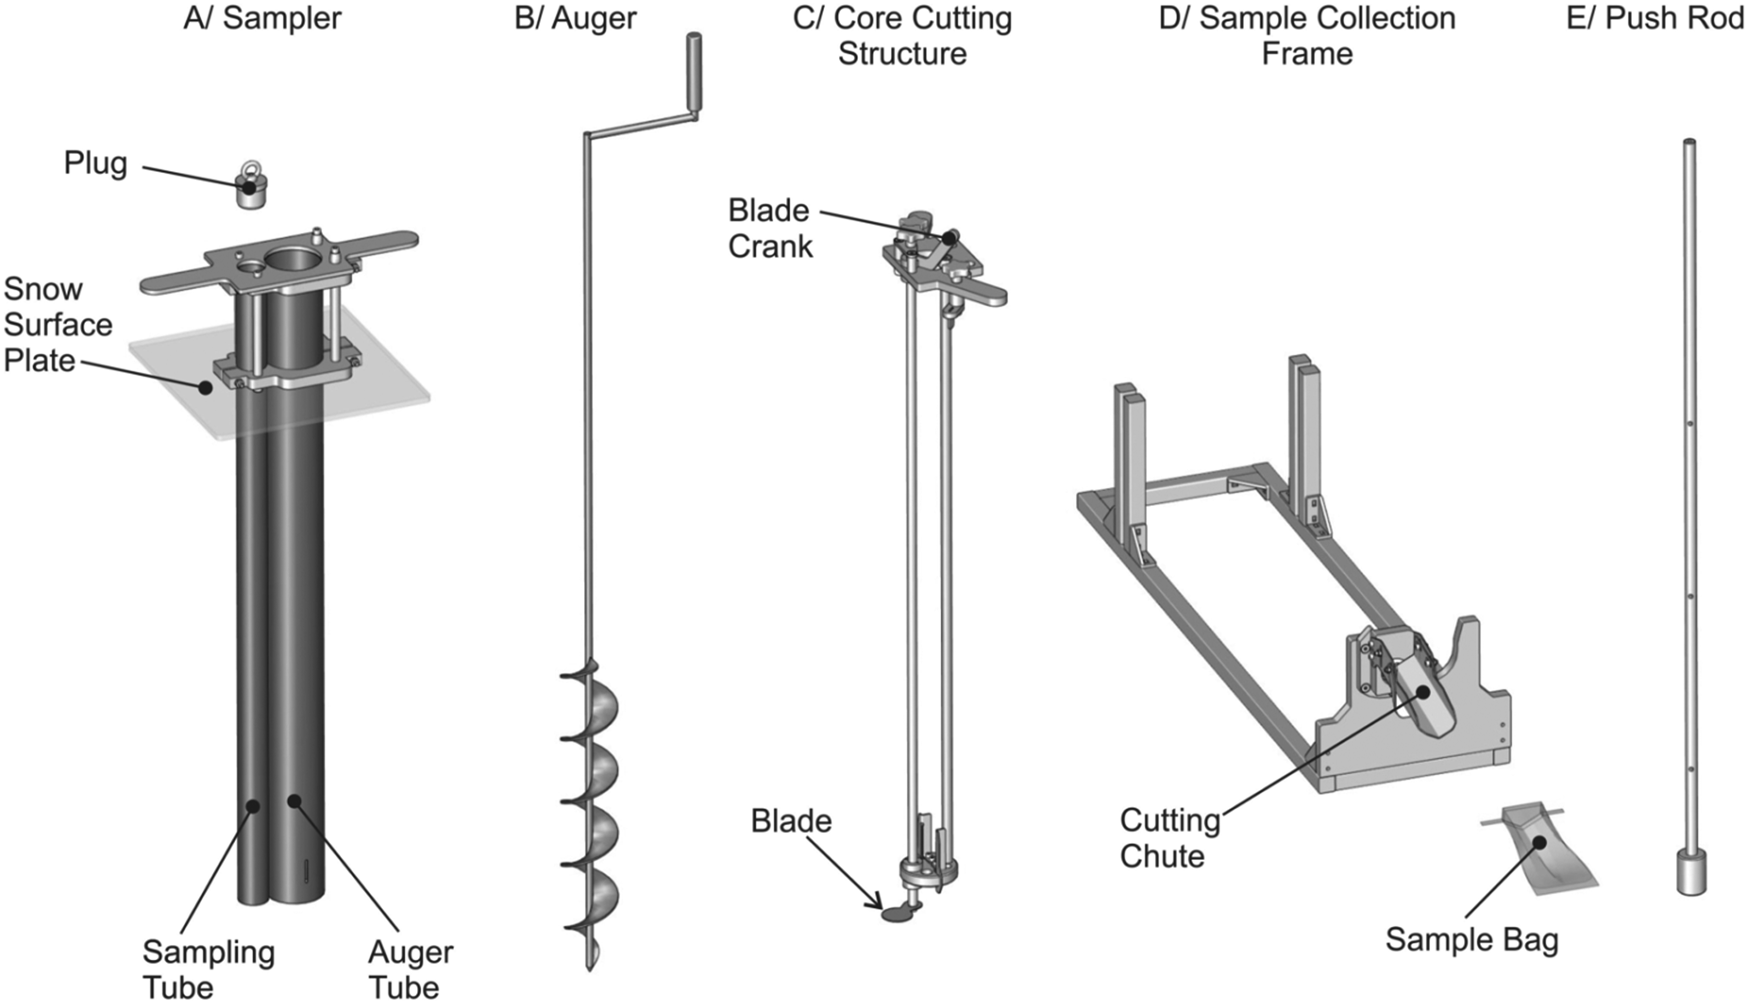
Fig. 2. All components of the sampling device in the order of use. Panel A: the core sampler body featuring handles, a snow surface plate and the two parallel tubes; panel B: the hand auger; panel C: the core cutting structure featuring the crank and blade; panel D: the sample collection frame featuring the V-shape cutting chute (with associated sampling bag); and panel E: the pushing rod, featuring 0.33 m depth intervals made for this study.
Core cutting structure
The cutting structure, which is as long as the tubes and designed to fit the diameter of the auger tube, features two parallel stainless steel mechanical shafts (see Fig. 2, panel C). At its top, the main shaft is connected to a 180° crank with a 50 mm diameter stainless steel circular blade at its bottom. To distribute the mechanical stress of torsion and maintain its position while cutting the snow via rotating the blade, the main shaft is connected at its top and bottom to a slightly smaller fixed rod. Finally, two fasteners to fix the structure to the sampler, in addition to a blade rotation locker.
Sample collection frame
A custom-built collection frame has also been developed (Fig. 2, panel D). Once the sampler is placed on the frame, the end of the sampling tube is connected to a cutting chute with a V-shaped stainless steel blade. The snow core is pushed out of the tube against the blade. At the end of the blade, sample bags can be mounted to catch the snow out of the tube. Only a fraction of the snow core is sampled into the bag, the rest falling to the ground during the splitting process. The height of the blade can be changed manually depending on the preferred amount of snow to be sampled.
Push rod
The stick used to push the snow core out of the tube is a 1.35 m long aluminium stick, with a 50 mm diameter and 100 mm long cylinder head. The push rod exhibits a series of holes along its length at defined intervals (0.33 m for our study) to accommodate end-stop pins if needed. Being wider than the tube, the push is paused at each pin for a precise sub-sampling of the 1 m long snow core.
Sampling procedure (Fig. 3)
(1) The sampler (Fig. 2, panel A) is pushed into the snow vertically and straight, and the top of the sampling tube is covered with the plastic cap to prevent collecting surrounding snow.
(2) The auger tube is emptied from snow (Fig. 2, panel B).
(3) The core cutting structure (Fig. 2, panel C) is lowered into the empty auger tube until it reaches the bottom of both tubes, where it is aligned to the bolts of the sampler and locked by turning the fasteners.
(4) The rotating blade turns below the sampling tube, cutting off the snow inside the tube from the snow below and closes the tube at the bottom. The rotating shaft is locked to disable any further motion. The whole device (tubes and cutting structure) can then be pulled out of the snow. Whereas the larger tube contains the cutter, the smaller tube is filled with the 1 m snow core that is held in place by the fixed circular blade at the bottom and covered by the cap at the top.
(5) (a,b) The sampler is placed on the sample collection frame (Fig. 2, panel D), the cutting chute blade set for the desired amount of sample, and the desired length of snow is then pushed with the rod out of the sampling liner and into the corresponding sample bag. After each sampling interval, the filled sample bag is removed and closed, and a new sample bag is placed on the cutting chute.
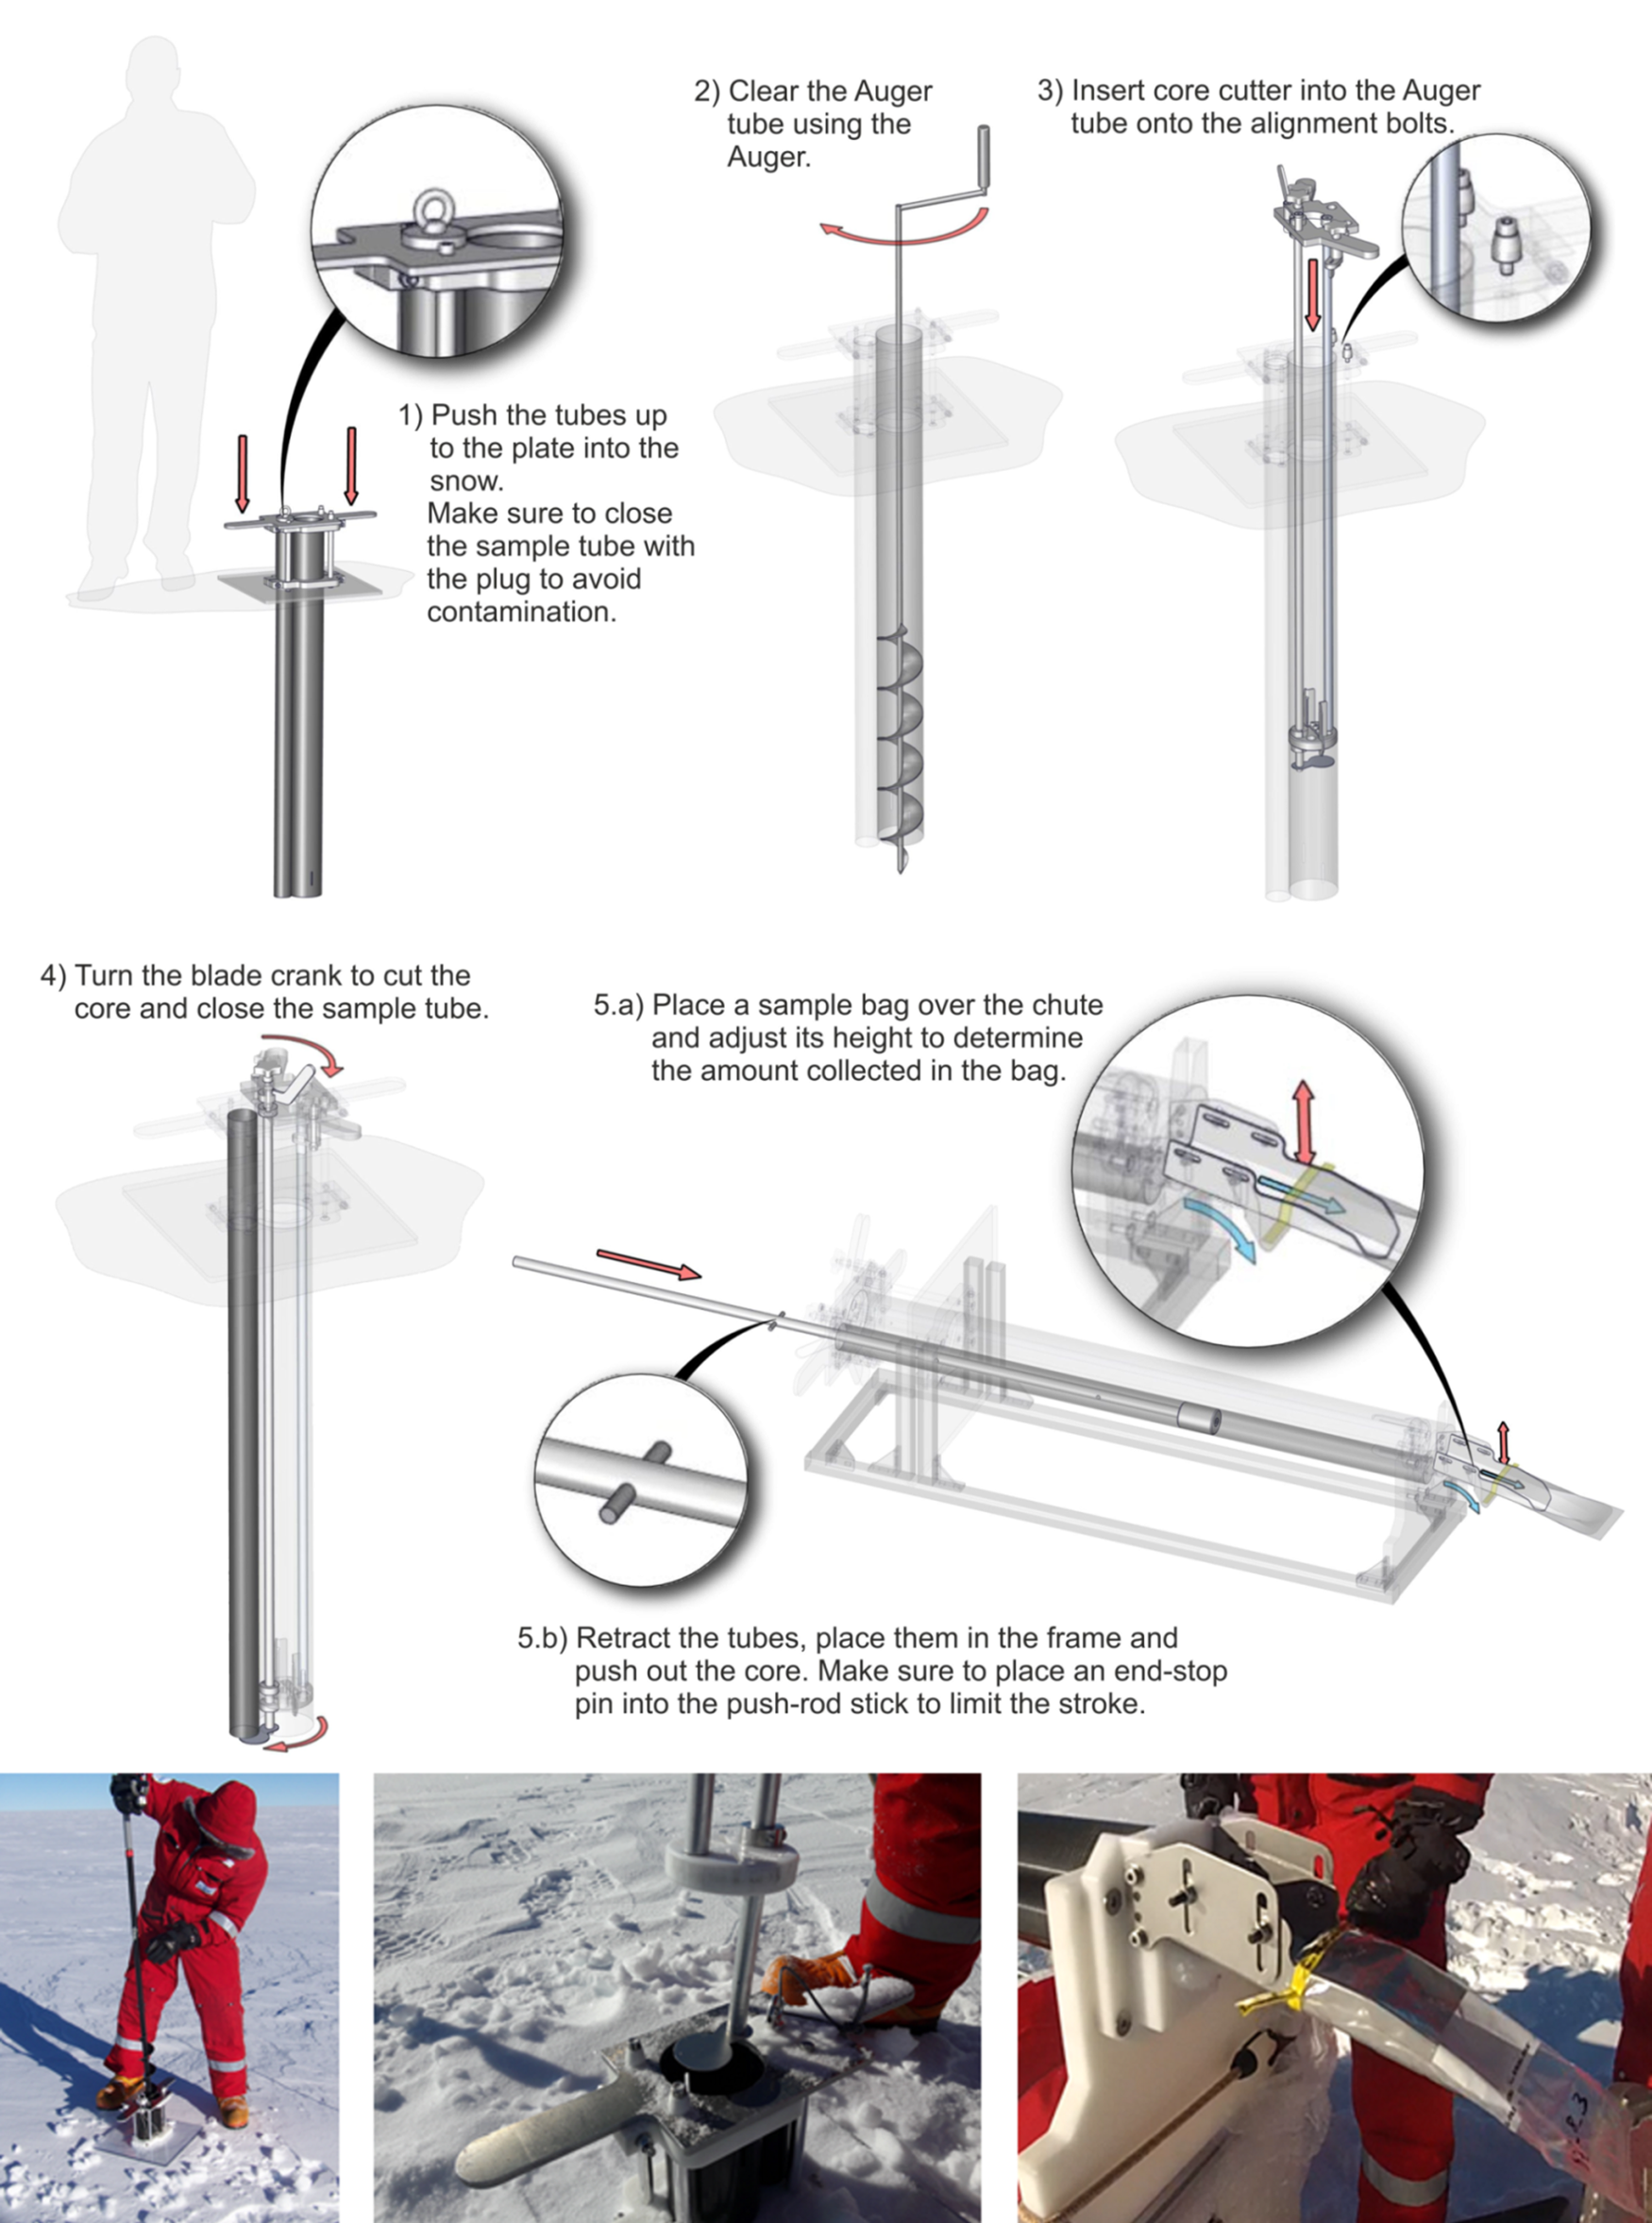
Fig. 3. Top: schematic of the sampling procedure. Bottom: photos corresponding to steps (2), (3), (5).
Pushing the device into the snow and pulling out the 1 m core takes a few minutes. Sampling the snow into bags (three different depth levels) takes an additional ~10 min. Altogether, collecting and then sampling the 1 m core into three subsamples takes <15 min. These timings depend on both the snow hardness and the weather conditions.
Applications of the sampling tool
Sampling sites and measurement methodology
Sampling campaigns were conducted during the austral summer 2018/19 field season near Kohnen station, Antarctica. Kohnen station is situated in the Atlantic sector of the East Antarctic Plateau (75.0°S, 0.1°E, 2892 m.a.s.l.) and has an annual mean temperature of −41 °C and an annual accumulation rate of 75 mm w.e.a−1 (Wesche and others, Reference Wesche2016). In previous years, firn cores were drilled and several snow trench studies were conducted near the station (see Fig. 4). Analysing the water isotope variations in several 50 m long and 1–3 m deep trenches, it was shown that stratigraphic noise in water isotopes (Münch and others, Reference Münch, Kipfstuhl, Freitag, Meyer and Laepple2016) and density (Laepple and others, Reference Laepple2016) in this region has a horizontal decorrelation scale of <10 m. However, given the limited spatial extent of the trenches, it was unclear if additional isotopic variations exist over larger spatial scales, for example, on the kilometre scale. As a first test and application of the dual-tube device, we thus performed two sampling campaigns; a series of cores along a 100 m transect with a 0.33 m depth resolution to create a dataset comparable to the existing trench studies and a 5 km long transect with a 1 m depth resolution to study the variability between the 100 m and the kilometre scales. Samples in both datasets were collected along a straight line from NW to SE (Fig. 4).
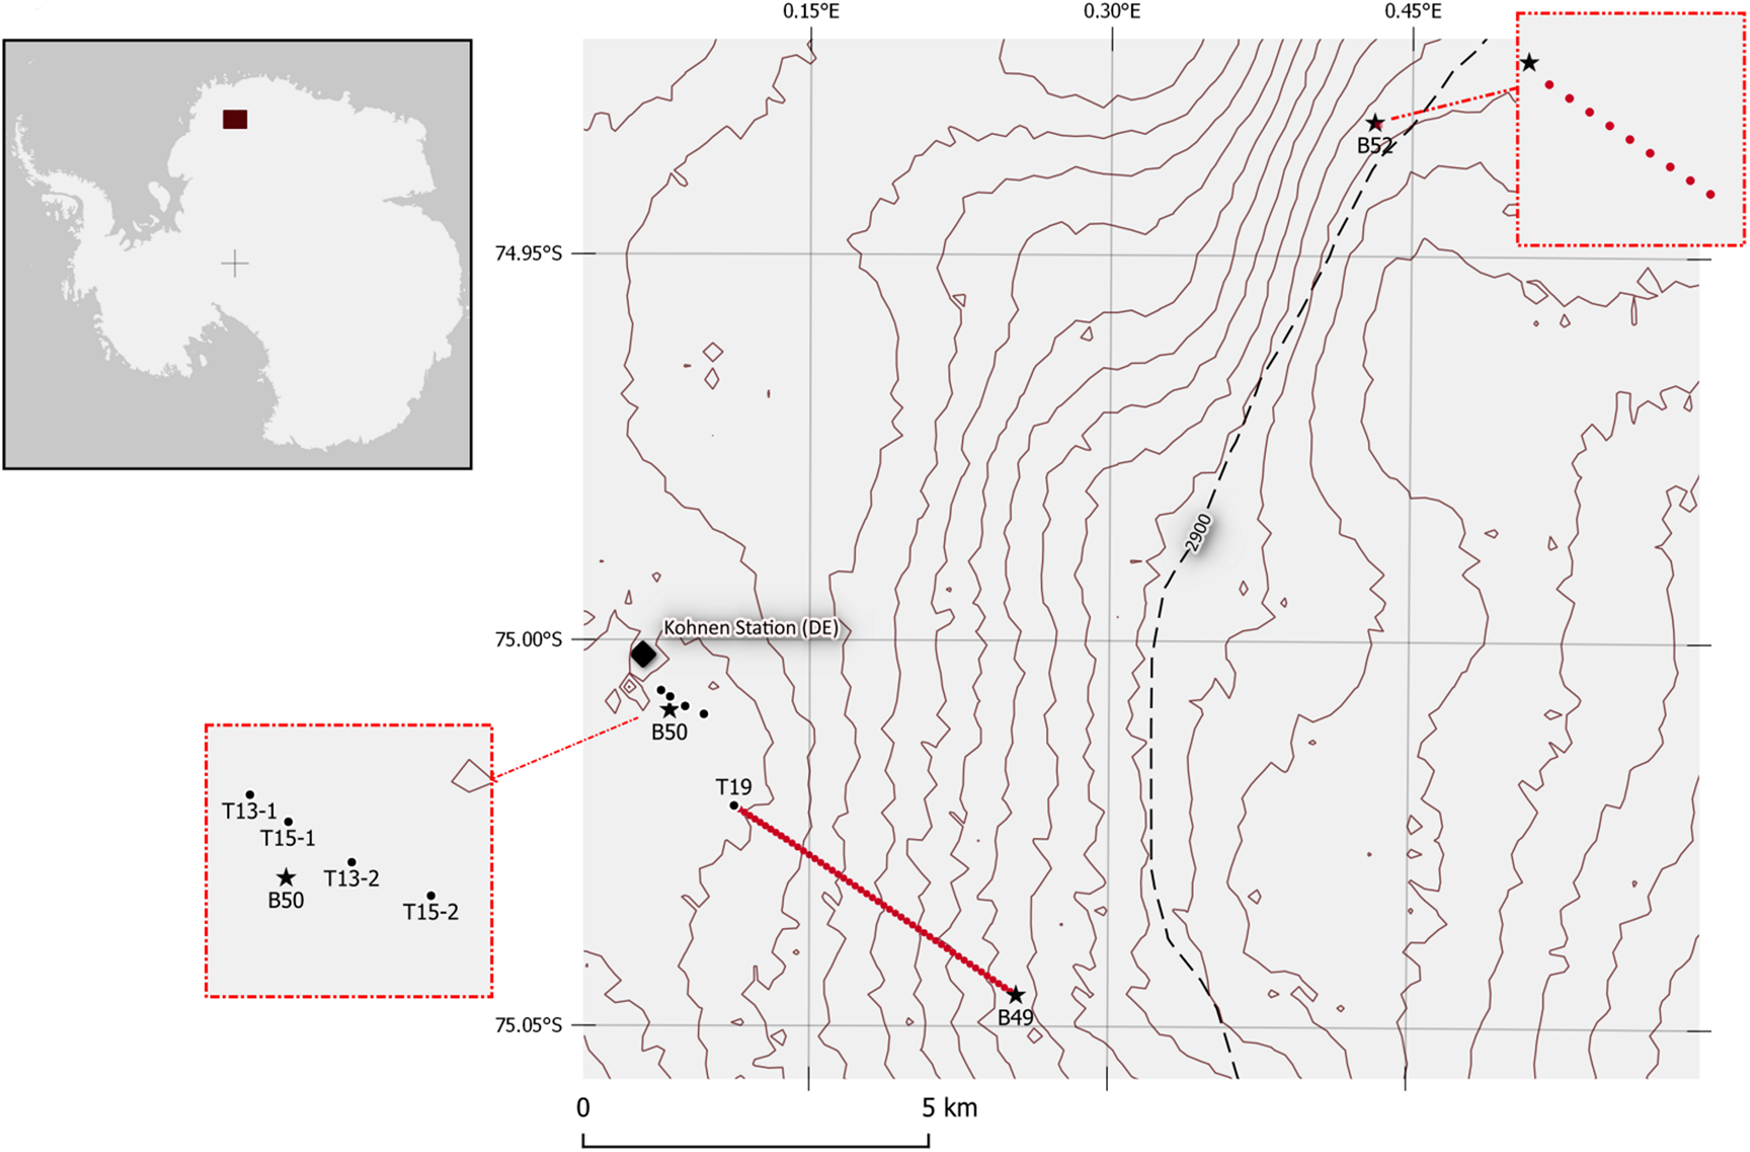
Fig. 4. Study area around Kohnen station, Dronning Maud Land. The 1 m elevation lines show the local topography of the area (The Reference Elevation Model of Antarctica, Howat et al., Reference Howat, Porter, Smith, Noh and Morin2019, hereafter REMA). The sampling sites are indicated with red dots for both the 5 km long transect and the transect near the B52 drilling site (top-right detailed overview). Trenches T13-1 and T13-2 were excavated during the 2012/13 season and trenches T15-1 and T15-2 were excavated during the 2014/15 season (Münch and others 2017) and are shown in the bottom-left overview. The firn core drilling sites are marked by black stars.
After collection, all samples were kept frozen at Kohnen station, as well as during their shipment back to the Alfred-Wegener-Institut Helmholtz-Zentrum für Polar-und Meeresforschung (AWI) in Bremerhaven, Germany, for their measurement of stable water isotopes (δ18O, δD). The stable water isotopes ratios were measured by means of cavity ring-down spectroscopy (l2130-i, Picarro Inc.) and calibrated to the international VSMOW/VSLAP scale. The procedure of Schaller and others (Reference Schaller2016) was used and single measurements are provided with an accuracy of 0.1 per mil for δ18O and 1.5 per mil for δ D.
Small-scale 100 m study, technique validation
We first performed a 100 m scale study to test and validate our sampling tool against previous trench data. Near the B52 drilling site (74.9327°S, 0.4313°E) nine 1 m long snow cores were taken every 10 m. In order to demonstrate and validate our sampling device, we compared the spatial variability of this dataset (hereafter ST-B52) with the four trench datasets of similar spatial scale published by Münch and others (Reference Münch, Kipfstuhl, Freitag, Meyer and Laepple2017). For both δ18O and δ D isotopes, all datasets were averaged over a 1 m depth interval and we calculated each spatial standard deviation (SD) added to its 90% confidence intervals to ensure unbiased estimation of each variability (Bonett, Reference Bonett2006; Pishro-Nik, Reference Pishro-Nik2014, section 8.3.3). The results (Table 1) show considerable variations in the mean values of the different 1 m samples, thus demonstrating the role of stratigraphic noise even on large samples. The resulting δ18O variability (SD = 0.7‰, 90% CI 0.5‰–1.1‰) from the new samples is fully consistent with the earlier trench studies undertaken in the same region.
Table 1. Comparison of variability on the 100 m scale observed with the sampling tool and published trench records (Münch and others, Reference Münch, Kipfstuhl, Freitag, Meyer and Laepple2017)
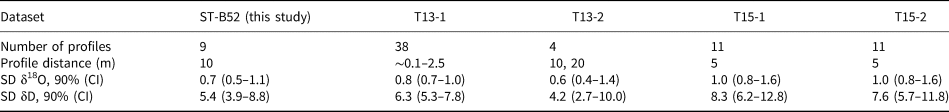
For all datasets, the number of profiles included and their adjacent sampling distance are indicated (δ18O, δD). The standard deviations (SD) and their 90% confidence interval (CI) were calculated using the chi-squared distribution and are expressed in per mil (‰).
Our dataset further allows an investigation into the number of profiles needed to obtain a robust estimate for the mean isotopic value of the area. Assuming independent samples, the standard error of the mean is defined as:

where σ 0 is the standard deviation of the area observed and N is the number of samples included. In our case, the 10 m distance is beyond the decorrelation length of the stratigraphic noise and thus we can assume independence. The required number of profiles depends on the sampling depth and the required accuracy (Fig. 5). For example, to obtain an accuracy (1SD) of 0.28 ‰ for δ18O, six 1 m profiles would have to be stacked. Obtaining the same 1SD level of accuracy for δ18O by sampling only the first 0.67 m requires 15 samples or 21 samples for only the first 0.33 m. The results thus confirm the intuitive result that longer and thus larger snow samples result in less variability.

Fig. 5. Standard error of the mean for the top 0.33 m (green line), top 0.67 m (blue line) and top 1.0 m (red line) of the snowpack versus the number of profiles used (N) for δ18O. For each section of the top meter, the initial and final standard errors values are displayed.
Kilometre scale study
To study the isotopic variability on the hundred metre to kilometre scale, we performed a sampling transect from trench T19 until the firn core drilling site B49 (Fig. 4, 75.04600° S, 0.25396° E). During this study, two 1 m long snow cores were taken 10 m apart from each other, every 100 m. The REMA high-resolution elevation model reveals a net elevation difference of 8 m between the two sites, 5 km apart. Furthermore, comparing the snow depth of volcanic signals in two firn cores B50 (close to Kohnen) and B49 revealed a 10–15% difference in the accumulation rate (Master thesis Alexandra Zuhr, table 4.3, not published) between the two sites.
The sampling transect revealed a small but statistically significant (p < 0.05) trend from trench T19 to site B49 with an increase in the isotopic composition of ~+0.5 ‰ for δ18O (i.e. trend of +0.1 ‰ km−1) when increasing elevation and decreasing accumulation rate (Fig. 6a). As expected from the small-scale variability observed in the 100 m sampling study, this trend is overlaid by strong sample-to-sample variation. We thus average over multiple samples to reduce this stratigraphic noise. Indeed, when averaging over six samples, on a 300 m scale (Fig. 6b) the noise is reduced and reveals a stronger linear trend in δ18O (R 2 = 0.632), supporting this correlation.
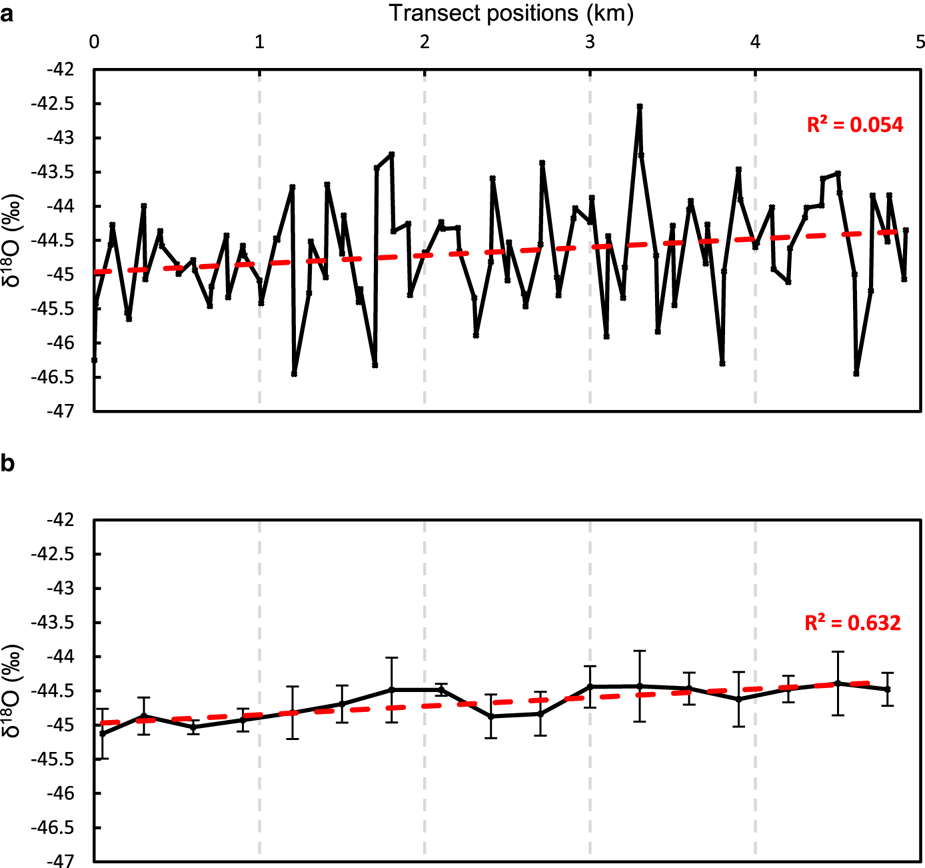
Fig. 6. Evolution of the δ18O isotopic composition in the top meter of the snowpack along the 5 km transect. The black points show (a) the raw data of the transect (two profiles every 100 m) and (b) the 300 m averaged results, with error bars representing one standard error of the spatial averaging. The best linear fit is shown as a dashed red line.
Discussion
We present a new device that allows for fast and highly efficient sampling of the snow surface with a well-defined depth assignment while minimizing possible contamination. We further present two applications studying the variability of water isotopes on different spatial scales. They demonstrate that our device not only allows for the study of stratigraphic noise at the local (metre) scale but also the investigation of the interplay among local topography, changes in elevation and accumulation at the kilometre scale. Initial results of the kilometre scale study indicate that both increasing elevation and decreasing accumulation may lead to an enrichment in stable water isotopic composition, confirming specific effects of local post-depositional alteration of the initial isotopic composition of the snow (Ekaykin and others, Reference Ekaykin, Lipenkov, Barkov, Petit and Masson-Delmotte2002, Reference Ekaykin2016).
The presented device performed very well in the first field application in Antarctica; however, experience gained during the field season also suggest limitations and possible technical improvements.
• The 1 mm wall thickness of the tubes appears to limit the smoothness of pushing down the sampler into the snowpack when hard layers are encountered. Consequently, the effectivity of the device depends highly on the snow condition. Moreover, during the field season, several auger tubes were destroyed due to the repeated use of the auger. To improve this issue, we propose the use of thinner tubes (⩽0.5 mm wall thickness) made of stainless steel; to compensate for the recognizable addition of weight we suggest using a 50 mm diameter hand auger (Kovacs Ice Drilling Equipment) to greatly reduce the diameter of the auger tube.
• Pushing the core out of the sampling tube compresses the snow core, which is problematic when sampling is conducted at a high resolution. We also observed that the tubes absorb incoming solar radiation, leading to a melting and refreezing of the snow core inside, which worsens the snow compression, as it takes more force to push the core out. Using a larger sampling tube combined with shadowing from direct sunlight will improve the issue.
• Modifying the sampler and allow for exchanging the sampling tube in a quick-connect way will permit to ship full tubes to laboratories for detailed analysis. Larger sampling tubes (e.g. 100 mm diameter) would ease firn-densification process studies (Freitag and others, Reference Freitag, Kipfstuhl, Laepple and Wilhelms2013). However, using a sampling tube of such size requires an auger tube with a minimum diameter of 100 mm. In this case, to optimize the total weight of the device, a carbon fibre sampling tube can be combined with a stainless steel auger tube.
• The sampling technique can be extended down to a depth of 2 m simply by adapting the length of the different components. However, sampling further down (e.g. 4–5 m deep) without changing the approach requires the device to be extendable, for example, through several 1 m extensions of the sampler, the core cutting structure and the auger. After each depth increment, the next extension is added with a quick and solid connection system, such as bayonet couplings. Ensuring a straight vertical alignment for sampling can be fostered by implementing a spirit level on the device's plate. Finally, a winch-system at the surface could ease both the removal of deep snow out of auger tube and the core extraction out of the snowpack.
Conclusion
We presented a new dual-tube sampling technique that allows for efficient sampling of the topmost metre of the snowpack with a variable depth resolution. In addition to demonstrating the device's merit in characterizing stratigraphic noise on the sub 100 m spatial scale, we successfully applied the described technique to document the potential effect of local topography on water isotopic composition. The present work focused on the composition of stable water isotopes, but the sampling device exhibits the advantage of noncontact sampling, which is essential for contamination-prone chemical investigations. Adding extension units to our new device in order to sample the snowpack down to 5 m will possibly replace the excavation of trenches, thus avoiding excavation machines and their exhaust fumes. Thus, this new sampling technique is ideal for extensive sampling missions such as surface traverses and will actively benefit the glaciological community through the provision of laterally highly resolved profiles with many sample positions to improve the quality of snowpack characterization. Initially designed for climatological purposes on the East Antarctica plateau snowpack, this technique can be adapted to a variety of snowpack research.
Data
The isotopic datasets of the both small and kilometre scale transects presented in this study are archived at the PANGAEA database, under https://doi.pangaea.de/10.1594/PANGAEA.921928 and https://doi.pangaea.de/10.1594/PANGAEA.921930, respectively. PANGAEA is hosted by the Alfred Wegener Institute Helmholtz Centre for Polar and Marine Research (AWI), Bremerhaven, and the Center for Marine Environmental Sciences (MARUM), Bremen, Germany.
The technical drawings of all the components of the dual-tube sampling device and their assembly are available at the digital library Zenodo, under https://doi.org/10.5281/zenodo.4001469.
Acknowledgements
We thank all the scientists, technicians and logistic support who worked at Kohnen station during the austral 2018/19 summer, especially Klaus Trimborn for his resourcefulness, warm company and skilfulness. We also thank Jan Tell for initial investigations addressing the optimal tube combination. In the name of Matthias Littmann, we gratefully acknowledge the AWI-workshop for the successful realization of the complete sampling device. We further thank Melanie Behrens and York Schlomann for conducting the isotopic measurements in Bremerhaven. This project was supported by Helmholtz funding through the Polar Regions and Coasts in the Changing Earth System (PACES) programme of the Alfred Wegener Institute. TL was supported by the European Research Council (ERC) under the European Union's Horizon 2020 Research and Innovation Programme (grant agreement no. 716092). We gratefully acknowledge the work of three anonymous reviewers and the editor, Alec Van Herwijnen.
Author contributions
JF actively contributed to this work by participating in the design of the technique, the fieldwork, regularly discussed preliminary results and provided guidance to the first author. In addition to motivating and enabling the device development, TL suggested relevant insights, comments and statistical calculus for this manuscript. Via AWI's technical services, JL contributed to the device realization and provided the technical illustrations for the manuscript. MH participated during different stages of the study (philosophy, fieldwork, paper preparation). DDL helped with sampling the presented datasets. FW contributed to the results and discussion sections and edited the language of the paper. RD designed and coordinated the realization of the sampling device, led its use in the field, analysed the results and prepared this manuscript. The manuscript has been reviewed by all co-authors.


 Open access