


Introduction
Within the last few thousand years, a rapid outflow of ice from West Antarctica may have lowered surface elevations by as much as 100 m (Reference Johnsen, Johnsen, Dansgaard, Clausen and LangwayJohnsen and others, 1972; Reference HughesHughes, 1973). Such an event would be reflected in the recent flow history of the Ross Ice Shelf which serves to drain much of the West Antarctic ice sheet (Reference Giovinetto and ZumbergeGiovenetto and Zumberge, 1967). By establishing the age and origin of deep ice within the shelf it is possible to reconstruct past ice movment for comparison with particle paths derived from geophysical and glaciological data.
The age and origin of deep Ross Ice Shelf ice may be estimated from glaciochemical data, particularly the vertical and horizontal variations in sea-salt concentrations. Sea salt is the dominant aerosol on the ice shelf. Sodium, the most abundant cation in sea-water, is a useful index element for that source. The identification of annual cycles in Na concentrations in Ross Ice Shelf cores allows an accurate determination of the recent annual accumulation-rate and the changes in thickness of annual layers with depth due to vertical strain, accumulation-rate variations up-stream, and climatic factors. Continuous sampling will permit the dating of cores. The origin of deep ice may be estimated by matching Na concentrations at depth with equivalent up-stream surface values.
Surface Na concentrations are a function of geographic position on the shelf; the most pronounced effect of this is a dramatic decrease in concentration with distance from the ice front (Reference Warburton and Linkletter, GWarburton and Linkletter, 1977). The concept of Antarctic glaciochemical regimes (Reference Herron and LangwayHerron and Langway, unpublished) indicates that it is possible, on the basis of Na concentrations, to discriminate between ice from West Antarctica, ice from East Antarctica, and shelf ice. Since inland ice generally underlies shelf ice, it is possible to delineate the glaciochemical transition depth in Ross Ice Shelf (RIS) cores, to determine the inland source, and to detect any migration of the flow line dividing East and West Antarctic ice.
Sampling and Analytical Procedures
Sampling locations are shown in Figure 1. Surface samples were collected from two-meter-deep pits located three kilometers south-west, three kilometers west, and ten kilometers south of station J-9, and from C-7-1 under ultra-clean conditions previously described by (Reference Herron, Herron, Langway, Weiss and CraginHerron and others 1977). Ice core samples from J-9 include the 100 m long core drilled electro-mechanically in 1974 (Reference RandRand, 1975) and the 150-155 m core drilled thermally as part of the Ross Ice Shelf Project (RISP) in 1976 Reference Rand(Rand, 1977). Firn cores from C-7-1, C-7-3, and Roosevelt Island dome were also sampled (Reference Langway and HerronLangway and Herron, 1977). Ice core samples were prepared using the "dry core" cleaning procedure (Reference Langway, Langway, Herron and CraginLangway and others, 1974). Firn core samples were prepared by cutting the material to an appropriate length with a bandsaw, mechanically trimming 0.5 cm from the ends with a precleaned stainless-steel chisel, and recoring with a 2.5 cm diameter precleaned stainless-steel tube. Comparative studies show that when samples are prepared with this procedure, chemical measurements are identical to those of duplicate channel samples from a pit wall. Concentrations of Na and Al were determined by flameless atomic absorption spectrophotometry using a Perkin-Elmer Model 503 AA and HGA-2100 graphite furnace and an AS-1 autosampler within a Class 100 clean room. Most of the samples were diluted up to 50 times to bring their concentrations into the linear working range of these instruments.

Fig. 1. Map of the Ross Ice Shelf showing sampling locations. The dashed line represents the approximate division between East and West Antarctic ice-drainage regimes.
Seasonal Variations
The determination of annual accumulation-rates on the Ross Ice Shelf is difficult. Accumulation-rates determined by classical stratigraphic techniques and by measurements of gross β– activity differ considerably (Reference Clausen and DansgaardClausen and Dansgaard, 1977). The gross β– technique is limited to a useful time period of about 25 years. Seasonal variations in the stable oxygen isotope are smoothed by vapor diffusion within a few years (Reference Clausen and DansgaardClausen and Dansgaard, 1977). Various radiometric techniques for dating ice thousands of years old have not yet been investigated due to the lack of available deep ice-shelf samples (Reference Stauffer and MoellStauffer and Moell, 1977).
Pronounced seasonal variations in chemical concentrations have been found in Greenland ice cores (Reference Murozumi, Murozumi, Chow and PattersonMurozumi and others, 1969; Reference Koide and GoldbergKoide and Goldberg, 1971; Reference Langway and HerronLangway and others, 1977; Reference Herron and LangwayHerron and Langway, 1978). Sea salts, indexed by Cl and dust-corrected Na concentrations, exhibit distinct winter maxima when correlated with stable oxygen-isotope variations. The winter salt peaks are evidently due to the effect of severe winter storm systems that agitate the sea surface. Frequently, Na concentration peaks are very sharp compared to the more sinusoidal shape of the oxygen isotope peak, indicating that much of the sea salt input is in the form of distinct winter events, similar to that observed for Japanese rain by TsunogoiReference Tsunogoi (1975).
Sodium concentrations measured on samples from the pit 10 km south of J-9 (Fig. 2a) show clear and regular cycles with an amplitude of about 70 × 10–9 g/g. The cyclic accumulation-rate derived from the chemistry data and the pit density profile is 90 kg m–2. This agrees with the annual accumulation-rate determined for station J-9 by fission product (Reference Clausen and DansgaardClausen and Dansgaard, 1977) and 210Po dating studies (Reference Koide, Koide, Michel, Goldberg, Herron and LangwayKoide and others, 1979) which confirms that the period of the cycles is one year. The samples were collected in late spring 1976, indicating that the initial concentration peak occurs in winter or early spring, as is the case in Greenland. Supporting evidence for a winter sea-salt maximum is shown in the pit profile from C-7-1 (Fig. 2b) where Na concentration peaks and summer ice layers do not coincide. The annual accumulation-rate over the measured interval at C-7-1 (Fig. 2c) is 130 kg m–2 a–1, 30% lower than measurements made 20 years ago by (Reference Crary, Crary, Robinson, Bennett and BoydCrary and others 1962) for a station approximately 60 km inland of C-7-1, but in agreement with stake measurements made about 80 km inland of C-7-1 (Reference Heap, Rundle and MellorHeap and Rundle, 1964). The chemically-derived annual accumulation-rate at Roosevelt Island dome (Fig. 2d) is 160 kg m−2 a−1, in good agreement with the general accumulation pattern (Reference Bull and QuamBull, 1971).

Fig. 2. Sodium concentrations in near-surface samples as a function of depth at
-
a (top left). J-9.
-
b (top right). C-7-1 showing stratigraphically identified ice layers.
-
c (bottom left). C-7-1 at a greater depth.
-
d (bottom right). Roosevelt Island dome.
Sodium concentration peaks, which suggest an annual spacing, are also discernable at depth in the J-9 ice core. Figure 3 shows Na concentrations at a depth of about 66 m with a sampling interval of one centimeter. The annual layer thickness is determined to be about five centimeters of ice compared with the surface value of ten centimeters of ice. Although the present-day annual accumulation-rate up-stream from J-9 is fairly constant (Reference Clausen and DansgaardClausen and Dansgaard, 1977), the rate at the up-stream site and at the time of origin of the deeper ice may have been significantly different. Nevertheless, assuming that the change in annual layer thickness is solely due to vertical strain, a preliminary estimate of the average vertical strain-rate from Na variations on four deep J-9 core samples is 9 × 10⁻⁴ a–1, slightly greater than the surface values of (Reference ThomasThomas 1976). As many more data becomeavailable, it is expected that geographical and historical variations in accumulation-rates will be distinguished from the effects of vertical strain, and that chemical data will provide a supporting basis to delineate past vertical strain-rates.
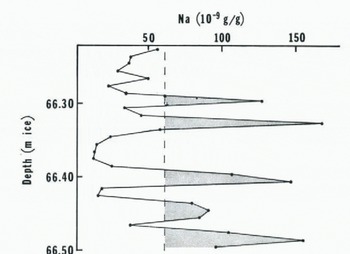
Fig. 3. Sodium concentrations against depth in the J-91974 ice core.
Geographical Variations
Knowledge of the variation in Na concentration as a function of geographical position on the shelf can provide an important check on particle paths derived from glaciological and geophysical data utilizing various assumptions regarding past flow configurations of the ice shelf. The geographical distribution of Na concentrations on the Ross Ice Shelf is predominantly influenced by the distance of the site from the prime source of the element, the ocean. A similar distance–concentration relationship (Reference Warburton and Linkletter, GWarburton and Linkletter, 1977) has been reported for continental areas (Reference JungeJunge, 1963). Observed average values decrease sixfold from 600 × 10−9 g/g at C-7-1 to 100 × 10−9 g/g at J-9, 450 km from the ice front. The upstream shelf origin of ice, now deep below the ice-shelf surface, may be estimated from a comparison of Na concentrations within ice cores and at up-stream surface locations.
The relationship between sea-salt concentration C and distance in kilometers from the ocean D may be expressed as

after (Reference Junge and GustafsonJunge and Gustafson 1957) and (Reference TobaToba 1965), where C0 is the concentration at D = 0, and x is a scale distance. The large seasonal and year-to-year variability in the Roosevelt Island dome and C-7-1 concentrations indicates that a five- to ten-year average may be required for a representative average concentration. For the few long-term data now available, suitable values of x and C0 are 250 km and 600 × 10−9 g/g respectively (Fig. 4). The data of (Reference Warburton and Linkletter, GWarburton and Linkletter 1977) fit fairly well to the same form of the curve and scale distance but at about only half of the C0 value. Perhaps this is due to the effect of seasonal variations and the short-time span represented in their samples. At the RISP Base Camp, where their sampling sequence covered approximately six years, (Reference Warburton and Linkletter, GWarburton and Linkletter 1977) reported an average Na concentration equivalent to that reported here for nearby J-9, as shown by the overlapping points in Figure 4.

Fig. 4. Sodium concentrations on the Ross Ice Shelf as a function of distance from the ocean. Circles represent long-term data given in this report. Triangles represent data from Reference Warburton and Linkletter, GWarburton and Linkletter (1977). The solid line was calculated from Equation(1) with × = 250 km and C0 = 6 × 10⁻⁷ g/g.
It should be mentioned that a number of factors may introduce complications into the simplistic pattern described here. Much of the net accumulation in the south-west portion of the shelf originated in East Antarctica with lower δ18O values (Reference Clausen and DansgaardClausen and Dansgaard, 1977) and presumably much lower Na concentrations. (Reference Warburton and Linkletter, GWarburton and Linkletter 1977) have reported that rime and snow on the shelf have different chemical compositions, and that a measurable fraction of the total shelf accumulation may be in the form of rime. In addition, such secondary factors as mean annual temperature, local accumulation-rate, sea-ice extent, open-water polynyas, and volcanic aerosols from Mount Erebus may substantially affect the pattern of total concentrations and elemental ratios. Clearly the need exists to obtain more long-term concentration data at many sites on the Ross Ice Shelf.
Glaciochemical Regimes
In addition to ice that fell as snow on the shelf, the Ross Ice Shelf contains ice derived from the inland ice sheets of West and East Antarctica. It has been suggested (Reference Herron and LangwayHerron and Langway, unpublished) that large areas of each of these ice sheets are homogeneous as far as sea-salt content is concerned, and that Na concentration is a useful criterion for identifying inland ice within the ice shelf. Table I gives recently reported concentrations of aluminum, alkali, and alkaline-earth elements in near-surface snow and ice-core samples from East and West Antarctica. Aluminum concentrations, which indicate continental dust input, are quite constant over the entire continent and on the shelf ice, including site J-9 where the average Al concentration was 0.7 × 10⁻⁹ g/g. However, two distinct glaciochemical regimes may be identified using Na concentrations as a basis: the continental East Antarctic regime with about 10–8 g/g, and the continental West Antarctic regime where concentrations are a factor of three greater at about 30 × 10–9 g/g. The Ross Ice Shelf may be considered as a third glaciochemical regime. The long-term surface snow and ice-core chemistry data indicate that Na concentrations on the shelf are consistently greater than 30 × 10–9 g/g. Admixtures of local and wind-blown East Antarctic snow in the south-west section of the shelf may have resulted in lower Na concentrations. The average Na concentration in the 150–250 m depth interval of the Little America V (LAV) core was 29 × 10–9 g/g (Reference Langway, Langway, Herron and CraginLangway and others, 1974), indicating that this ice is from the continental West Antarctic regime. The low variability in these samples and in the East Antarctic traverse data of Reference Boutron and LoriusBoutron and Lorius (1977) suggests that, within a given inland glaciochemical regime, distance from the ocean is not a primary factor in determining sea-salt concentrations.
Table I. Concentrations in the continental West Antarctic and continental East Antarctic regimes

The transition from snow which is chemically characteristic of the ice-shelf regime to snow with inland concentration levels probably occurs at some specific altitude. The vertical marine aerosol distribution over continents (Reference TobaToba, 1965) suggests that the chemical transition zone may occur at an altitude of between 500 and 1000 m. It is important to note that the location of this zone will be dependent upon, but will not necessarily be coincident with, the grounding line, which is the physical division between shelf and inland ice. In West Antarctica the 500 m elevation contour is as much as 200 km inland of the grounding line. Thus, the transition at a depth of 150 m in the Little America V core is better described as a glaciochemical transition rather than a shelf-inland transition.
Ross Ice Shelf Gores
To illustrate how these concepts may be applied, Figure 5 shows the measured Na concentrations in the J-9 core as a function of depth. Although the up-stream distance of origin D of ice now at depth may be calculated from the data points using Equation (1), the scatter in the concentrations would make those distances difficult to interpret. Instead, a first approximation of the up-stream distance may be obtained from Equation (2),

modified from Reference HaefeliHaefeli (1961), where d is the depth of ice in meters, A is the annual accumulation-rate in m a–1, ![]() is the vertical strain-rate, and ve
is the effective ice velocity with ve = │v│ sin θ, where │v│ is the magnitude of the velocity vector, and θ is the acute angle between the flow line and the concentration contour. Equation (2) is valid if the effective velocity, vertical strain-rate, and accumulation-rate are uniform with depth and distance up-stream. Over much of the ice shelf these assumptions are probably valid.
is the vertical strain-rate, and ve
is the effective ice velocity with ve = │v│ sin θ, where │v│ is the magnitude of the velocity vector, and θ is the acute angle between the flow line and the concentration contour. Equation (2) is valid if the effective velocity, vertical strain-rate, and accumulation-rate are uniform with depth and distance up-stream. Over much of the ice shelf these assumptions are probably valid.
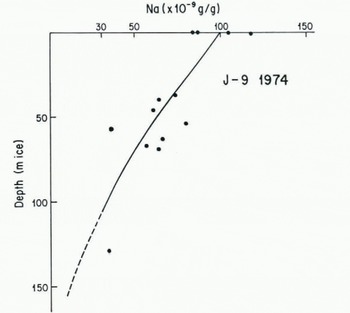
Fig. 5. Sodium concentration-depth profile in the J-9 ice core. Solid line was calculated from Equation (4).
Solving Equation(1) for distance,
and setting (2) and (3) equal to each other, we obtain an equation for the expected trend of Na with depth on the shelf:

The curve in Figure 5 was calculated from Equation (4) using values of A = 0.1 m of ice a–1 (Reference Clausen and DansgaardClausen and Dansgaard, 1977), ![]() = 5 × 10⁻⁴ a–1, and │v│ = 400 m of ice a–1 (Reference ThomasThomas, 1976). A value of ve
= 200 m a–1, or θ = 30° was chosen to fit the chemistry data. A number of sets of values for A,
= 5 × 10⁻⁴ a–1, and │v│ = 400 m of ice a–1 (Reference ThomasThomas, 1976). A value of ve
= 200 m a–1, or θ = 30° was chosen to fit the chemistry data. A number of sets of values for A, ![]() , and ve
can be used in Equation (4) to derive similar depth—concentration curves, and it is not possible to derive a unique set of flow and accumulation-rate parameters from the chemistry data alone. However, it is possible to exclude unreasonable sets. For example, if the effective velocity were doubled, the curve would intersect the Na concentration of 3 × 10⁻⁸ g/g at a depth of only 63 m of ice; this clearly would conflict with the chemistry data.
, and ve
can be used in Equation (4) to derive similar depth—concentration curves, and it is not possible to derive a unique set of flow and accumulation-rate parameters from the chemistry data alone. However, it is possible to exclude unreasonable sets. For example, if the effective velocity were doubled, the curve would intersect the Na concentration of 3 × 10⁻⁸ g/g at a depth of only 63 m of ice; this clearly would conflict with the chemistry data.
The curve in Figure 5 intercepts the characteristic West Antarctic Na concentration of 3 × 10⁻⁸ g/g at a depth of about 105 m of ice or 130 m true depth. Alternate choices for the flow parameters that fit the Na data do not change this depth bymore than 10 m. The intersection represents the glaciochemical transition from shelf ice to ice fromthe West Antarctic regime. The single sample from below 105 m of ice has a Na concentration of 3.4 ×10⁻⁸g/g which is compatible with the indicated West Antarctic origin. If the surface position of the glaciochemical transition is at the 500 m elevation contour which is located about 450 km up-stream from J-9 along the flow line, then the age of J-9 ice at 130 m true depth is about 1100 years. This age is in good agreement with the depth-age relationship developed by Reference ThomasThomas (1976). On the other hand, ice that originated at the grounding line, which is approximately 200 km up-stream from J-9, should only be 500 years old. This is good evidence that the surface position of the glaciochemical transition is located near the 500 m elevation contour rather than near the grounding line.
Similar calculations have been performed for the Little America V core using an effective ice velocity of 250 m a–1 (U.S. Geological Survey, 1972) and a vertical strain-rate of 8×10⁻⁴ a–1. The surface concentration, which is not known, and the accumulation-rate were adjusted to fit the chemistry data of Reference Langway, Langway, Herron and CraginLangway and others (1974). Values obtained were 48 ×10–8 g/g for the surface concentration and 0.12 m of ice a–1 for the accumulation-rate. Near Little America V, accumulation-rates and strain-rates are significantly greater than given here, although up-stream values are comparable (Reference Crary, Crary, Robinson, Bennett and BoydCrary and others, 1962).
In the Little America V core, the glaciochemical transition between West Antarctic and Ross Ice Shelf ice, determined from Figure 6, occurs at a depth of about 130 m of ice or 155 m true depth. The origin of ice at this depth as calculated from the flow data given above is 620 km. The distance from Little America V to the 500 m elevation contour is about 550km, whereas the grounding line is only 320 km up-stream from Little America V (Reference Crary, Crary, Robinson, Bennett and BoydCrary and others, 1962). This provides further evidence that the glaciochemical transition occurs near the 500 m elevation contour. Reference Dansgaard, Dansgaard, Johnsen, Clausen, Hammer and LangwayDansgaard and others (1977) compared the stable oxygen-isotope data from a location near the grounding line with the profile from the Little America V core. They suggested that the shelf inland transition could be as shallow as 120 m (95 m of ice) but not deeper than 180 m. The origin of ice at the 120 m depth iscalculated to be 310 km up-stream, which is very close to the grounding line.

Fig. 6. Sodium concentration-depth profile in the Little America V ice core. Data is from Reference Langway, Langway, Herron and CraginLangway and others, 1974. Solid curve was calculated from Equation (4)
Thus, the Little America core is interpreted as containing shelf ice to a depth of about 120 m, and ice derived from inland of the 500 m elevation contour below a depth of 150 m. The change in ice texture and fabric reported to occur at a depth of 150 m (Reference GowGow, 1970) appears to be associated with ice well inland of the grounding line. Our interpretation is not compatible with the particle-path calculations of Reference Crary, Crary, Robinson, Bennett and BoydCrary and others (1962) which indicate that ice from the shelf–inland transition would be located at a depth of about 230 m. While a relatively shallow glaciochemical transition in the Little America V core could be caused by a surge of the West Antarctic ice sheet feeding Little America V, this does not appear to be the case. Such a surge would be marked by a discontinuity in the form of a sharp change in the slope of the depth–Na-concentration curve which is not apparent in the data. Rather, the data suggest that there is a regular variation in up-stream distance of origin with depth in the core, and that the up-stream distances calculated by Reference Crary, Crary, Robinson, Bennett and BoydCrary and others (1962) may all be too low by as much as a factor of two. The preceding interpretation may be critically evaluated when the particle-path calculations of the Ross Ice Shelf Glaciological and Geophysical Survey are completed, and when stable oxygen-isotope and surface-chemistry data are available for sites up-stream of Little America V.
Summary and Conclusions
Detailed chemical analysis shows that seasonal variations in Na concentrations are detectable in cores from the Ross Ice Shelf. The seasonal maximum in concentration appears to occur in the winter, as it does in Greenland cores. The discovery of seasonal variations makes possible a rapid determination of recent annual accumulation-rates. Seasonal chemistry measurements at site J-9 are supported by the accumulation values of Reference Clausen and DansgaardClausen and Dansgaard (1977) which were generally lower than previously reported values. The possibility of the determination of annual layer thicknesses at depth also exists; however, the low accumulation-rates and relatively high vertical strain-rates present on the shelf result in very thin annual layers at moderate depths, and the reliability of similar measurements has been questioned (Reference Johnsen, Thompson, Hamilton, Bull, Johnsen, Hammer, Reeh and DansgaardJohnsenand others, 1977).
A model is proposed for the large-scale decrease in Na concentration with increasing distance from the ocean. When combined with the chemical profile of an ice core, the model may be used to estimate the up-stream origin of deep ice within the shelf. The model may also be used to produce depth–Na curves expected from given flow and accumulation parameters.
The large seasonal and annual variability in Na concentration indicates that a representative mean concentration for a given location will require a five- to ten-year sampling interval. Snow originating in East Antarctica which is then blown onto the shelf complicates the pattern, particularly inthe south-west section of the shelf. The relative amounts of snow of local and of distant origin might be determined once the general pattern of accumulation-rates, and stable isotope and sea-salt concentrations are identified. Average annual Na concentrations will be a function of parameters such as mean annual or winter temperature and winter storminess. The latitudinal extent of dispersed sea ice is probably important through the inhibition of sea-spray aerosol generation. The Na and Mg concentrations measured in two Greenland ice cores (Reference Langway, Langway, Herron and CraginLangway and others, 1974; Reference Herron, Herron, Langway, Weiss and CraginHerron and others, 1977) are significantly below average during the Little Ice Age (c. 1400–1850 a.d.). The greater predominance of sea salt as an aerosol source on the shelf and the lack of long-term Antarctic meteorological data suggest that continuous measurement of Na concentrations on Ross Ice Shelf cores will be of significant value.
The glaciochemical regimes concept suggests that Na concentration may be used to identify the origin of ice located within the Ross Ice Shelf. It has been shown that East Antarctic snow averages about 10–9g Na g–1, West Antarctic snow averages about 3× 10⁻⁸ g Na g–1, and average concentrations of shelf snow are generally much greater than 3 × 10⁻⁸ g Na g–1. Recent measurements in East Antarctica (Reference Boutron, Boutron, Martin and LoriusBoutron and others, in press) confirm the large-scale homogeneity of Na concentrations at distances from 220 to 1070 km from the coast. Similar traverse data are needed for West Antarctica to confirm the suggested homogeneity and to delineate the surface position of the glaciochemical transition.
The up-stream positions of the glaciochemical transitions in the J-9 and Little America V cores appear to coincide roughly with the 500 m elevation contour, which is as much as 200 km inland of the grounding line. The depth of this transition in the LAV core is considerably shallower than predicted by Reference Crary, Crary, Robinson, Bennett and BoydCrary and others (1962), but the regularity of the Na concentration decrease with depth indicates that this discrepancy is not due to a surge. Rather, it appears that all of the previously calculated up-stream distances are low by as much as a factor of two.
If a surge of West Antarctic ice has occurred within the last few thousand years, it is likely that the flow line on the Ross Ice Shelf separating East and West Antarctic ice (Fig. 1) was farther to the west than now. A deep core taken from the west side of the present flow line and cast of the “surge” flow line should contain shelf ice underlain by predominantly East Antarctic ice. At the appropriate depth–age interval of the surge, however, there would be West Antarctic ice. Such an interval would be identifiable in the chemical profile.
Acknowledgements
The authors would like to thank J. H. Cragin, G. A. Klouda, and D. Watroba for field and laboratory assistance.
Discussion
T. J. Hughes: Do you plan to do any further work of this type to determine whether the line dividing East and West Antarctic ice has shifted over the last 20000 years?
M. M. Herron: Yes. We hope to recover a series of 200 m deep cores from locations near the present drainage divide.
C. R. Bentley: Why do the peaks in sodium associated with sea spray occur in winter and early spring when the open water is farthest away, even at C-7 which is close to summer-time open water?
Herron: The winter maximum in sea spray is also found in Greenland cores where oxygen-isotope data are available for comparison. The simplest explanation is that sea-salt aerosol production is greater due to greater storminess in winter. The effect of sea ice may be important as well.
D. A. Fisher: Does not using sodium concentration as a tracer for the origin of ice assume that there are no climatic trends in sodium deposited inland?
Herron : Yes. Although this has not been studied in West Antarctica, sodium concentrations along the traverse from Dumont d’Urville to Dome C, measured by the French, are quite constant over a 1000 km distance, despite considerable changes in accumulation-rate and temperature. It is hoped that sodium concentrations may well prove a valuable climatic index, and that any past changes can be accounted for.
P. Mackinnon: What is your justification for assuming a constant and different concentration fallout for sodium with respect to time for East and West Antarctica?
Herron: AS shown in Table I, measured values are quite different for the two large areas. The data for West Antarctica are still a bit sparse.
Mackinnon: How does the variation, if it occurs, affect your differentiation between East and West Antarctic ice?
Herron: We have detected a small decrease in sea-salt concentrations in two Greenland cores during the Little Ice Age, so the possibility is real. We can only assume that concentrations in both West and East Antarctica will decrease simultaneously. Short periods of general cooling or warming will appear as small oscillations on a profile of sodium with depth. We expect that Wisconsin Age ice, if it exists in the Ross Ice Shelf, will have elevated concentrations of Al and Si among other elements, as is the case in the Byrd core.


