Introduction
The primary failure mechanism of Arctic ice sheets is fracture. Crack initiation and propagation in ice sheets form the basis of many models of ice structure/interaction, the formation of pressure ridges, rubble fields and leads as well as the acoustic emission associated with field-scale deformations of ice. Fracture is generally taken for granted in the aforementioned models due in part to the limited amount of relevant studies in the ice literature. Consequently, little or no emphasis has been placed on quantifying the specific physical mechanisms of cracking in ice.
Recent investigations into ice-floe splitting (Reference BentleyBhat, 1988; Reference Bhat, Choi, T, Karr, Sinha, Sodhi and ChungBhat and others, 1989) used the finite-element method to investigate the failure of summer ice floes through splitting and eventual clearing of the ice floe following impact with an offshore structure. The crux of the analysis by Reference BentleyBhat (1988) is the assumption that a single, large crack will form and grow stably until a critical length is obtained. At the critical crack length, unstable extension of the crack occurs, allowing complete unloading of the structure. During stable-crack extension, the load that the structure must resist is assumed to increase monotonically until a maximum load, which corresponds to the onset of unstable fracture, is reached. However, no specific material parameter allowing or disallowing stable fracturing is included. Additionally, assuming a crack can propagate slowly in ice, when does the onset of unstable, rapid cracking occur?
Thermal fluctuations, and the effects of ocean currents and winds, all build up internal stresses within an ice sheet. These stresses are relieved by the formation of pressure ridges, rubble fields and leads. Reference Assur and KingeryAssur (1963) discussed his so-called “long-wave cracks” which possess sufficient kinetic energy to extend rapidly for hundreds of kilometers, propagating through first-year as well as multi-year pressure ridges. Assur also noted that the “long-wave cracks” completely disregard the thickness and shape of ice floes in their crack path, cutting right through them. As in the previous example, the processes associated with the formation and propagation of longwave cracks were not specified.
Currently, studies are being performed in order to relate recorded acoustic emission events to the occurrence of crack formation in Arctic ice sheets (Reference Dempsey, Y and DeFrancoDyer, 1988; Reference DyerFarmer and Xie, 1989; Reference Xie and FarmerXie and Farmer, 1991). Reference DyerFarmer and Xie (1989) used theory developed for earthquake engineering which is relevant to ice cracking, albeit on a much larger scale. To model their recorded data, cracking is assumed to occur incrementally; crack growth of this type is usually called “stick-slip” or incremental cracking, and in earthquake mechanics is assumed to be controlled by the narrowest dimension of the crack plane. It is important to note that “stick-slip” cracking has been observed previously in experiments on fresh-water and sea ice.
The aim of this paper is to investigate cracking in saline ice at temperatures above and below the eutectic point of−21.2°C for this ice and at a slow loading rate. The primary objectives are (1) to examine the geometric conditions under which stable cracking can and cannot occur, and (2) to establish a crack initiation/propagation parameter which is capable of delineating the stable to unstable transition which occurs during crack growth. In the context of this paper, it is understood that, prior to crack initiation, there may be sub-critical crack growth for K I < K Ic. This paper does not address sub-critical cracking nor does it address any effects of crack healing. The term “stable crack growth” here implies quasi-static crack growth which would arrest if the applied loads were released.
Crack-Initiation and Propagation Parameters
Catastrophic crack propagation may, depending on size scales involved, be quantified by the plain-strain fracture toughness KIc — a parameter which describes the unstable initiation of a crack and is, by definition, a material property. During ice/structure interaction, however, contact between an ice sheet and an offshore structure often results in the accumulation of damage in the contact zone. In some cases, a limited amount of slow crack growth may occur under increasing load before unstable crack extension and ultimate failure of the ice sheet. This type of fracture cannot be quantified solely by KIc ; instead, a different approach based on the energy absorption capability of the material with crack growth is necessary. The fracture resistance or so-called R-curve method is an appropriate parameter as it measures directly the energy needed for crack growth.
Reference IrwinIrwin and Kies (1954) discussed several anomalies associated with fracture instabilities in metal plates; often, during the loading of cracked plates, load vs displacement curves of these plates were linear until near the peak load. Near the peak load, limited ductility occurred followed by rapid fracture of the plate. In other instances, a large amount of ductility was observed prior to unstable cracking of the plate. To account for these quite different behaviors, it was postulated by Reference IrwinIrwin and Kies (1954) that the work rate of fracture R = ∂W/∂a, where W is the fracture work and a is the current crack length, is a continuously decreasing function of the crack length. The work rate of fracture is also called the fracture resistance of the material and represents the energy dissipated at the crack tip during fracture. If the strain-energy release rate Gc (the crack driving energy arising from applied mechanical energy) increases with crack length while the fracture resistance decreases, the increasing amount of energy in the system causes increased crack speed leading to a change from ductile tearing to rapid fracture. For continued stable cracking, Irwin and Kies presumed a near match of G and R must exist. In a later paper, an ASTM Special Committee Report (1960) altered the previous fracture-resistance concept to include the possibility of increasing fracture resistance with crack extension. Implications of both increasing and decreasing R with crack growth as well as the geometry dependence of Gc will be examined in detail in a later section.
With regard to ice fracture, many studies exist in the literature concerning loading rate and temperature effects on the initiation toughness KIc of ice; crack propagation and crack-growth stability, however, have received only limited attention (Reference DeFranco, Y and DempseyDempsey and others, 1986; Reference BentleyBentley, 1988; Reference Parsons, Snellen, Muggeridge, Saeki and HirayamaParsons and others, 1988, Reference Parsons, Snellen, Muggeridge, Saeki and Hirayama1989; Reference DeFranco and DempseyDeFranco and Dempsey, 1990, Reference DeFranco and Dempsey1991; Reference StehnStehn, 1990, Reference Stehn1991). The difficulty in performing crack-propagation experiments in ice is not generally appreciated, as non-standard fracture-test specimens must be used in order to obtain conditions conducive to stable crack growth. Reference Dempsey, Jones, McKenna, Tillotson and JordaanDempsey and others (1986) and Reference BentleyBentley (1988) used the tapered double cantilevered beam specimen. (Reference Parsons, Snellen, Muggeridge, Saeki and HirayamaParsons and others 1988, Reference Parsons, Snellen, Muggeridge, Saeki and Hirayama1989) used the constant Κ double-torsion (DT) geometry in order to study slow crack growth in ice while Reference DeFranco and DempseyDeFranco and Dempsey (1990) used the compression-loaded double cantilever beam geometry or CFDCB (Reference KendallKendall, 1978) to examine crack-growth stability in S2 fresh-water ice. Using Reference KanninenKanninen’s (1973) idealization of the uncracked ligament as an elastic Winkler foundation, Reference DeFranco and DempseyDeFranco and Dempsey (1990) explained the crack-length effects observed by Reference KendallKendall (1978) during fracture tests on several brittle materials. Recently, the round chevron notched specimen (used frequently for fracture studies on rock) was used for fracture experiments on brackish sea ice (Reference StehnStehn, 1990, Reference Stehn1991). Despite the attempts by the previously mentioned studies to produce stable cracking in ice, all reported incremental or so-called “stick-slip” cracking. “Stick-slip” cracking consists of unstable crack initiation followed by sudden crack arrest. To restart cracking, the applied load must be increased. The reasons for “stick-slip” cracking can, in part, be explained in terms of the shape of the fracture-resistance curve with crack extension and its dependence on crack velocity; additionally, the occurrence of stable cracking is partially dependent on the experimental geometry.
Crack-Growth Stability by R-Curve Analysis
For a crack to propagate in a medium, the crack-driving energy
While the equality of the driving and resisting energies is a necessary condition for crack growth, the rate of change of driving energy must be less than the rate of change of fracture resistance for the crack growth to be stable:

The implications of Equation (1) are illustrated in Figures 1 and 2. Ductile materials such as metals and quasi-brittle materials such as concrete, ceramics and rock often exhibit rising R-curve behavior; in other words, the resistance to fracture increases with crack growth Δa. An increasing R curve is often characterized by a rapidly increasing fracture resistance which levels off to a constant fracture resistance, independent of crack length. This constant fracture resistance is size-independent and is assumed to be a material property. The physical mechanism which causes increased resistance depends on the particular material; in metals subjected to slow loading, for example, the stress intensification caused by a crack is limited by the yield strength and therefore crack extension only occurs following local yielding, void growth and coalescence in the inelastic crack-tip zone (or the so-called fracture-process zone). It is important to note that metals (as well as concrete and rock) subjected to impact loading may fail by brittle, catastrophic fracture; in this paper, only quasi-static loading rates are considered, thus the example of crack-tip yielding in metals serves simply as a contrasting failure mechanism which is not relevant for ice. For concrete, material non-homogeneity results in an increased fracture resistance due to aggregate interlock, microcrack formation, crack branching, fiber bridging and mortar/aggregate-interface cracking.
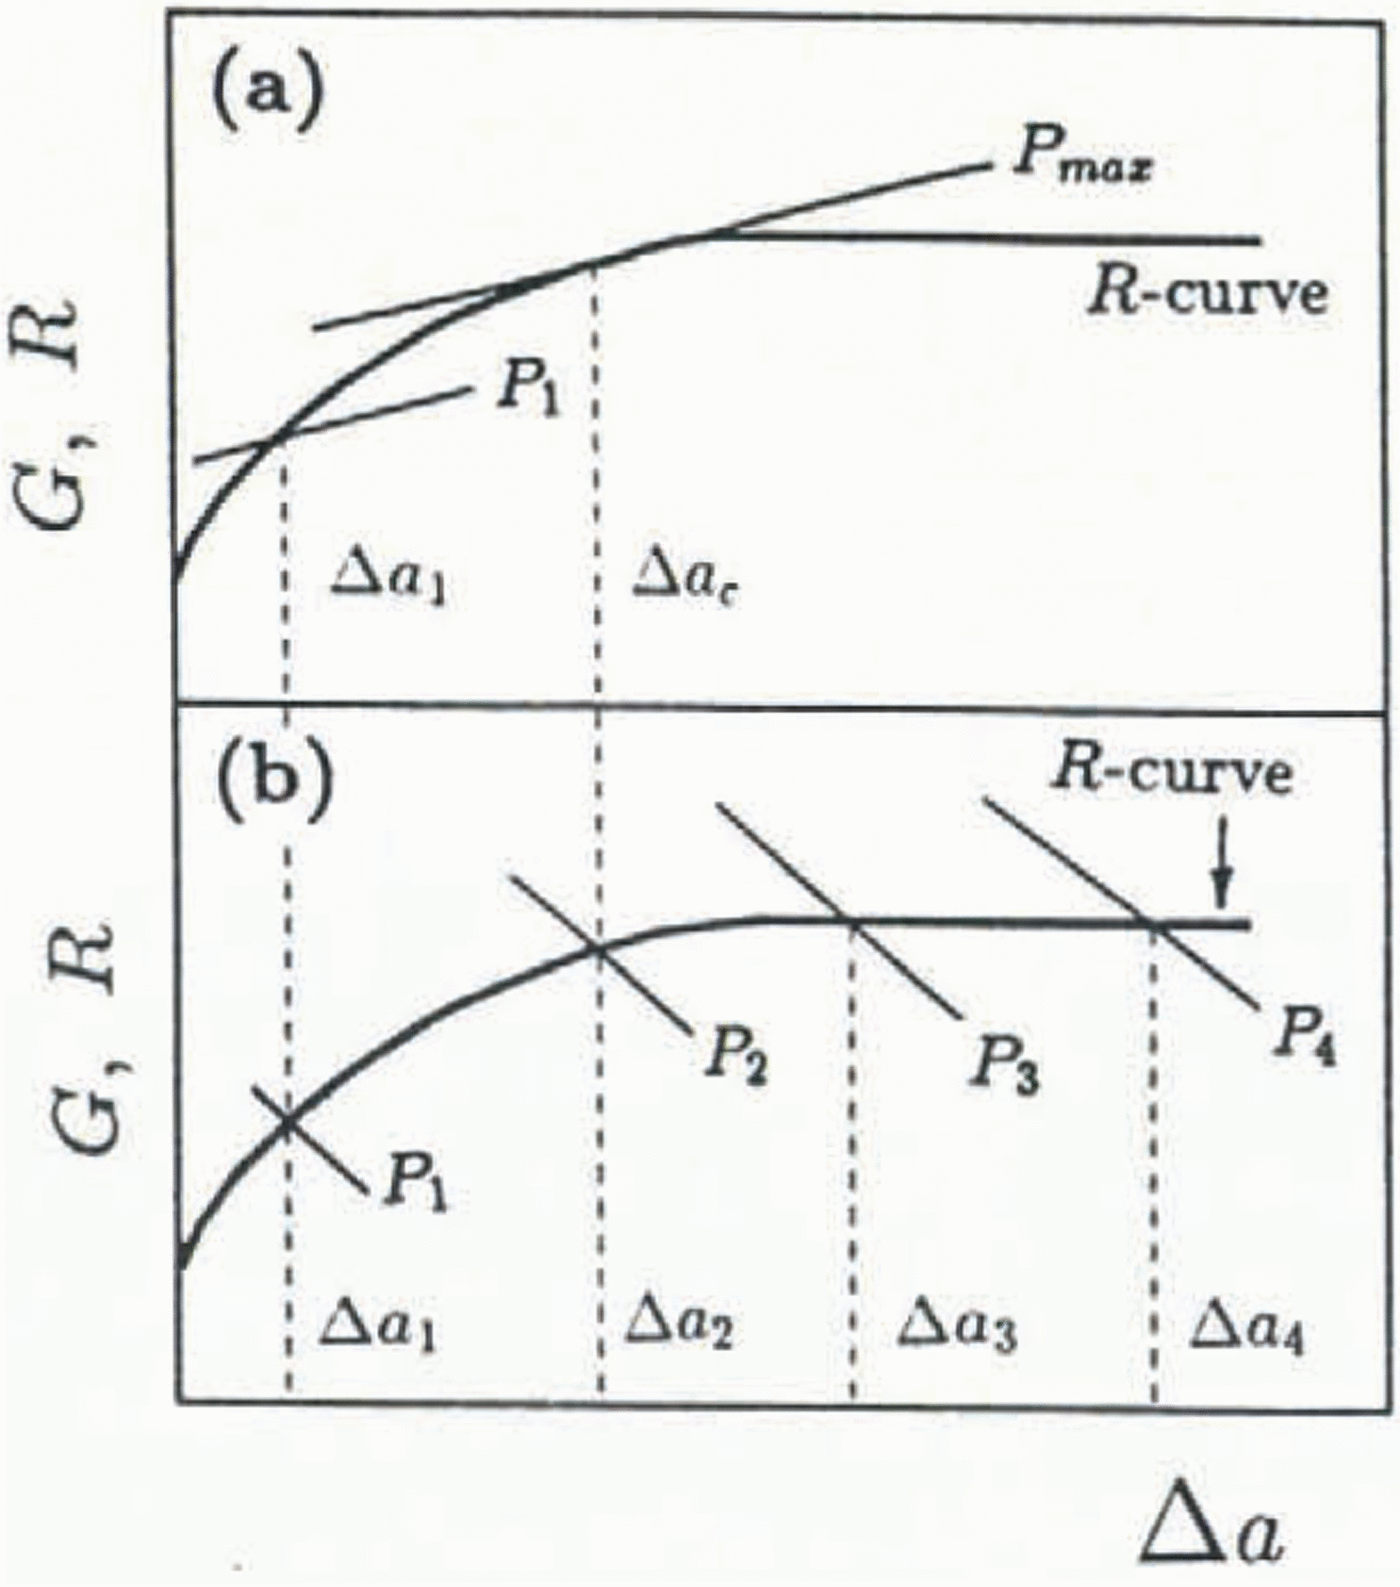
Fig. 1. Fracture behavior using positive vs negative geometry with a positive R-curve material:(a) positive G; (b) negative G.
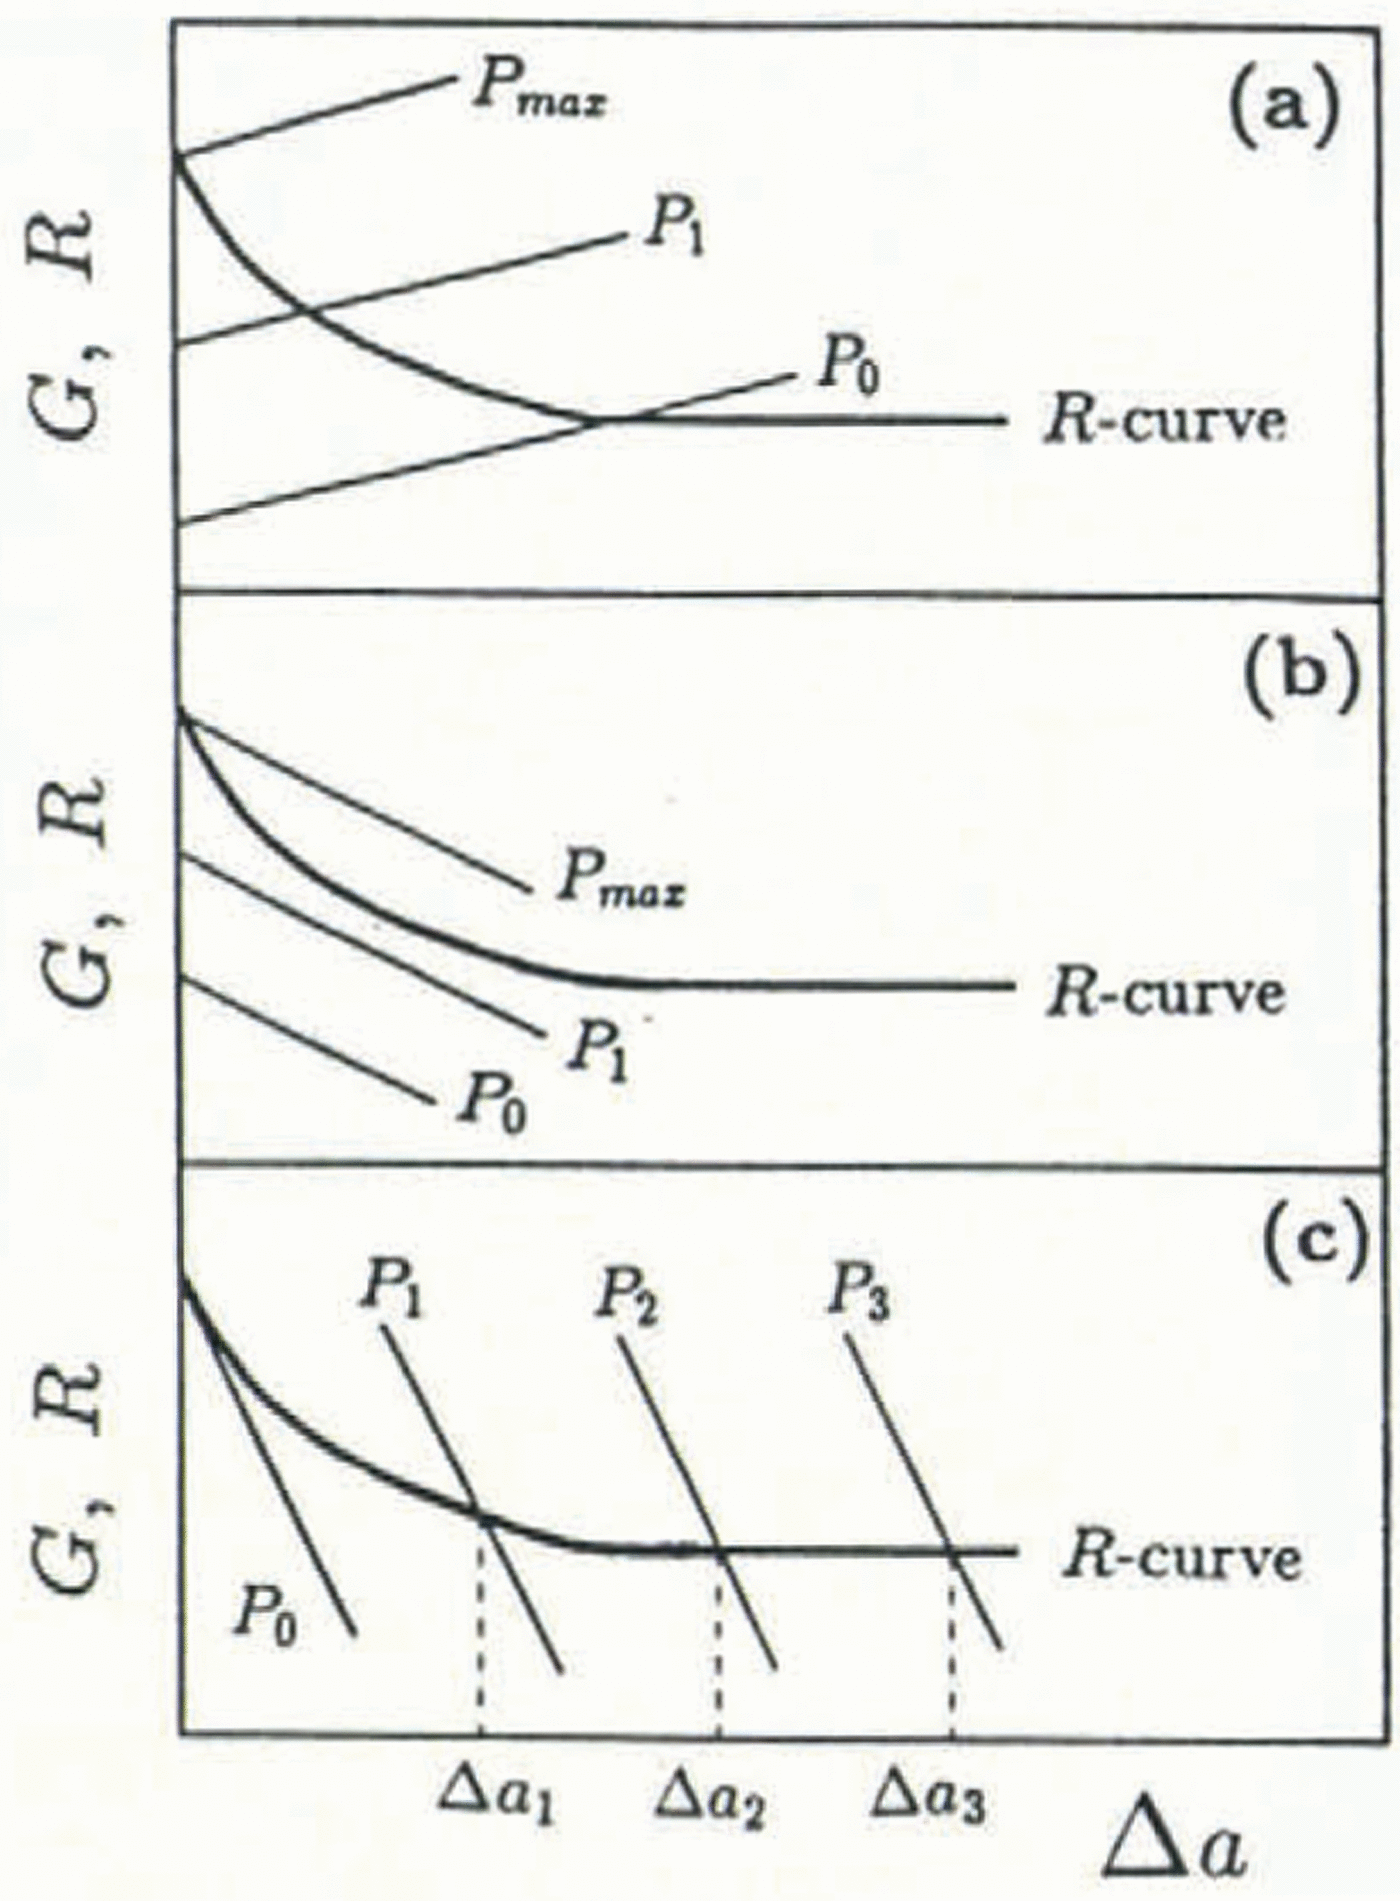
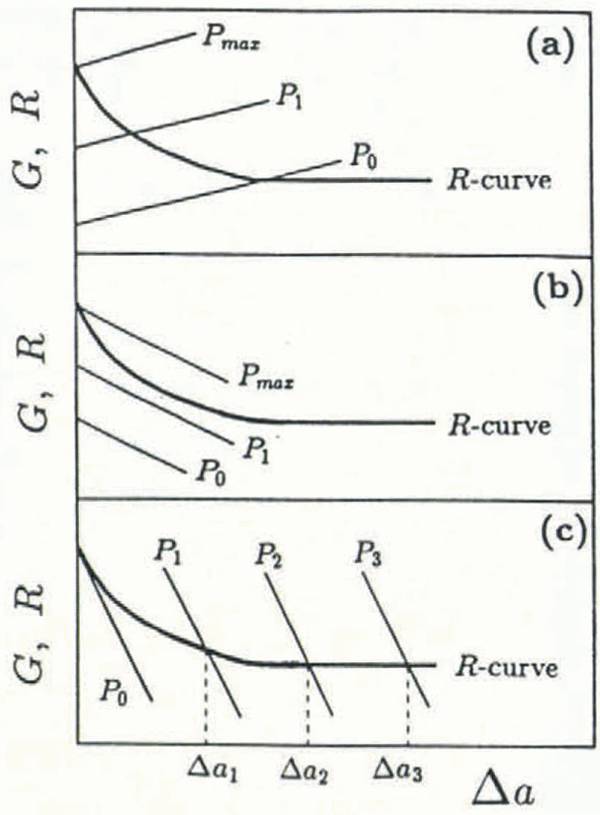
Fig. 2. Fracture behavior using positive vs negative geometry with a negative R-curve material: (a) positive G; (b) insufficiently negative G; (c) sufficiently negative G.
The driving energy G is dependent on the shape of the body, the current load Ρ and crack length a. In Figure 1a, a hypothetical rising R curve is shown together with G curves representing the crack-driving energy with crack growth for a positive geometry. A positive geometry (Reference Planas, M, Mazars and BažantPlanas and Elices, 1990) denotes positive ∂G/∂a behavior which is exhibited by standard fractur mechanics test geometries such as the three-point and four-point bend and the edge-cracked uniaxial tension specimen. At a constant load P1 the associated driving energy G1 intercepts the R curve at a crack extension Δa1 ; at this load, the crack has extended stably an amount Δa1 such that the crack length is now a1 = a0 + Δa1 . This trend continues until the peak load P max where, due to tangency of the G and R curves, Equation (1) is violated and catastrophic failure of the body occurs by unstable fracture at a critical crack length ac = a0 + Δac . Despite the increasing R curve, the positive geometry is incapable of characterizing the whole R curve for this material. In this hypothetical case, a larger specimen size is needed in order to reach the plateau — the size-independent fracture resistance which characterizes the fracture of large, field-scale structures. Reference Peck, Barton and GordonPeck and others (1985) found that for various types of rock, the amount of stable crack growth needed to reach a plateau fracture resistance was several times the grain-size. For example, for Dresser basalt (grain size of 0.04 mm), the requisite crack growth for a plateau resistance was found to be 500 times the grain-size. If ice behaves similarly, and due to the huge grain-size relative to rock, a specimen made from ice having an average grain-size of say 15 mm would need to be at least 7 m long. In the Arctic, where grains of sea ice can be on the order of 100 mm, a fracture specimen would have to be at least 50 m in length. Obviously, a laboratory fracture specimen will be greatly sub-sized and a steady-state fracture resistance may well not be achievable.
Stable crack growth is always achieved for materials characterized by a rising, or flat R curve by means of a negative geometry (i.e. negative ∂G/∂a behavior; Figure 1b). A geometry exhibits negative ∂G/∂a behavior either by shape influences on the specimen compliance or by artificially stabilizing the geometry with ductile straps (Reference Mai and AtkinsMai and Atkins, 1980). In Figure lb, G curves from a negative geometry are shown. By the same arguments as before, at various constant loads P 1 through P 4, crack growth is always stable as Equation (1) is never violated. In this case, the fracture geometry allows sufficient crack extension for the plateau fracture resistance to be measured. Note that a specimen-size effect is still possible with a negative geometry if the minimum necessary crack growth for the plateau R is unobtainable (Reference IrwinIrwin, 1961).
Apparently, stable crack growth is easily obtained for materials characterized by increasing R curves by a judicious choice of an experimental fracture geometry; many materials exhibit stable cracking even with positive geometries, thereby requiring no special testing techniques. For ice, the question remains: even with negative fracture geometries (stable geometric conditions), why does “stick-slip” cracking almost always occur? As saline ice (and sea ice) comprises mainly fresh water ice, at cold temperatures where the brine pockets are at their smallest size and consequently the air pressure in the brine pockets is maximum, cracking will be dominated by the freshwater ice and will be rate-sensitive (in other words, decreasing fracture resistance with increasing crack velocity). Large brine channels will in many cases, however, cause crack arrest due to the higher energy needed by the crack to penetrate these barriers. Subsequently, increased external loading is necessary in order to restart the arrested crack, resulting in a jagged load vs time record. In terms of the fracture resistance, following each crack-initiation event, the R curve decreases until crack arrest. Subsequent crack re-initiation occurs at a higher fracture resistance than the previous crack-arrest value and causes a locally decreasing but globally increasing fracture resistance with crack growth.
Unstable cracking in some rate-sensitive materials may be quantified by a negative fracture-resistance curve. In Figure 2, a negative R curve, which was originally proposed for metals (Reference Irwin and KiesIrwin and Kies, 1954), is shown for various G curves. A negative R curve exhibits decreasing crack resistance with crack growth and may result from the blunting of the stationary crack tip, which, following initiation, sharpens during propagation and increases in speed. At its optimum velocity, the crack tip is atomically sharp and propagates at the lowest fracture energy necessary for propagation until the driving energy drops below the critical value and the crack arrests. Crack-tip heating may also cause unstable cracking by lowering the fracture resistance of the near-tip material. In Figure 2a, a negative R curve is shown with a positive fracture geometry; stable crack growth is never possible as Equation (1) cannot be satisfied. Only unstable crack extension at G= G c is possible at the maximum load. An insufficiently negative set of G curves is shown in Figure 2b. As with a positive geometry, this negative fracture geometry cannot satisfy Equation (1) and catastrophic fracture occurs at the critical energy-release rate for crack initiation. In order to achieve continued stable cracking, the fracture geometry must match the negativity of the R curve. In Figure 2c, a sufficiently negative fracture geometry enables stable crack growth over the full range of crack extension and complete characterization of the R curve.
To date, a very limited amount of stable cracking has been observed in fresh-water ice but only at very long crack lengths (Reference DeFranco and DempseyDeFranco and Dempsey, 1990). Figure 3 in that paper shows the normalized G curve for the CFDCB geometry. Sufficiently negative derivative behavior exists only for very long cracks, verifying analytically the observed cracking as related to the proposed negative R curve. Additionally, Reference DeFranco and DempseyDeFranco and Dempsey (1991) observed slow cracking at various crack lengths in saline ice at −15°C using a new fracture geometry, the reverse-tapered-crack-line wedge load (RT-CLWL). The experiments in that paper and the new fracture geometry are the basis for this work.
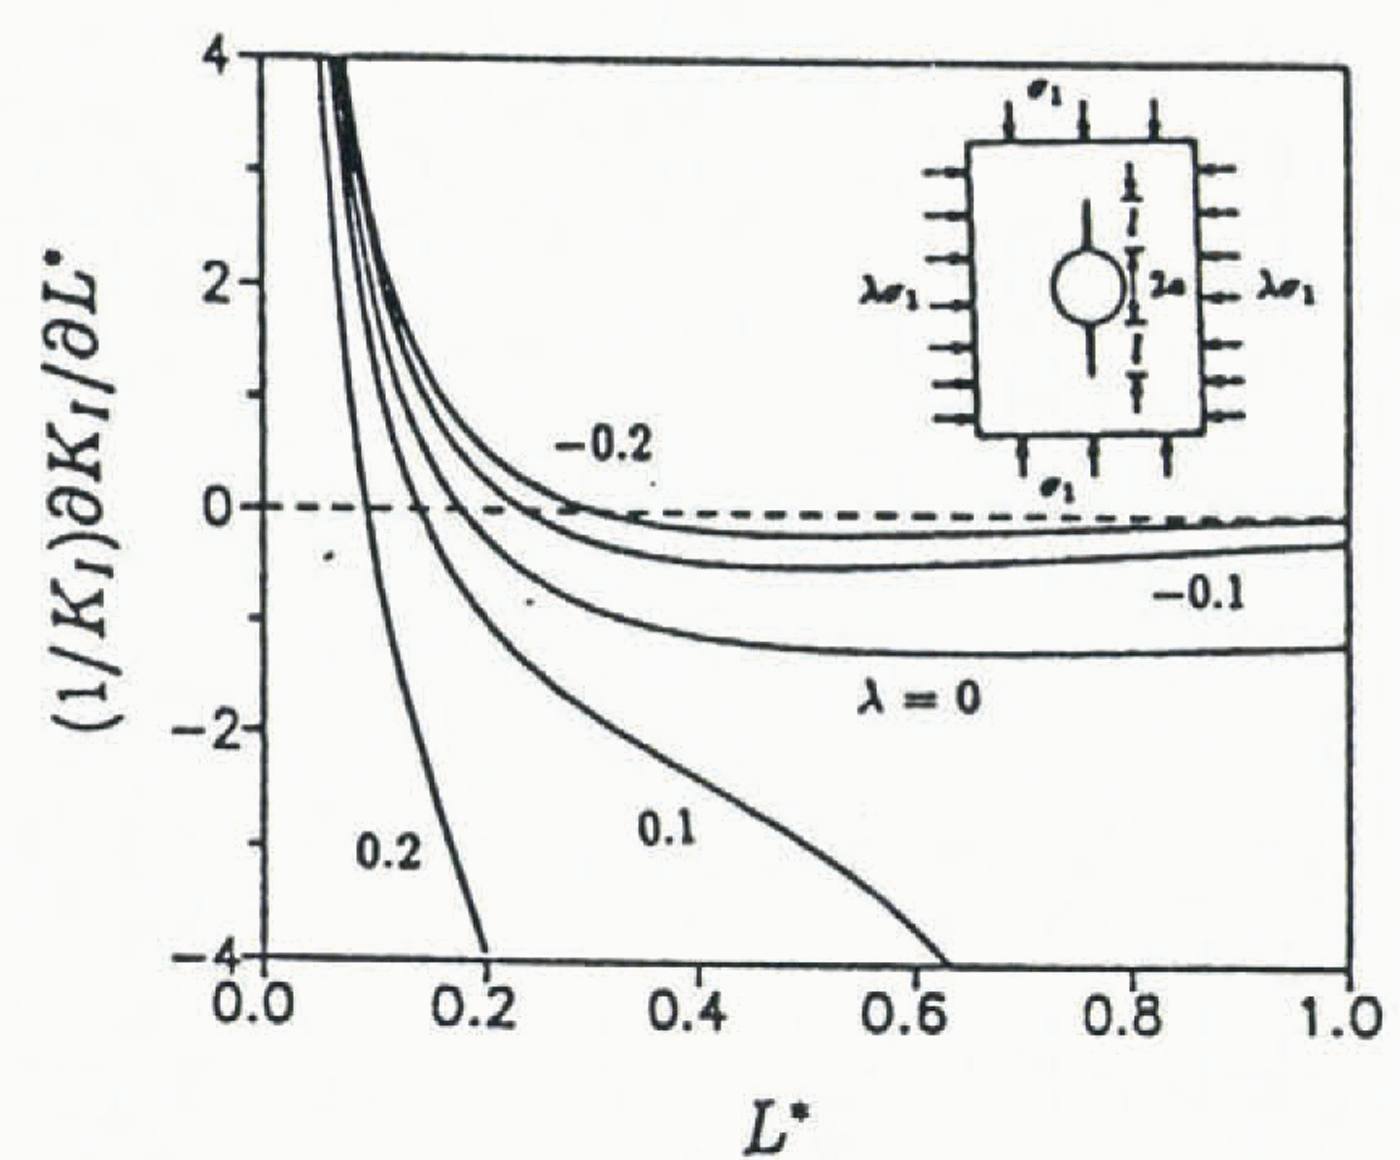
Fig. 3. Geometric stability factor (GSF) for Reference Sammis and AshbySammis and Ashby (1986) compression-failure model.
In the light of the above discussion and a growing amount of literature indicating observations of both stable and unstable crack growth in fresh-water and sea ice, this paper addresses cracking in ice by examination of the equations of energetic stability as defined in Equation (1) with regard to specimen and testing-machine compliance. An R curve for saline ice is determined through use of a new fracture-testing geometry. Experiments performed at two temperatures (−25° and −15°C) indicate that different fracture mechanisms are operable at each temperature, resulting in very different crack-growth behavior. Possible physical mechanisms for the apparent temperature-dependence of crack stability are discussed.
Energetic Stability in Fracture Testing
Reference GoldGurney and Hunt (1967) noted the functional dependence of G on a greatly influences crack-growth stability—by manipulation of Equation (1) and the well-known specimen-compliance relationship of the energy-release rate

where Ρ is the applied load, h is the specimen thickness and a is the current crack length, they determined for the case of displacement control that

In Equation 3, C, C′ and C″ are the compliance and the first and second derivatives of the compliance with respect to the crack length a.

Example: compression failure of brittle porous solids
Fracture and failure of quasi-brittle materials subjected to compressive loading is significantly more complicated than the tensile fracture of a single crack. Compressive failure involves the nucleation, propagation and interaction of a large number of microcracks. However, it is widely accepted that, once nucleated, microcracks propagate primarily as tensile (mode I) cracks in a direction parallel to the maximum principal compressive stress. In this context, an understanding of the behavior of a single crack may appear irrelevant. However, the understanding sought in this paper is a necessary first step.
As an example, crack-growth stability for Sammis and Ashby’s model for crack extension from a single pore or inclusion in an infinite solid due to axial compression loading and either lateral tension or compression is examined. Reference Sammis and AshbySammis and Ashby (1986) modeled the pore or inclusion, in the case examined here, as a cylindrical pore of radius a having symmetrical cracks of length l extending parallel to the direction of applied compressive stress. They determined the approximate mode I stress-intensity factor for a cracked, cylindrical pore in an infinite plane to be:

where σ1 is the compressive stress applied in a direction parallel to the crack, λ = σ3/σ1 (σ3 is the lateral stress), a is the radius of the pore and L* = l/a (l is the length of the crack extension). Note that λ < 0 implies lateral tension; conversely, λ > 0 implies lateral compression. Neglecting machine compliance and, as KI and KR can be used equivalently in Equation (1) instead of G and R, respectively, the GSF is:

The GSF for this model is plotted vs L* in Figure 3 for biaxial stress ratios λ =−0.2, −0.1, 0, 0.1 and 0.2. Reference Sammis and AshbySammis and Ashby (1986) observed from model experiments on glass and PMMA that crack initiation always occurred as an unstable crack “pop-in”. This phenomenon is readily explained by examination of the GSF for this crack geometry: for very short cracks, the GSF is strongly positive, therefore stable cracking will only occur in a material which has a KR curve which rises rapidly enough to cope with the GSF. Glass, PMMA and most quasi-brittle materials have KR curves which rise gradually to a plateau resistance
Finally, it should be noted that the above analysis ignores testing-machine compliance which in a compression test would certainly contribute to crack-growth instability and cause a deviation from the crack “pop-in” length predicted by this analysis.
Applications to ice fracture
The application of this concept to ice was first used in Reference DeFranco, Y and DempseyDempsey and others (1986) for a double-cantilever beam (DCB) specimen and later by Reference Parsons, Snellen, Muggeridge, Saeki and HirayamaParsons and others (1989) using the double-torsion (DT) geometry. Based upon theoretical compliance information, the normalized GSF for the DCB is:

while for the DT

where L is a characteristic geometric dimension of the test geometry. Apparently, crack growth in materials which exhibit increasing, flat or slightly decreasing (dR/ dΔa)/R behavior should be stable in these configurations.
Reference Parsons, J.B, Muggeridge, Cocks and PonterParsons and others (1989), using the DT geometry, reported crack jumping in fresh-water ice at −20°C and in field experiments on sea ice performed at temperatures ranging from −25° to −15°C. Additionally, Reference Selby and MillerSelby and Miller (1975) reported crack jumping in an epoxy resin using a forward-tapered cantilevered-beam geometry (a constant Κ specimen). Examination of the energetic stability equation indicates that “stick-slip” materials may possess locally negative R curves. The observed degree of negativity (or crack-speed dependence) of the R curve is partially dependent on the flexibility of the loading system; even extremely geometrically stable geometries may produce unstable fracture as previously mentioned. However, some remarks regarding negative R behavior can be made in the context of a rigid loading system: for example, if experiments on “stick-slip” materials are performed using a positive or insufficiently negative fracture geometry, a lack of stable crack growth prior to unstable fracture would indicate the inability of the fracture geometry to accommodate the locally negative R curve. This behavior has been consistently observed in fresh-water ice.
Experiments preliminary to this study were performed by the authors on fresh-water columnar ice using the crack-line wedge-loaded (CLWL) geometry (Reference Gurney and JHeyer and McCabe, 1972). The CLWL geometry is commonly used for determining the R curve of metals and is well known to effect slow crack growth in positive (dR/ dΔa)/R materials. An important feature of the CLWL geometry is the mechanical advantage achieved through wedge loading; the machine load required for crack propagation can be reduced by a factor of up to 5 (ASTM E561-86, 1987), hence reducing any fracture instabilities created by machine-compliance effects. Crack growth in the preliminary fresh-water ice experiments, however, consisted mainly of long crack jumps that arrested very near the specimen edge. The motivation for a new test geometry was provided by Reference Mai and AtkinsMai and others (1975), who illustrated that reverse tapering (i.e. decreasing specimen width with increasing crack length) greatly improved crack-growth stability. Additionally, it was found that crack-path stability in reverse tapered geometries was greatly improved from typical forward-tapered, constant K fracture geometries. For this reason, the reverse-tapered CLWL (RT-CLWL) was developed for fracture-resistance experiments on saline ice (Reference DeFranco, Dempsey, Cocks and PonterDeFranco and Dempsey, 1991). The specifics of this geometry will be described in detail in the next section.
RT-CLWL Fracture Geometry
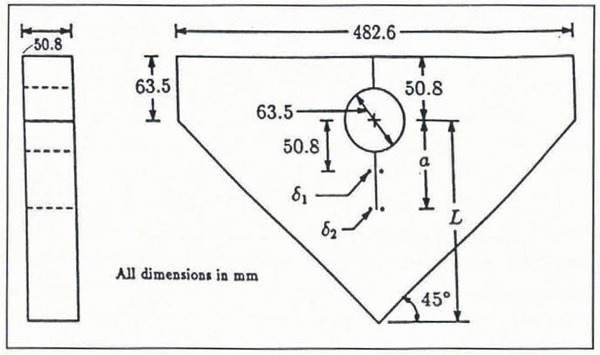
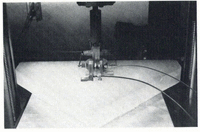
Figure 4 shows a schematic of the RT-CLWL geometry. Loading is applied by a wedge which is in contact with two sets of split pins made in accordance with ASTM E561-86. Each split pin consists of a load sector which contacts the specimen and a tapered wedge-load block which fully contacts the loading wedge (see Figure 5). To ensure proper alignment of the load sectors and the load path, the wedge-load blocks are machined such that line contact exists. Figure 5 shows a schematic of the loading fixture. As the wedge is displaced downward by the cross-head of the test frame, loading is applied by the load sectors and wedge-load blocks, which rest on sliding retainer blocks, which in turn rest on a base block. The wedge, wedge-load blocks and load sectors were constructed of stainless steel and the base block and sliding base block and sliding retained block were constructed from 6061-T6 aluminum (Figure 5). Powdered graphite was used as a lubricant in order to reduce friction between all components. An RT-CLWL specimen ready for testing is shown in Figure 6.

Fig. 4. The reverse lapered-crack-line wedge load (RT-CLWL) fracture geometry.
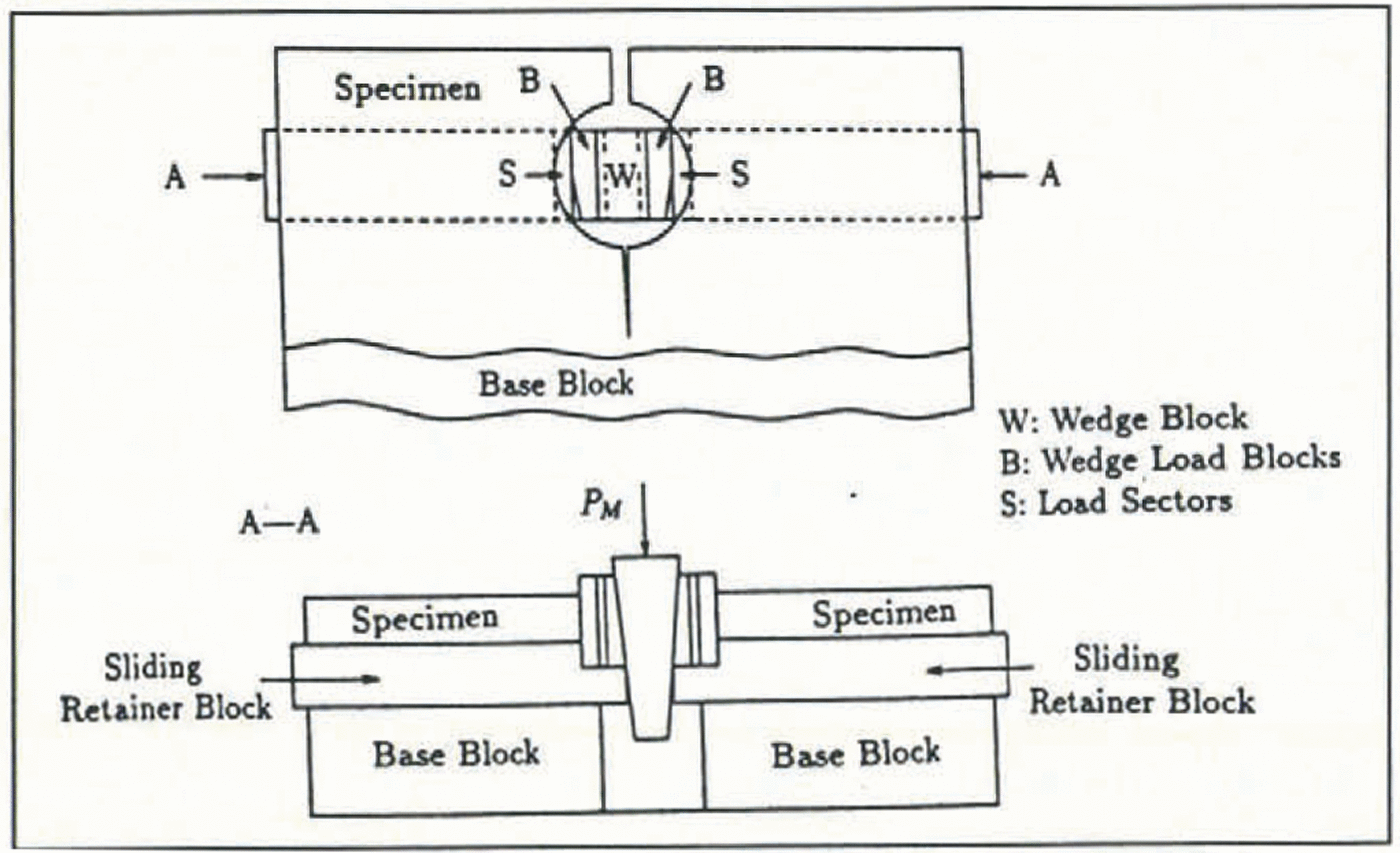
Fig. 5. Wedge-loading apparatus and set-up.
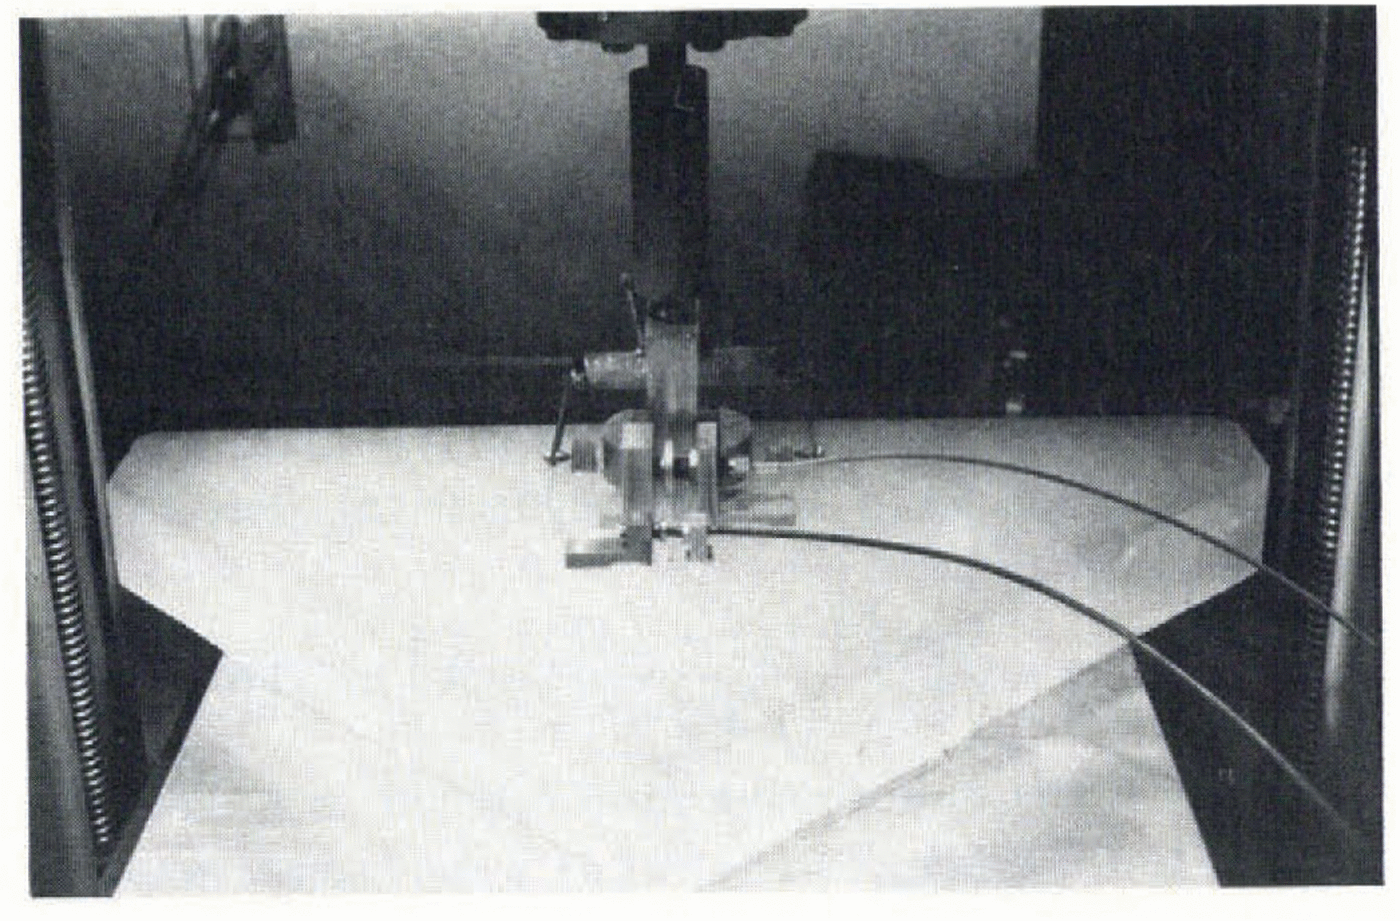
Fig. 6. RT-CLWL specimen ready for testing.
An important parameter to be determined was the friction which exists between the loading components. To accomplish this, a steel plate (355 mm × 152 mm × 6 mm) was constructed as shown in Figure 7 and loading was applied to the center hole during different trials using either direct tension or wedge loading. Stress concentrators (14 mm diameter holes) were placed along the tension line in order that measurable strains would occur at load levels similar to those experienced during an ice-fracture experiment. By comparing linear regressions of load vs strain plots for each type of loading, the ratio of the opening load Ρ to the machine load Pw was found through several load-unload cycles to be:

All loading cycles were performed in a cold room at −25° C and in each case the load vs strain plots were linear.
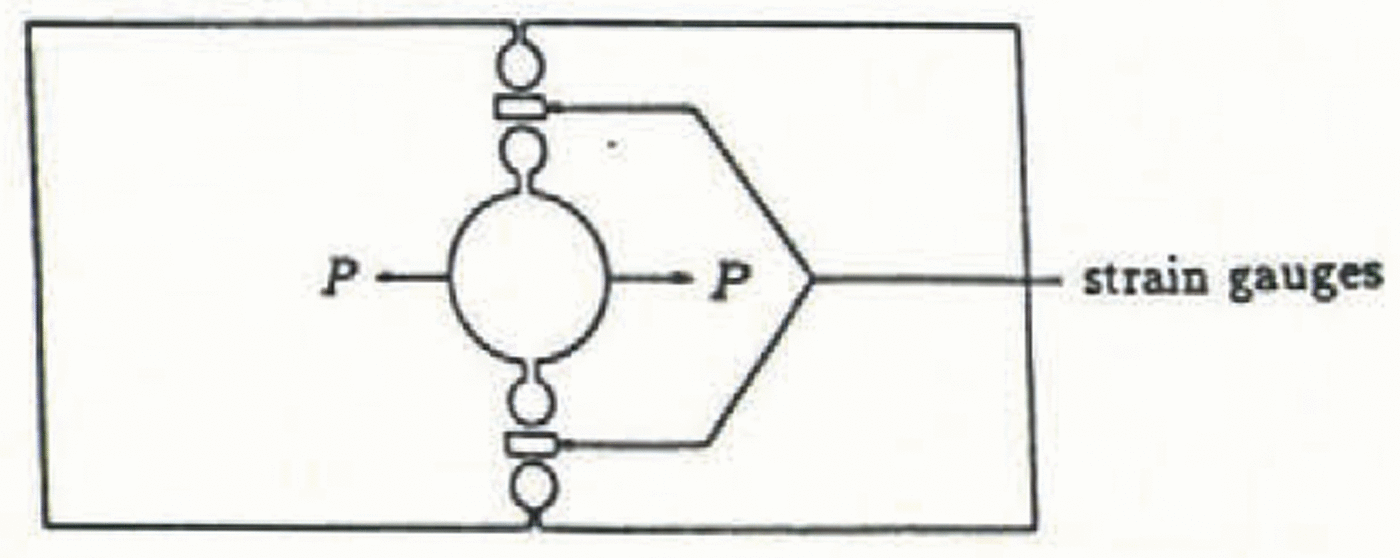
Fig. 7. Schematic of device used for friction analysis.
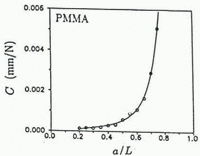
In order to determine an expression for the energy release rate, compliance measurements were performed on an RT-CLWL specimen made of PMMA (thickness h = 25.4 mm, all other dimensions are given in Figure 4) at 0.05a/L crack increments for 0.20 ≤ a/L ≤ 0.75. Three loading trials were performed for each crack length and the average value of the three was used. Elastic response of the PMMA was ensured by zero-to-peak loading times of less than 5 s and all loading components were liberally coated with powdered graphite. The specimens were not loaded to fracture in any trial and all experiments were performed at −25°C. The load vs load point-displacement plots, as well as load vs all crack-opening displacements, were linear up to the maximum applied load in each case.
The compliance was found by a least-squares curve fit to be:

where Eʼ is the effective elastic modulus (assumed to be 3.93 GPa for PMMA), h is the specimen thickness and a = a/L. The form for Equation (9) is similar to the approximate compliance expression for the reverse-tapered geometry in Reference Mai and AtkinsMai and others (1975). The experimental data for PMMA is plotted in Figure 8 along with the least-squares curve fit; as a good fit was obtained from the above expression, derivatives of the compliance in Equation (9) were assumed to represent accurately the actual behavior. From Equation (9), the linear elastic, isotropic relationship K2 = GEʹ and Equation (2), the fracture-resistance stress-intensity factor K R is given by:

where
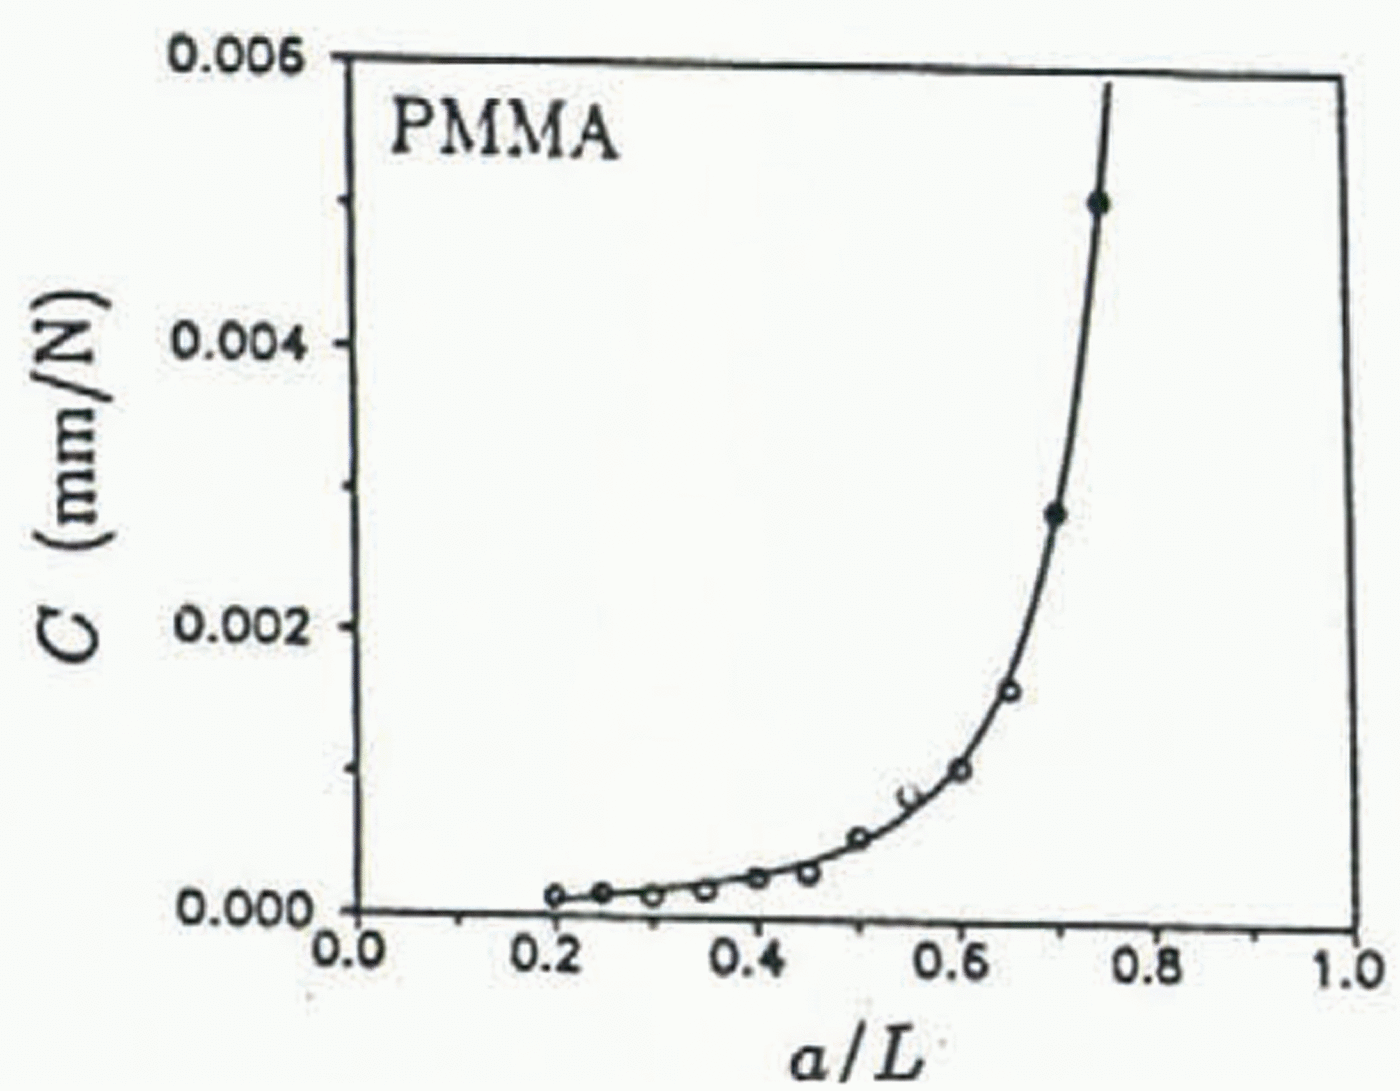
Fig. 8. RT-CLWL compliance curve for PMMA.
Figure 9 shows the geometric stability factors for the DT, the ideal DCB and RT-CLWL geometries. The effects of machine compliance on the RT-CLWL’s GSF (ATS Model 1105SE testing frame; frame stiffness of 24.5 kN mm−1) used in this study are shown as a dashed line in Figure 9 assuming an elastic modulus of 4 GPa. Additionally, the compliance effects of a recently acquired Instron model 8502 testing frame (frame stiffness of 265kN mm−1) are shown. The RT-CLWL is affected by machine compliance; however, crack-line wedge loading is a very easy procedure compared to the quite complex procedure of testing a weak material (like ice) with the DCB geometry. It should be noted that the elastic modulus of the material significantly affects the GSF; for warm sea ice, the effective elastic modulus is typically much less than fresh-water ice at the same temperature and, therefore, cracking in fresh-water ice should be much less stable than in sea ice. However, the advantages of a stiff testing machine are evident in Figure 9, as the GSF which includes the effects of the Instron machine compliance is close to the ideal situation of an infinitely stiff testing machine.
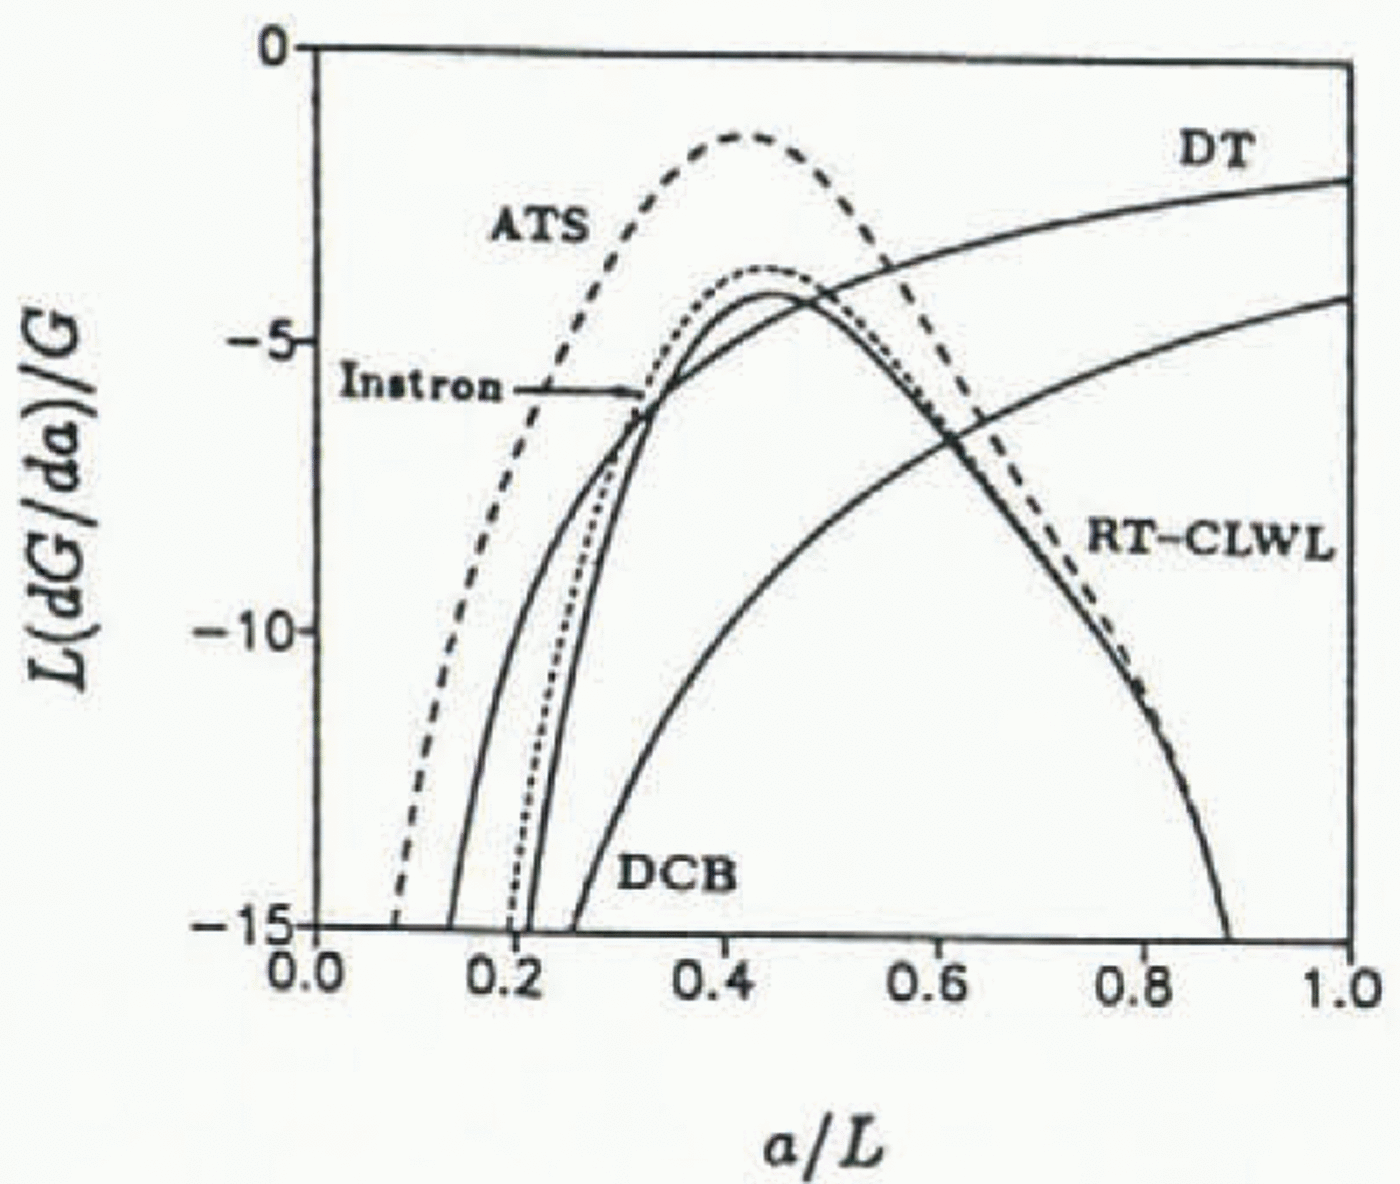
Fig. 9. Energetic stability comparison double torsion (DT), double-cantilever beam (DCB) and RT-CLWL in a rigid testing frame. Dashed line shows the effects of machine compliance on stability.
In a rigid testing machine, the RT-CLWL, DT and DCB fracture geometries all have negative GSFs (solid lines) for any crack length. However, due to “stick-slip” crack propagation observed in ice, continuous stable crack growth is limited to regimes of very negative (dG/da)/G. For short cracks, all of the geometries appear to have sufficiently negative stability factors (note that the RT-CLWL does not have a physical crack until a = 0.125). For intermediate crack lengths (a ≈ 0.4), the GSF for the DCB is slightly more favorable for stable crack growth than the RT-CLWL and the DT; however, for long crack lengths, the RT-CLWL is most favorable for stable fracturing and, as will be noted in a later section, crack-jump increments were on the order of millimeters. For longer crack lengths, the DT and DCB geometries are increasingly unfavorable for “stick-slip” cracking materials.
Experimental Procedure
The columnar saline ice used in this study was grown in an insulated tank (1.22 m × 1.14 m × 0.78 m deep) in a cold room by spray-seeding the chilled water surface to initiate columnar growth. The ice was grown to a depth of approximately 0.15 m and cut into blocks measuring approximately 0.30 m × 0.50 m × 0.15 m thick using an electric chain-saw. The average grain-size was approximately 15 mm and the ice had an average density at −25°C of approximately 912 kg m−3. Salinity was measured using a LabComp SCT microprocessor-controlled salinity meter. The bulk salinity was found to be 7.59±1.44‰. The ice blocks were immediately moved to an adjacent cold room where they were stored at −25°C for a minimum of 24 h. After the blocks were isothermal, three plates were cut from each block and were made parallel by a planer. The edges were formed by a jointer, thus ensuring that each plate was a uniform prism. To form the final shape for each RT-CLWL, the dimensions were carefully measured and then cut on a band-saw. Each finished specimen was approximately 50 mm thick. Drilling the 63.5 mm hole in each plate for the loading sectors presented special difficulties in that successively larger holes had to be drilled in order to prevent the specimen from fracturing during the drilling operation. The drilling sequence was: (i) drilling a pilot hole with a 25.4 mm wood spade, (ii) enlarging the hole with a 38.1 mm wood spade and (iii) drilling to the final diameter with a Forstner bit. Several specimens were ruined before an acceptable drilling procedure was established. The finished hole was very smooth and uniform throughout its depth, although slight spalling occurred around the circumference on the bottom face. Each completed specimen was then moved to the ATS testing frame where the COD transducers (δ 1 and δ 2) were frozen to the top ice surface. Two small stainless steel blocks were frozen close to the point of application of the load in order to mount the load-line displacement (δ 1LL) extensometer. The blocks were indented with a conical punch to accept the centering points of the extensometer. The COD transducers were Kaman models KD2310-3U (δ 2) and KD2810-1U (<52) non-contacting eddy-current sensors and the load-point displacement gauge was a specially designed extensometer. A sharp crack was then made by scribing a razor blade over the crack front (Reference DeFranco and DempseyDeFranco and others, 1991; Reference Wei, S.J and DempseyWei and others, 1991). The crack front in each specimen was parallel to the growth direction of the columnar crystals which corresponds to radial cracking of an ice sheet.
Determination of the length of each crack jump was extremely difficult due to the opacity and microstructural defects inherent in saline ice. However, a fiber-optic lighting system was used to illuminate the crack-tip area and each crack jump was measured to within a few millimeters. Fiber-optic lighting was found to work very well with ice as the optic fibers transmit minimal heat, thereby preventing any thermal cracking or melting of the ice surface. In a typical Ä-curve experiment on metals, the observable traction-free crack length cannot be taken as the actual crack length due to non-linear material behavior in the highly strained crack-tip area. The effective length of the non-linear zone is typically accounted for through the double-compliance method (Reference Gurney and JHeyer and McCabe, 1972). In this method, measured crack displacements at two points on the crack face are compared to elastic-compliance functions from which an elastically equivalent crack length can be calculated. These functions are determined either by curve-fit measurements on a brittle, linear elastic material or by the finite-element method. While this technique is suitable for many materials, Bazant and others (1986) expressed doubt as to the validity of indirect compliance techniques for microcracking brittle materials in which opened microcracks do not completely close, causing opening and closing compliance to be different from the compliance for continued loading. Furthermore, in ice, crack-tip creep and/or anelastic (delayed elastic) deformation may cause uncertainties in the measured loading and unloading compliance. In this study, the traction-free crack (TFC) was taken as a first approximation to the actual crack in saline ice at −25°C; due to the brittle-cracking behavior to be discussed in the next section, the non-linear zone is probably small enough to be ignored at this juncture.
All components of the split pins were coated with graphite and positioned in the RT-CLWL specimen taking care to ensure proper alignment with respect to the desired loading direction. All loading was accomplished by an ATS 1105SE displacement-controlled testing frame and all data were recorded by a Keithley Series 500 data-acquisition and control system. Data acquisition was performed at 100 Hz for tests times of 200 s and all data were stored in a Zenith Z248 microcomputer.
Results and Discussion
In order to examine temperature effects on the fracture resistance of saline ice at slow loading rates, four RT-CLWL specimens were successfully tested at −25°C and three were tested at −15°C. All of the test data are given in Table 1. The rate of increase of stress intensity Κ was maintained at approximately
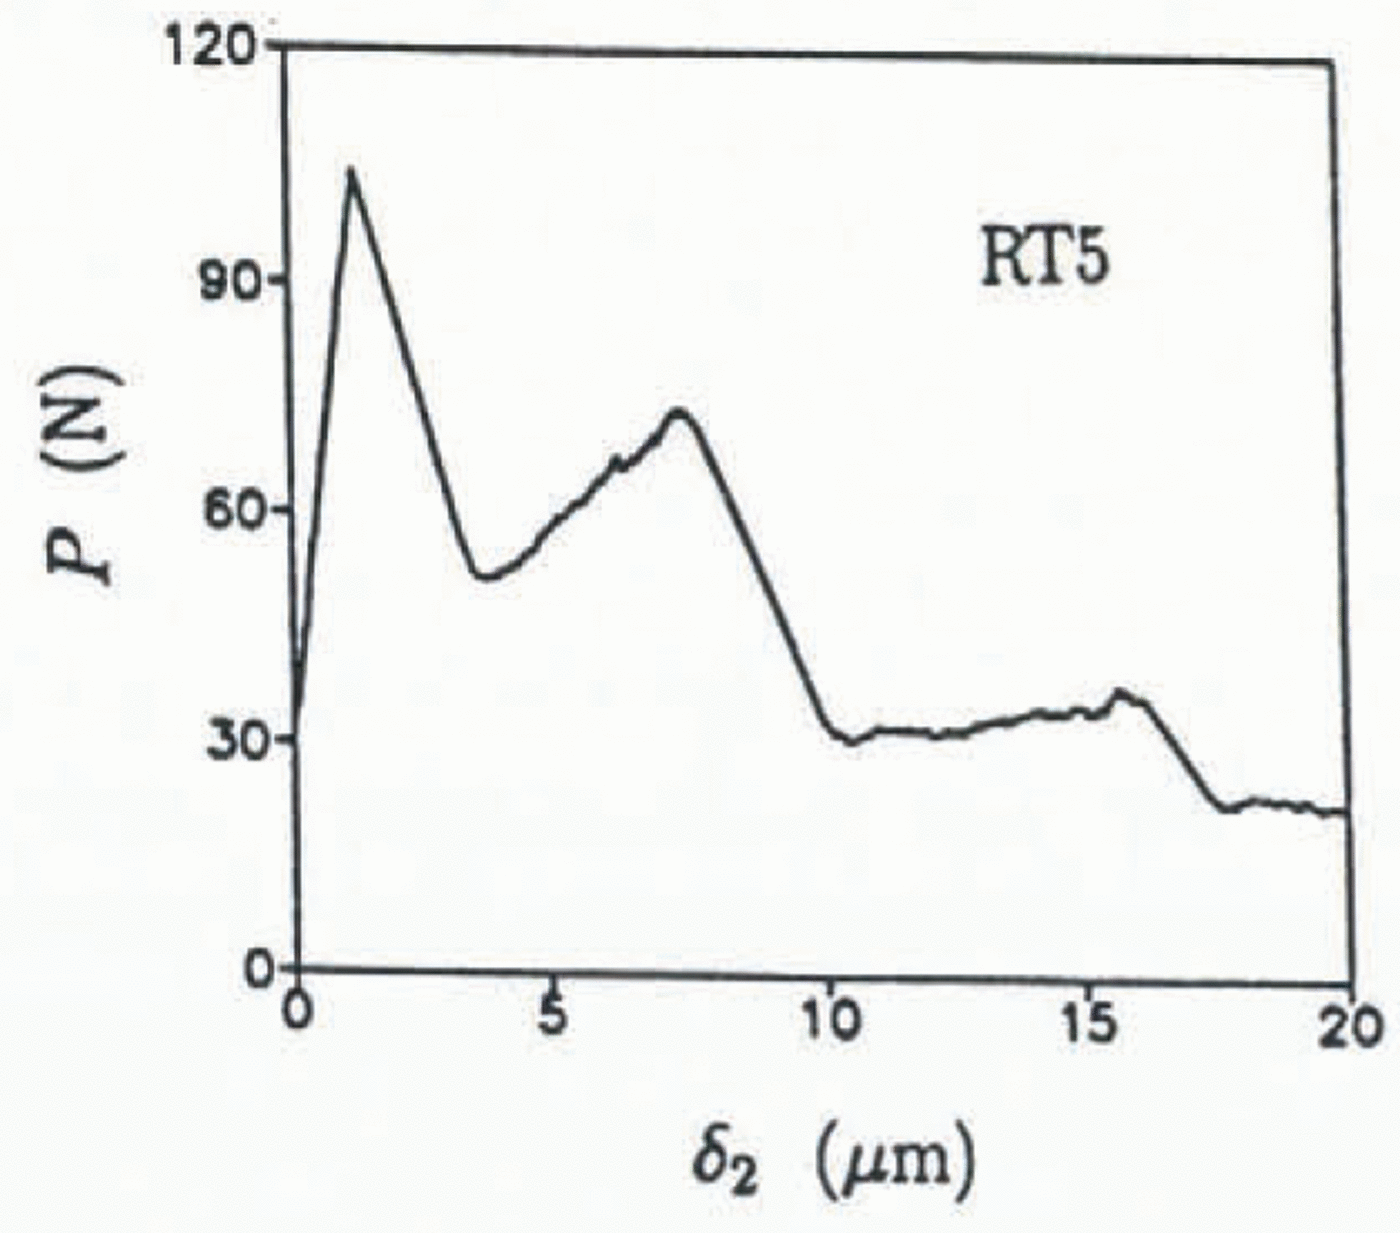
Fig. 10. P vs δ2 at −25° C.
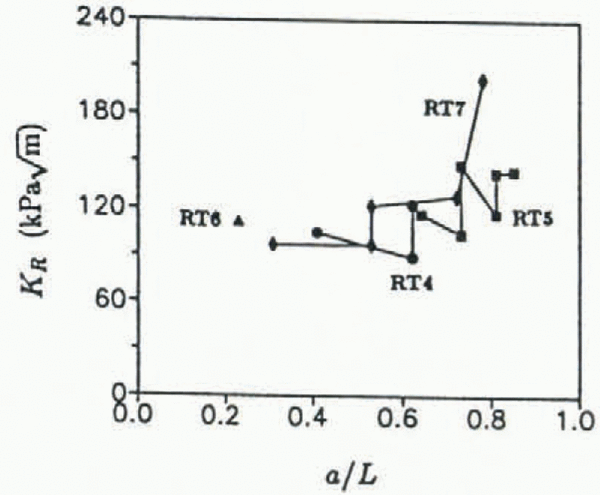
The KR curves for specimens RT4, RT5, RT6 and RT7 (tested at −25°C) are shown in Figure 11. The overall trend shows an increasing KR with crack growth; however, locally for each crack-jumping event, the fracture resistance decreases with increased rate of crack propagation until the crack motion arrests. As was previously found by Reference DeFranco and DempseyDeFranco and Dempsey (1990) for fresh-water ice, an increase in load was needed to restart the arrested cracks. This behavior must result from the large percentage of fresh-water ice, as can be observed in the phase diagram for saline ice, which apparently dominates the mechanical behavior at cold temperatures. On the other hand, the initiation KR values increase with crack length. Assuming that the crack arrest occurred at a grain boundary or brine channel, the reinitiation energy would most likely be higher.
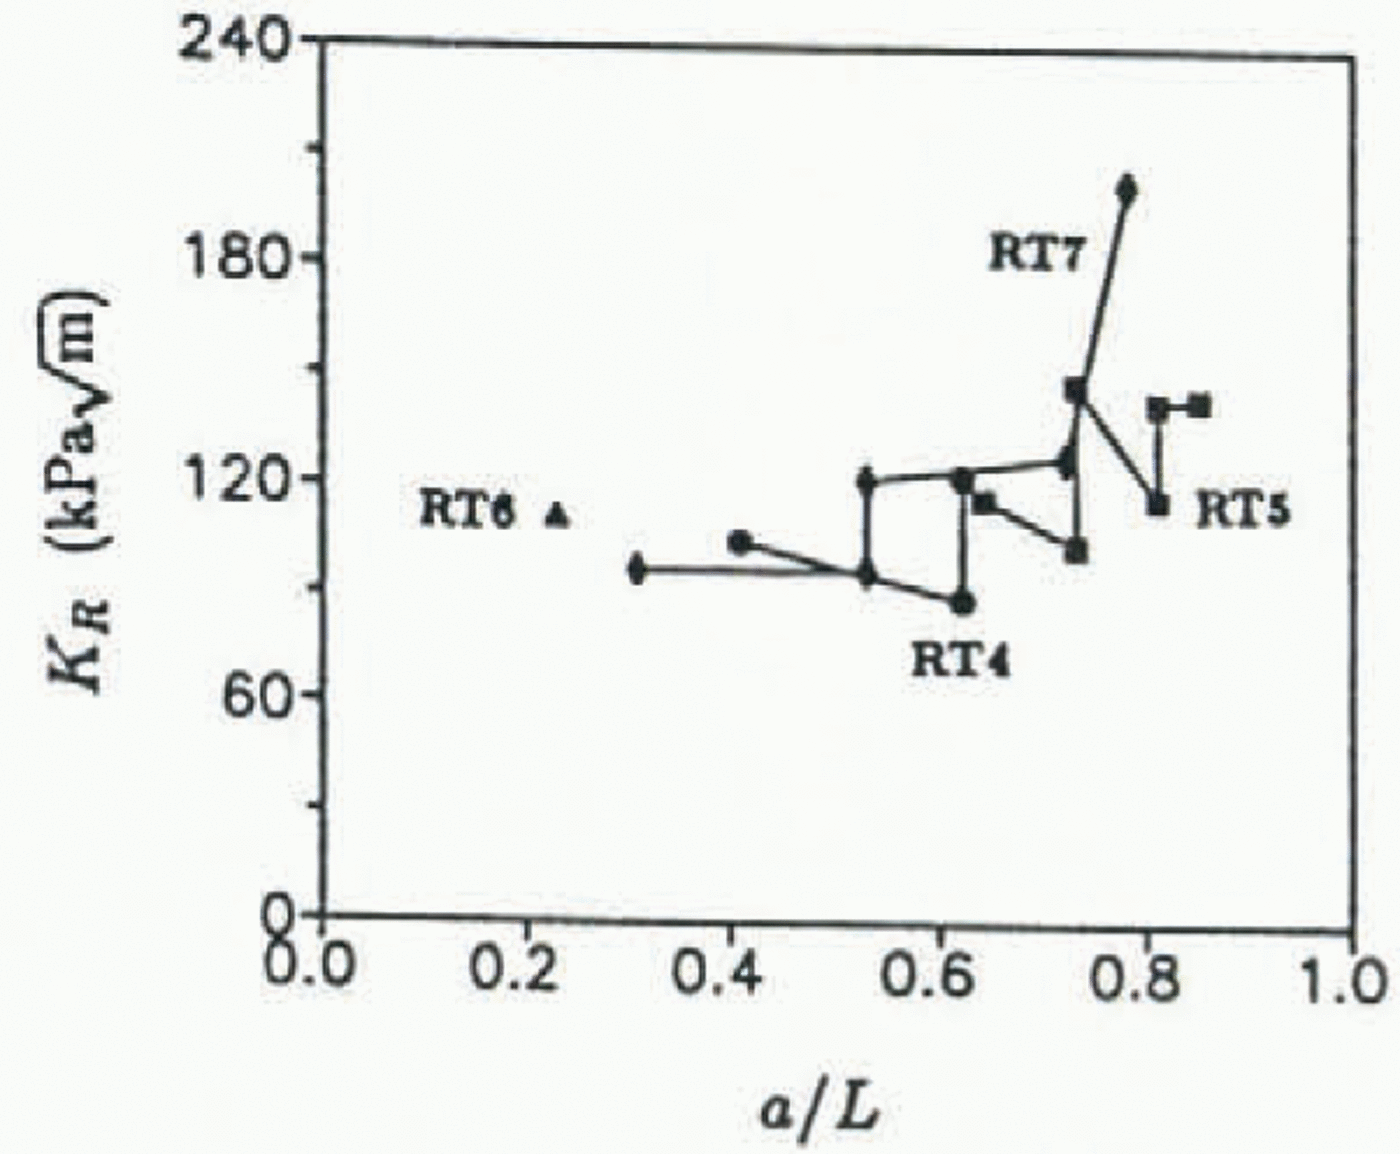
Fig. 11. KR vs Δa/L for saline ice at −25°C.
Table 1. Fracture-resistance test data

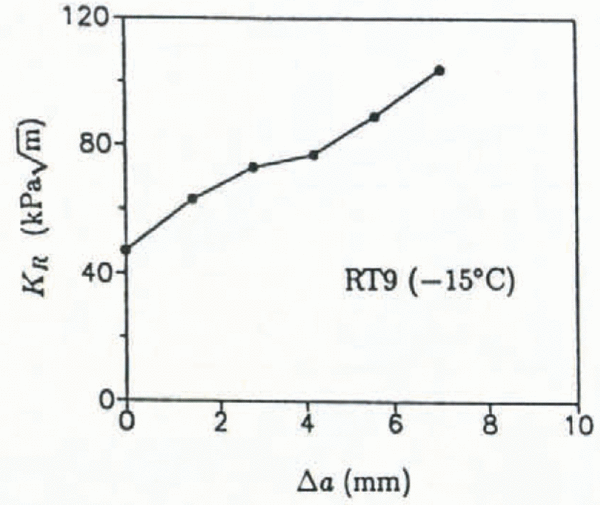
The fracture behavior of saline ice at −15°C was conspicuously different from the colder ice. Figure 12 shows P-δ2 plots for specimens RT8 and RT9. The plots are clearly non-linear, although for each specimen the jags in the plots coincide with small crack jumps; the large load drop in RT9 represents a large unstable crack jump which was preceded by at least five short crack jumps which total 7 mm in length (approximately one-half the average grain-size). This crack growth, which occurred over approximately 75 s, was through thickness and was slow enough to be observed visually. Figure 13 shows KR for this specimen calculated assuming each crack jump was of equal length (1.4 mm). The fracture resistance increases for increasing crack growth; at Δa = 7 mm, however, the crack extended unstably. Interestingly, the stable crack growth initiated at an apparent fracture toughness of 47
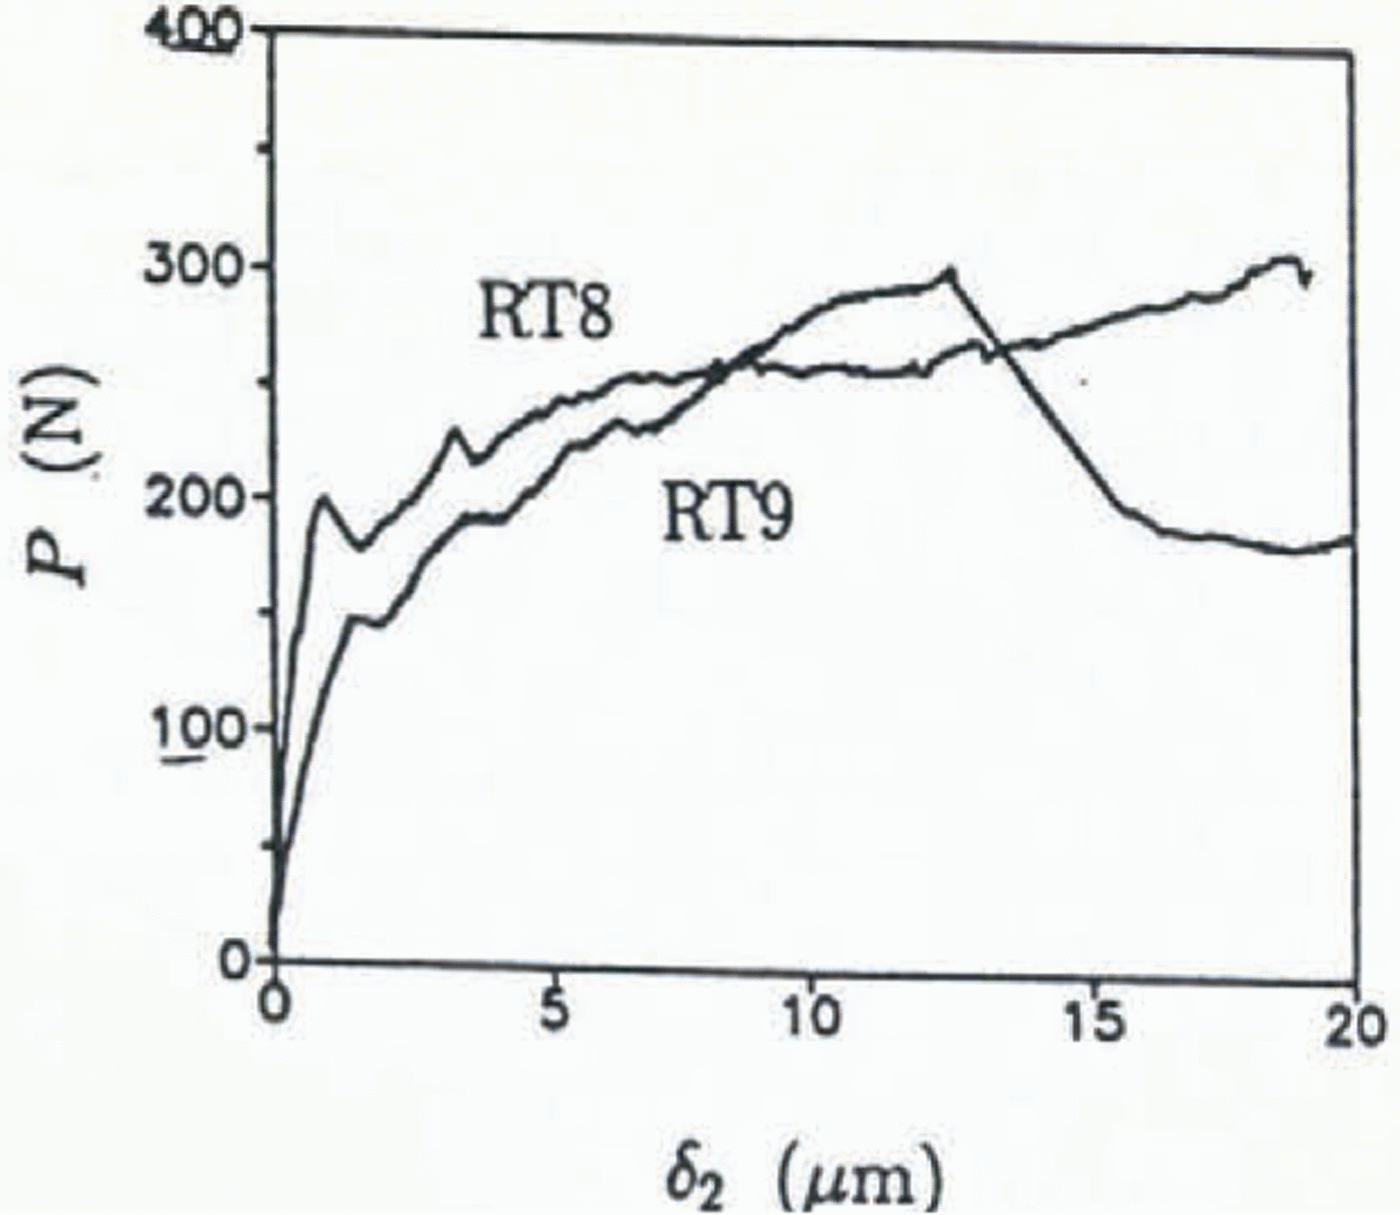
Fig. 12. P vs δ2 at −15° C.
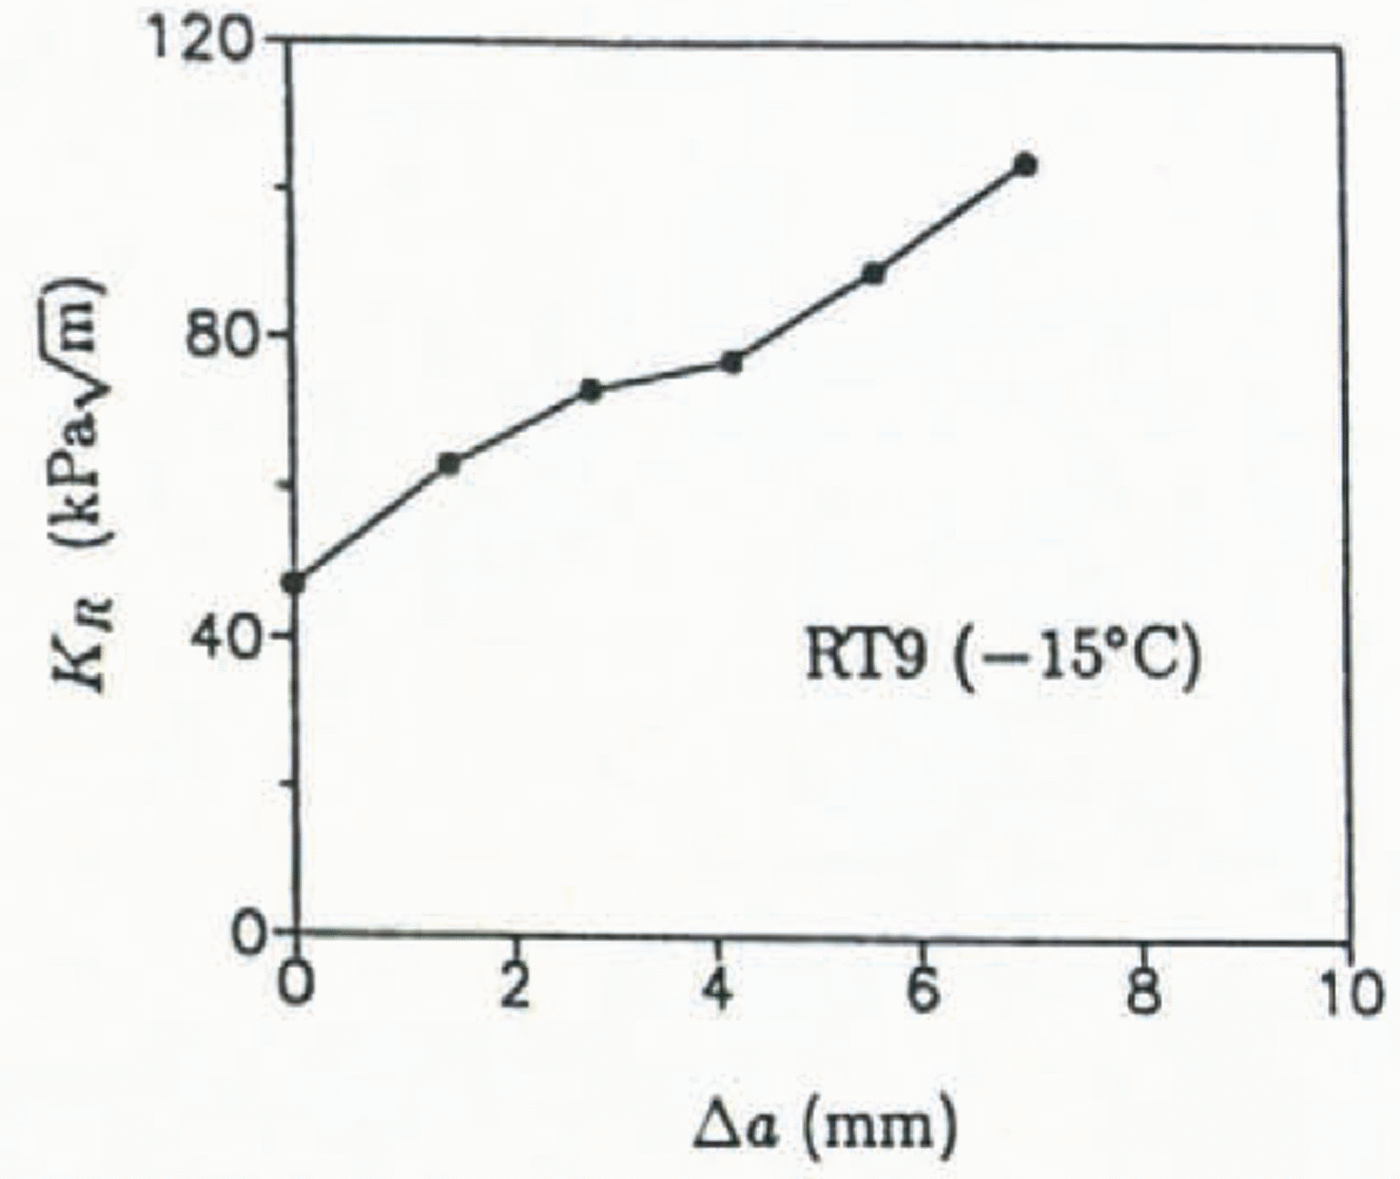
Fig. 13. KR vs Δa for RT9.
Slow, stable-fracture behavior prior to catastrophic fracture and the determination of increasing ñ-curve behavior has never been reported for ice. Reference Parsons, Snellen, Muggeridge, Saeki and HirayamaParsons and others (1988, Reference Parsons, Snellen, Muggeridge, Saeki and Hirayama1989) did not report any stable crack growth for sea ice, although test temperatures in those studies ranged from −25° to −16°C. A possible explanation for the lack of observed stable cracking in studies by Parsons and co-workers and Reference StehnStehn (1990, Reference Stehn1991) may be that the low salinity of the sea ice tested in both studies precluded stable cracking.
Microstructural Influences
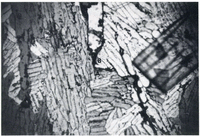
Figure 14 shows a thin section of the crack tip in RT12 (−15°C) photographed through cross-polarizers at x62 with an Olympus BH-2 microscope. Several interesting features are revealed in this photograph: despite the presence of brine pockets and a grain boundary aligned with the crack, the crack propagated along a grain boundary oriented approximately perpendicular to the original crack plane (labeled A in Figure 14). Most likely, damage sustained at the grain junction during scribing of the crack tip caused the resulting fracture. Furthermore, a large pore may have existed at this location, forcing the scribed crack to extend along the grain boundary. Only a pre-test thin section of the near-tip area (which was not done) would confirm this possibility. Additionally, a crack (B in Figure 14), which was probably generated during scribing of the main crack, did not propagate, indicating a larger damage structure must have existed on the actual fracture plane. Figure 15 shows a lower-magnification photograph (×5) of the same area; fracture in this specimen was predominantly intergranular (grain boundary). This does not agree with the findings for experiments performed using three-point bend specimens of similar ice at −25°C (Reference DeFranco and DempseyDeFranco and others, 1991). In that paper, the crack path tended to follow the sub-grain pore arrangement (i.e. along the basal planes), in some instances changing direction suddenly in order to propagate along the basal direction. In Figures 14 and Figures 15, the tensile opening loads were applied in the direction shown by the arrows at the top of the photographs.
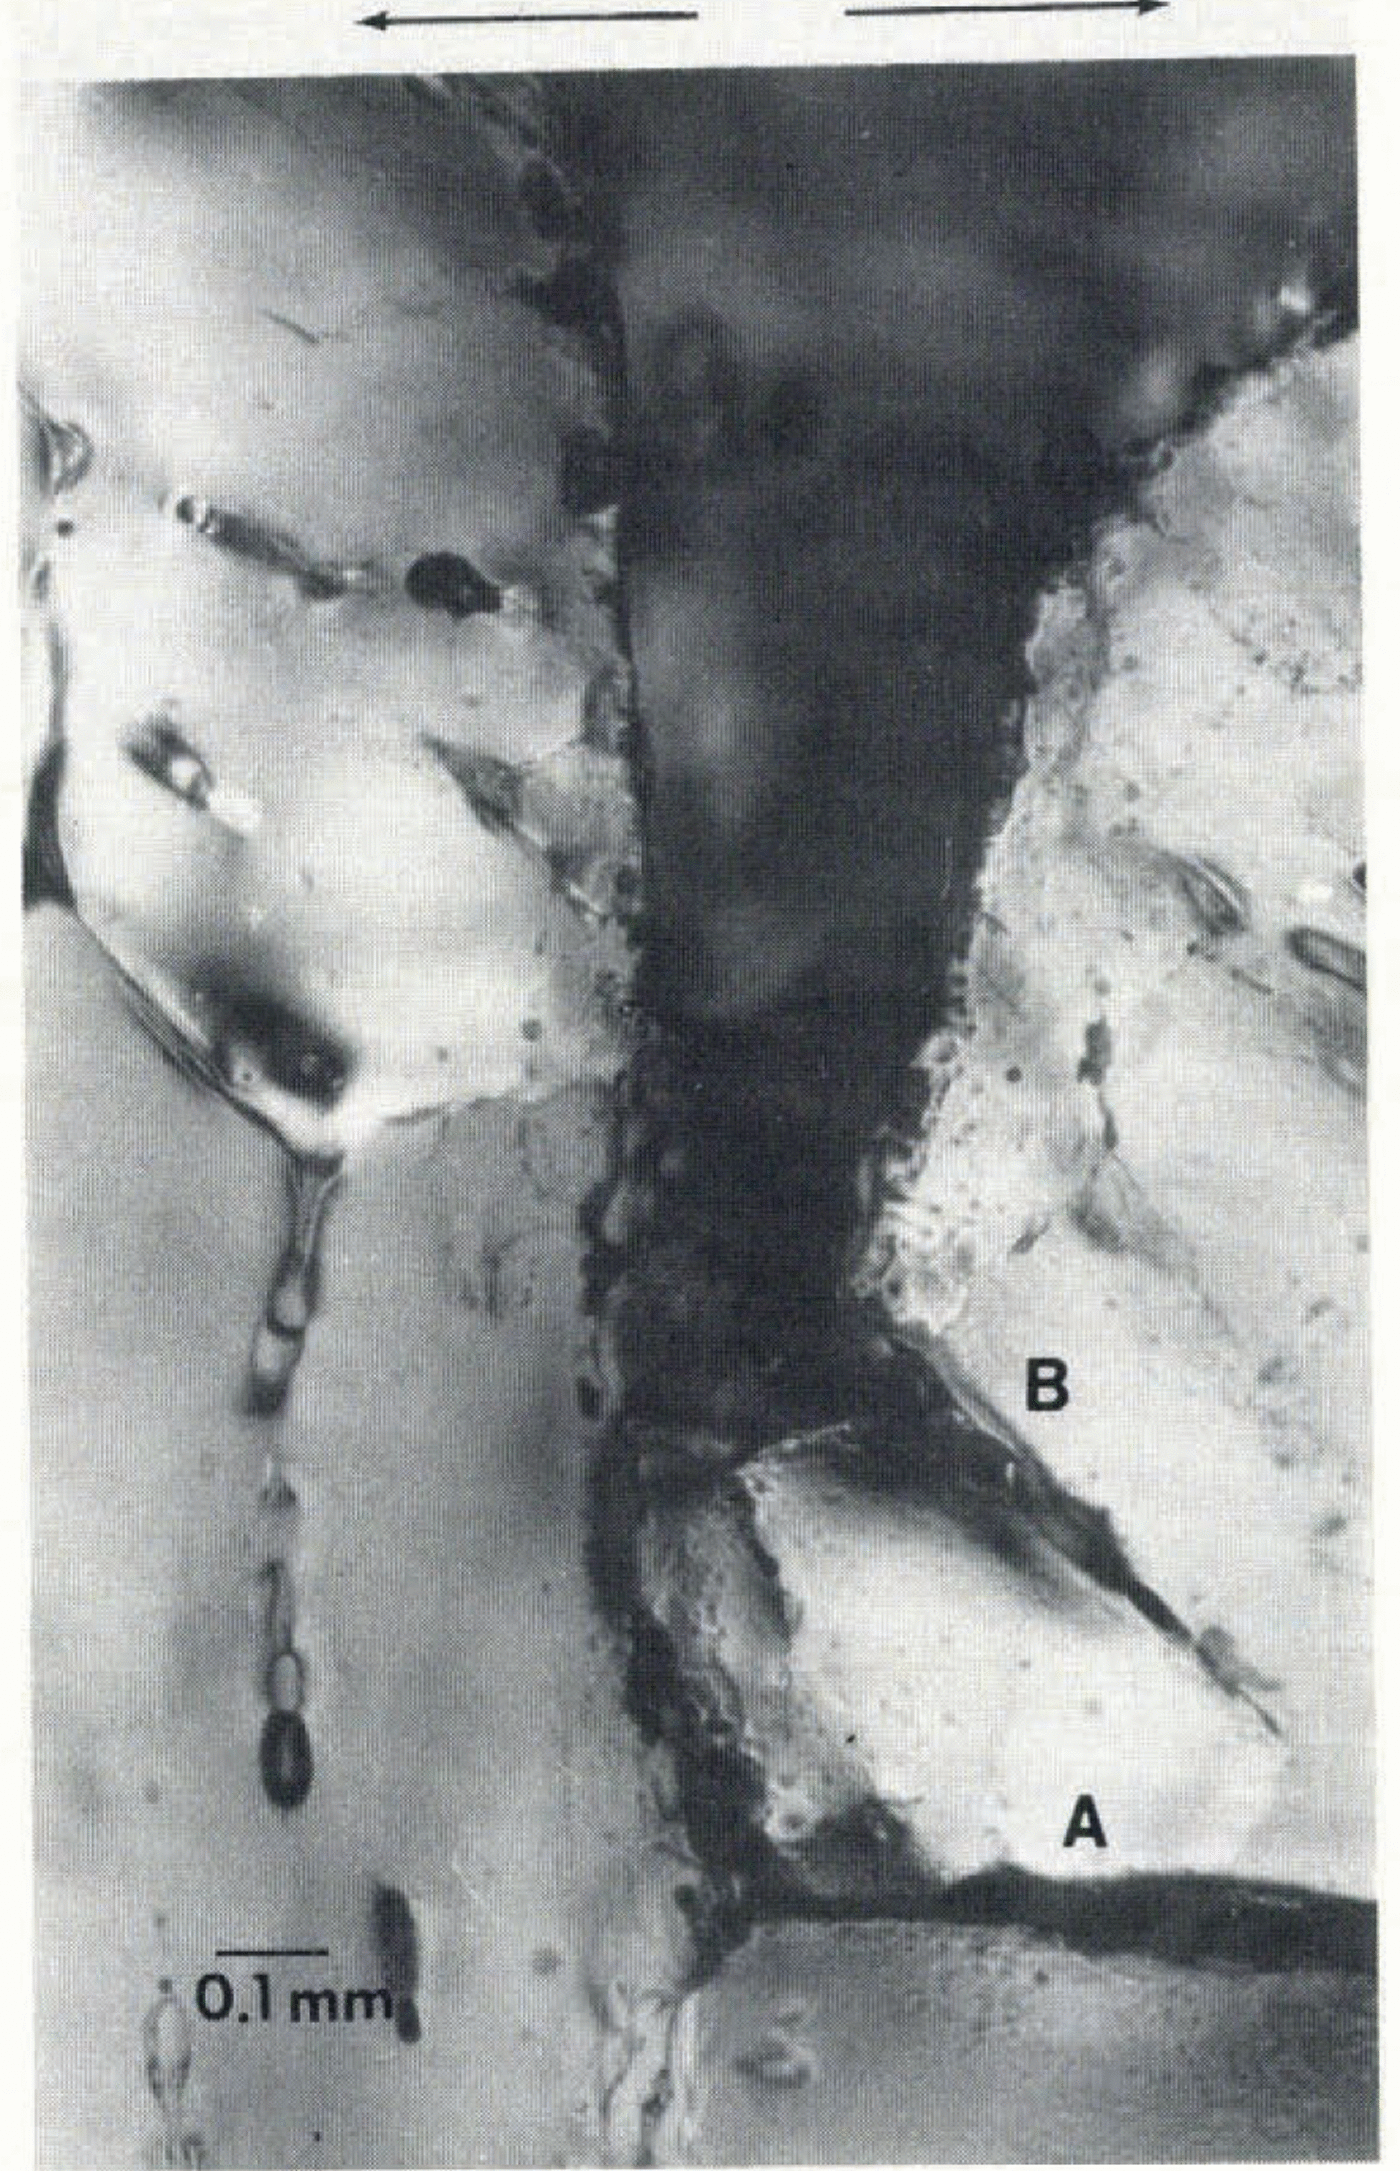
Fig. 14. Crack-tip region in specimen RT9 at 62 times magnification.
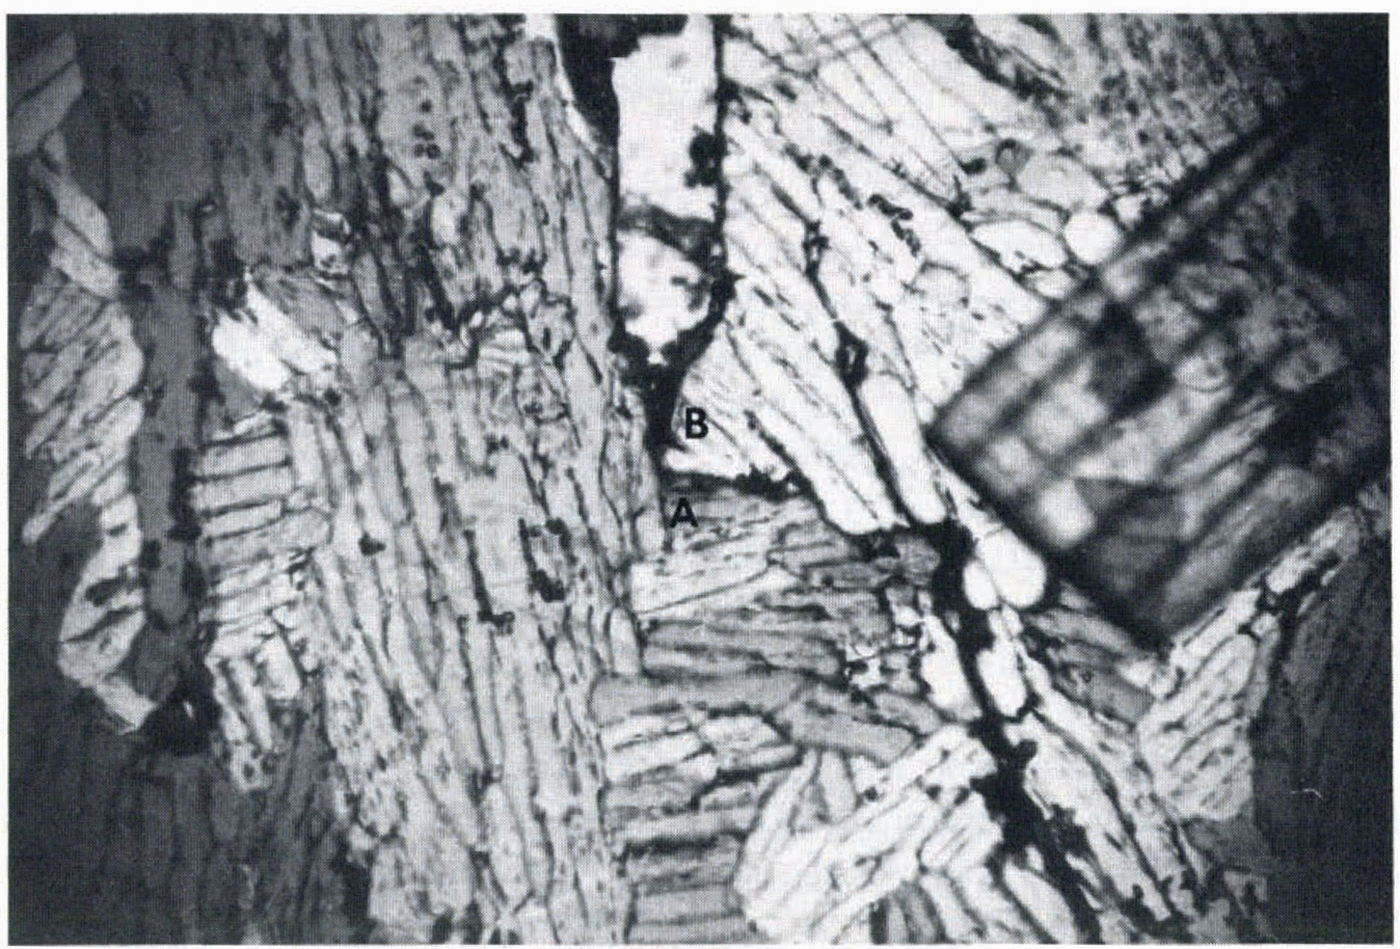
Fig. 15. Crack-tip region in specimen RT9 at 5 times magnification (scale gradations are 1 mm).
The discussion in this paper is based upon the stability Equation (1); the polycrystalline ice is seen from a macroscopic point of view as an equivalent homogeneous medium. As revealed by the above discussion, the actual fracture mechanisms are dramatically influenced by temperature and the microstructure in the vicinity of the crack tip. Given the restrictions imposed on the specimen sizes that can be tested in the laboratory, crack length vs grain-size or some such characteristic length is an important issue. This issue has been addressed by the authors in previous papers (Reference DeFranco, Y and DempseyDempsey, 1991; Reference Dempsey, Bentley and SodhiDempsey and others, 1991, Reference Dempsey, Wei, DeFranco, Ruben and Frachetti1992) in the context of notch sensitivity and polycrystallinity vs single-cum-multiple specimen sizes. The stability issues are, of course, inextricably intertwined with the issues of notch sensitivity, brittleness and polycrystallinity.
Conclusions
A new fracture geometry, the reverse-tapered crack-line wedge load (RT-CLWL) was developed and utilized to produce stable crack growth in saline ice.
RT-CLWL fracture experiments on saline ice at −25°C showed brittle “stick-slip” fracture behavior. The fracture resistance for each “stick-slip” crack event was found to decrease during crack propagation to a crack-arrest value lower than that needed for crack re-initiation. The fracture resistance for crack reinitiation was found to be much higher than the previous crack-arrest value. Comparison of the re-initiation fracture-resistance values with crack growth indicates a globally positive KR curve.
Subsequent experiments on saline ice at −15°C exhibited more ductile behavior. In these tests, load displacement plots exhibited a greater degree of nonlinear behavior throughout the fracture experiment. Slow crack growth was observed up to a critical load which coincided with a long unstable crack jump. During the stable cracking, the fracture resistance increased nonlinearly with crack growth.
The positive KR VS Δa behavior found for both cold and warm saline ice indicates that stable cracking should readily occur in warm sea ice, while for cold sea ice “stick-slip” cracking will occur provided that conditions conducive to stable cracking are maintained.
Acknowledgements
This work was supported in part by the U.S. Office of Naval Research under grant N00014-90-J-1360, in part by the U.S. National Science Foundation under grants MSM-86-18798 and MSS-90-079291, and in part by the Mobil Research and Development Corporation.
The authors thank Mr P.J. Parker and Mr R.J. Cary for their assistance in developing the RT-CLWL fracture geometry and in performing the experiments. Mr Parker and Mr Cary were supported by the U.S. National Science Foundation’s Research Experience for Undergraduates Program under grant MSM-86-18798. The authors also thank Dr B. L. Parsons, Institute for Marine Dynamics, St. John’s, Newfoundland, for his helpful comments concerning this paper.


