


1 Introduction
When a more viscous fluid is displaced by a less viscous fluid in a porous medium in immiscible or fully miscible fluid systems, it leads to the occurrence of Saffman–Taylor instability, resulting in the formation of finger-like interfacial patterns called viscous fingering (VF) (Homsy Reference Homsy1987). The nonlinear dynamics of classical VF is accepted to be governed by different mechanisms of shielding, spreading and splitting. Multiple fingers are initially formed owing to Saffman–Taylor instability, in which a finger slightly ahead of its neighbouring fingers shields them from further growth as a result of higher pressure gradient in the advancing finger, which grows further while spreading owing to interfacial tension. Tip splitting occurs when a finger reaches a certain width beyond a critical capillary number in an immiscible system, or a critical Péclet number in a miscible system (Homsy Reference Homsy1987). Various VF patterns can be formed, depending on the physicochemical properties of the fluids. Non-Newtonian properties induce branched fractal patterns (Nittmann, Daccord & Stanley Reference Nittmann, Daccord and Stanley1985) and fracturing patterns (Lemaire et al. Reference Lemaire, Levitz, Daccord and Van Damme1991). Changes in interfacial tension, viscosity, viscoelasticity and permeability due to chemical reactions between the two fluids often create spiral, bending and filament-like fingering patterns (Fernandez & Homsy Reference Fernandez and Homsy2003; Nagatsu et al. Reference Nagatsu, Matsuda, Kato and Tada2007, Reference Nagatsu, Hayashi, Ban, Kato and Tada2008a,Reference Nagatsu, Bae, Kato and Tadab; Haudin et al. Reference Haudin, Cartwright, Brau and De Wit2014) in experiments.
There is a quantitative difference between the fingering patterns in immiscible and fully miscible systems. The fingers in immiscible systems are significantly wider than those in fully miscible systems because interfacial tension stabilizes the fingering pattern (Chen Reference Chen1989). Generally, fully miscible systems were considered not to comprise any interfacial tension (Paterson Reference Paterson1985). However, recent works have proved the existence of transient-effective interfacial tension in fully miscible systems. Several previous numerical studies have predicted the stabilizing effects of effective interfacial tension on fully miscible fingering dynamics (Chen, Wang & Meiburg Reference Chen, Wang and Meiburg2001; Pramanik & Mishra Reference Pramanik and Mishra2013, Reference Pramanik and Mishra2015). Truzzolillo et al. (Reference Truzzolillo, Mora, Dupas and Cipelletti2014, Reference Truzzolillo, Mora, Dupas and Cipelletti2016) experimentally investigated the effects of effective interfacial tension on the fingering patterns in two fully miscible fluids, a colloidal suspension and its own solvent. They rationally demonstrated that effective interfacial tension could stabilize the interfacial instability in fully miscible systems, as in immiscible systems. Very recently, several numerical studies have pointed out the importance of understanding the VF dynamics in partially miscible systems (Amooie, Soltanian & Moortgat Reference Amooie, Soltanian and Moortgat2017; Fu, Cueto-Felgueroso & Juanes Reference Fu, Cueto-Felgueroso and Juanes2017) mainly based on geological applications. However, the dynamics in partially miscible systems have not been largely understood so far. Especially, experimental approach on this issue is lacking.
In this study, we have succeeded in experimentally changing the solution system from immiscible to fully miscible or partially miscible by varying the concentrations of the components in an aqueous two-phase system (ATPS) while leaving the viscosities relatively unchanged at room temperature and atmospheric pressure. We have conducted VF experiments in a Hele-Shaw cell by using the ATPS. We have found anomalous VF dynamics giving rise to the spontaneously moving droplets, which has not been seen in classical immiscible or fully miscible systems. It is shown that such dynamics is observed due to the phase separation of spinodal type in the above ATPS (Ban, Aoyama & Matasumoto Reference Ban, Aoyama and Matasumoto2010; Ban et al. Reference Ban, Yamada, Aoyama, Takagi and Okano2012), which refers to the spontaneous phase separation of a mixture into coexisting phases induced by thermodynamic instability where the second derivative of the free energy with respect to composition is negative in binary mixture (Mauri, Shinnar & Triantafyllou Reference Mauri, Shinnar and Triantafyllou1996). The partially miscible system in our study undergoes phase separation when the system is transferred into the spinodal region through direct contact between the more viscous and the less viscous solutions instead of quenching since phase separation is limited to the mixing region. Thereby, throughout the paper the term ‘phase separation’ is used intermittently for the spinodal decomposition type of thermodynamic instability. Experimental results are compared with the theoretical findings with a viewpoint of coupling between hydrodynamics and chemical thermodynamics.
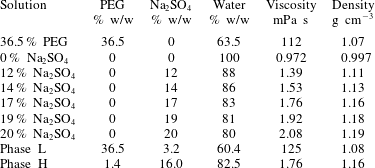
Table 1. The viscosity and density of the solutions at  $25\,^{\circ }\text{C}$ with different % w/w used in the experiment.
2 Solution systems and experimental set-up
The experiment is conducted using a radial Hele-Shaw cell, which consists of two parallel glass plates ( $140\times 140~\text{mm}^{2}$) with a thin (0.3 mm) gap. An ATPS consisting of poly(ethylene) glycol (PEG) (weight-average molecular weight, $Mw=$ 8000), sodium sulphate ( $\text{Na}_{2}\text{SO}_{4}$) salt and deionized water is used (see table 1) (Ban et al. Reference Ban, Yamada, Aoyama, Takagi and Okano2012). Three types of experiments are performed with immiscible, fully miscible and partially miscible fluids. In the immiscible experiment, the less viscous liquid of phase H displaces the more viscous liquid of phase L. The deionized water displacing the more viscous solution of $36.5\,\%$ PEG corresponds to the fully miscible fluids. However, in other experiments, more viscous solution of $36.5\,\%$ PEG displaced by the less viscous solution composed of different % w/w of salt ( $C_{s}$) are considered. At the interfacial region, the concentration of the solutions can become $18.25\,\%$ PEG and half of the % w/w of salt and can fall into either region I (single phase) or region II (two phases) of the phase diagram of figure 1 (Snyder, Cole & Sziag Reference Snyder, Cole and Sziag1992). When the interface of the two solutions is in region II, it goes under the phase separation with salt-rich and PEG-rich phases, which is called partially miscible fluid zone. For instance, when $\text{PEG}=36.5\,\%$ and $C_{s}=0\,\%$ (deionized water, ♢ in figure 1a), the concentration in the interfacial region becomes 18.25 % PEG and 0 % salt ( $\star$ in figure 1a), which lies in one phase region and the system becomes fully miscible. In contrast, when $C_{s}=20\,\%$, the concentration in the interfacial region becomes $18.25\,\%$ PEG and $10\,\%$ salt ( $\unicode[STIX]{x2B20}$ in figure 1a), which is in region II and the system would take phase separation with salt and PEG-rich solutions due to spinodal decomposition. Therefore, the system is called partially miscible because the system is in the thermodynamically unstable zone. When a solution consisting of 13 % $\text{Na}_{2}\text{SO}_{4}$ and $10\,\%$ PEG is prepared ( $\triangle$ in figure 1), the solution eventually separates into two immiscible phases as PEG-rich L and salt-rich H (see figure 1a). Hence, it is observed that the ATPS can be moderated from immiscible to fully miscible or partially miscible by changing the concentrations using the ATPS at $25\,^{\circ }\text{C}$ and atmospheric pressure by maintaining the viscosities of more and less viscous fluids quite similar.
Here, it should be emphasized that we confirm the solutions are Newtonian by performing bulk shear viscosity measurements (see figure 2) using a rheometer (AR-G2 TA instruments) of all the solutions considered in our analysis. It clearly shows that the viscosity remains constant with the variation of shear rate, and the first normal stress difference, one of viscoelastic properties, is not detected for all the solutions given in table 1. These measurements signify the solutions are Newtonian although PEG has high molecular weight. In all the experiments, the more viscous liquid is dyed blue using indigo carmine to visualize the displacement patterns and we found that indigo carmine is insoluble in the  $\text{Na}_{2}\text{SO}_{4}$ solution because of the salting-out effect.
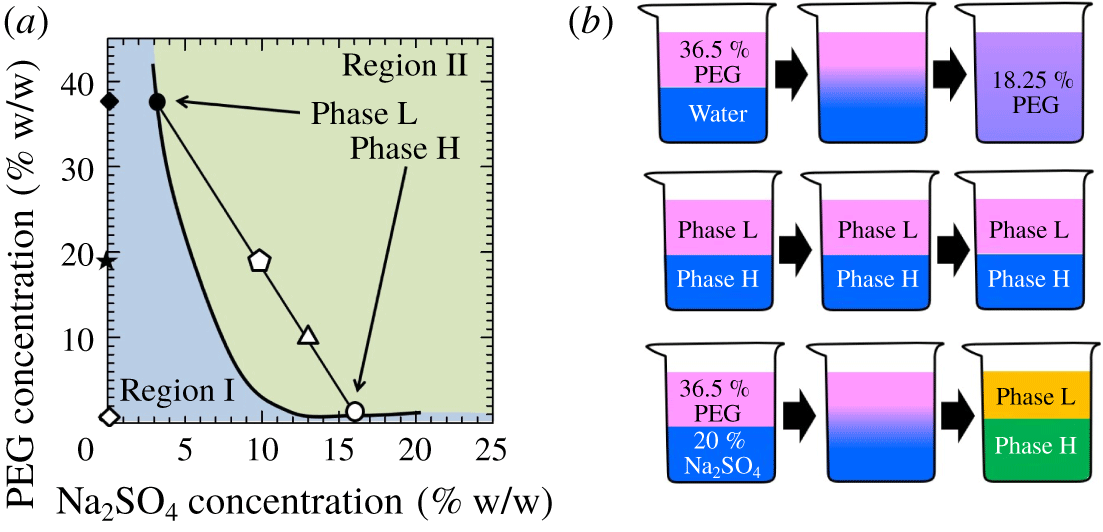
Figure 1. (a) Phase diagram of PEG 8000 –  $\text{Na}_{2}\text{SO}_{4}$ – water system (Snyder et al. Reference Snyder, Cole and Sziag1992). (b) The schematics of the fully miscible, immiscible and partially miscible interfaces are indicated in the top, middle and below panels, respectively.

Figure 2. Shear viscosity measurement for different solutions.
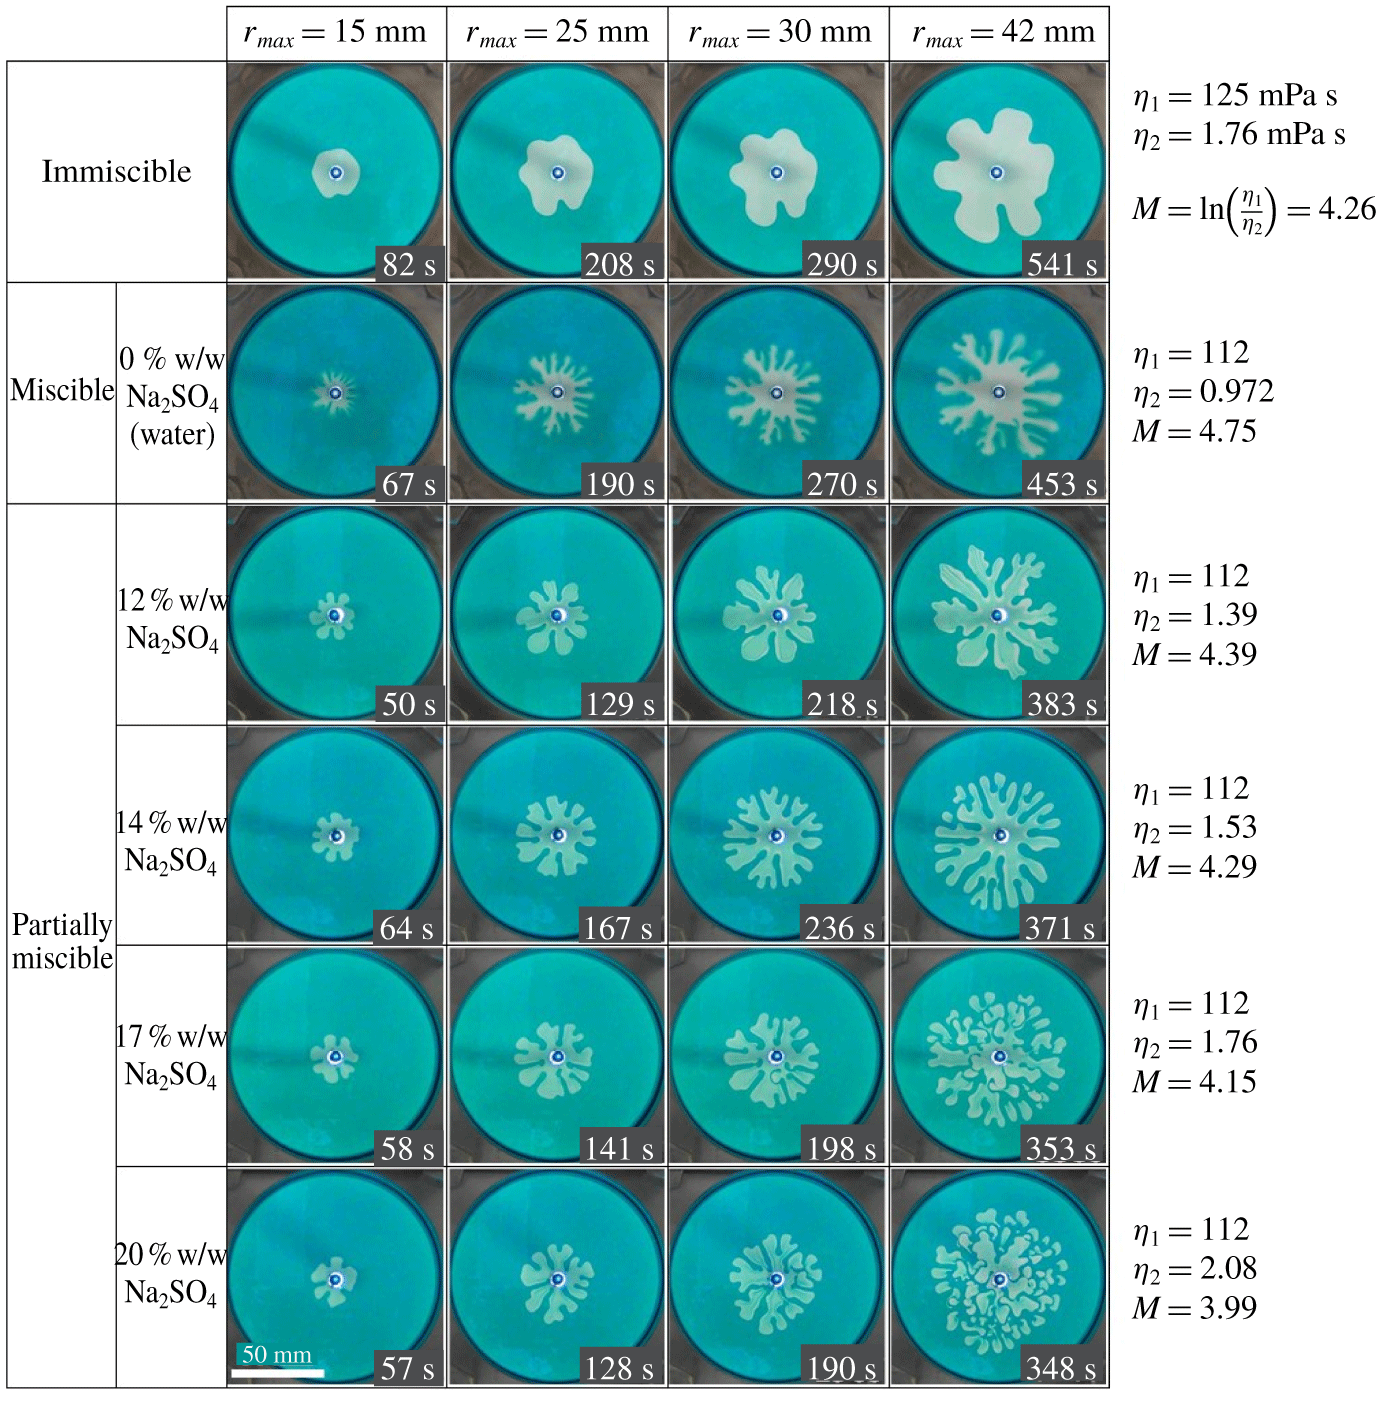
Figure 3. Displacement patterns with immiscible (phases L displaced by phase H in first row panel), fully miscible (second row panel with 0 % w/w  $\text{Na}_{2}\text{SO}_{4}$) and other below panels are with 12, 14, 17, 20 % w/w of $\text{Na}_{2}\text{SO}_{4}$ for a fixed flow rate $q=1.9\times 10^{-9}~\text{m}^{3}~\text{s}^{-1}$. The patterns are shown at a different radius $r_{max}$ in which the longest finger reached the radius and the injection time is shown in the lower right corner. The viscosity of the different solutions along with their log-mobility ratio is given in the right side of each panel, in which the viscosity $\unicode[STIX]{x1D702}_{1}$ corresponds to the more viscous solution which is displaced by the less viscous solution with viscosity $\unicode[STIX]{x1D702}_{2}$.
3 Experimental results and discussions
3.1 Viscous fingering dynamics
Figure 3 shows the evolution of viscous fingering dynamics for the immiscible, fully miscible and partially miscible systems (with  $C_{s}=12,14,17$, and 20 %) for a fixed flow rate $q=1.9\times 10^{-9}~\text{m}^{3}~\text{s}^{-1}$. Classical VF behaviour for the immiscible and fully miscible systems is observed and wider fingers are obtained in the immiscible than in the fully miscible case because of higher interfacial tension in the former. Surprisingly, in the partially miscible systems, we observe a multiple droplet formation pattern for $C_{s}=14$, 17 and 20 % (see supplementary movie file, available at https://doi.org/10.1017/jfm.2020.406). As shown in figure 3, before multiple droplets form, the interfacial distortion develops enough to allow the occurrence of the classical VF instabilities, such as spreading, shielding and splitting. Subsequently, the base of developed fingers pinches-off, which is clearly observed from figure 4 which depicts the process of a droplet formation through a time evolution of plots in a specific 20 % w/w salt solution. For example, at $t=117~\text{s}$, classical viscous fingering phenomena like tip-splitting and shielding properties are seen and subsequently the shielded finger base becomes thinner (at $t=181~\text{s}$) and the droplet comes from the pinched-off finger at $t=199~\text{s}$ (see the pinched-off process with the arrow marked finger in figure 4). Eventually, multiple droplets detach from the mother viscous fingers. The detached droplets move anisotropically, and lead to a cascade of splitting (see figure 3 for corresponding 17 and 20 % salt solution at $r_{max}=42~\text{mm}$). From these observations, we claim that the secondary instability takes place as topological changes, leading to the formation of multiple droplets from the viscous fingers developed by Saffman–Taylor instability. Notably, although the steady value of interfacial tension between the PEG solution and the 17 % $\text{Na}_{2}\text{SO}_{4}$ solution is almost the same as that in the immiscible system, as described in § 3.2, and both systems have the same viscosity ratio, the fingering patterns in the two systems are remarkably different. We observe that the length scale of droplet instability, such as droplet size, decreases with the increase in $C_{s}$ (see the last column panel of figure 3, with $C_{s}=14$, 17, 20 %). In order to confirm this decreasing of the droplet size, we measured the average radius of the droplets as $R_{d,42}=\sum _{n=1}^{N}\hat{R}_{d,42,n}/N$ when $r_{max}=42~\text{mm}$ for different salt solutions 17, 18, 19, 20 % (see figure 5), where $\hat{R}_{d,42,n}=\sqrt{A_{d,42,n}/\unicode[STIX]{x03C0}}$, index $n$ corresponds to a specific droplet number, $N$ is the total number of droplets, $A_{d,42,n}$ is the area of the droplet $n$ corresponding to $r_{max}=42~\text{mm}$. It is clearly found that the $R_{d,42}$ decreases with the increasing of $C_{s}$. We measured this for the $C_{s}>17\,\%$ as more droplets are formed in such ATPS. Interestingly, VF with no droplets is observed for $C_{s}=12\,\%$, while for $C_{s}>13\,\%$, multiple droplets begin to form. This occurs with the evidence that at the interfacial region for the $C_{s}=12\,\%$ case, the solution is near the boundary curve of two different phases (18.25 % PEG with $6\,\%$ salt) of figure 1. Hence, each salt solution with $C_{s}<13\,\%$ will be in the one-phase system and $C_{s}>13\,\%$ lies in the two-phase system giving rise to the droplet formation. It is to be noted that the viscosities of the solutions in the experiments are considered carefully in such manner that the log-mobility ratio, $M$, in all the cases remains close to each other.
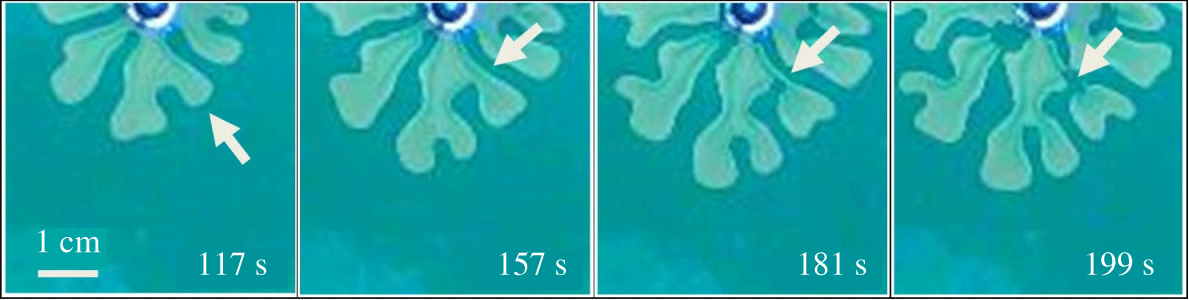
Figure 4. Temporal evolution of a finger with arrow marked to depict the pinched-off process, for  $C_{s}=20\,\%$ and $q=1.9\times 10^{-9}~\text{m}^{3}~\text{s}^{-1}$.
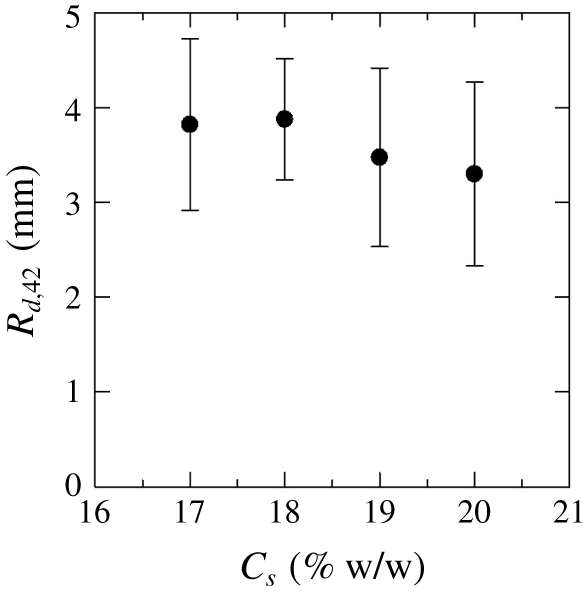
Figure 5. Average radius of the droplets  $R_{d,42}$ for different concentration of salt solutions $C_{s}$, which is measured corresponding to the $r_{max}=42~\text{mm}$, i.e. last column of figure 3.
3.2 Hydrodynamic properties at fluid–fluid interface

Figure 6. (a) Effective interfacial tension measurement versus time in a spinning drop tensiometer. (b) The phase separation rate constant  $k$ versus salt concentration $C_{s}$. The error bars represent the average and standard deviation for three experiments.
In order to understand the underlying hydrodynamic properties for the formation of droplet dynamics in the partially miscible system and to compare them with the immiscible and fully miscible interface patterns shown in figure 3, we first measured the temporal change in effective interfacial tension,  $\unicode[STIX]{x1D6FE}$, between 36.5 % PEG solution with different $C_{s}$ of $\text{Na}_{2}\text{SO}_{4}$ solutions. For measuring $\unicode[STIX]{x1D6FE}$, a spinning drop tensiometer (SITE 100, Krüss, Germany) is used at $25\,^{\circ }\text{C}$ with the rotation rate of the capillary of 6000 r.p.m. by following Pojman et al. (Reference Pojman, Whitmore, Liveri, Lombardo, Marszalek, Parker and Zoltowski2006), and $\unicode[STIX]{x1D6FE}$ is determined based on the shape, reflecting the balance between the interfacial and rotational energies. In the measurement, the PEG-rich solutions were dyed by indigo carmine in the same way as those in the VF experiment. In the immiscible system with the equilibrium compositions, as expected, $\unicode[STIX]{x1D6FE}$ remained constant with time as shown in figure 6(a). The depicted temporal evolution of $\unicode[STIX]{x1D6FE}$ between 36.5 % w/w PEG solution and different salt solutions depending on $C_{s}$ shows that, $\unicode[STIX]{x1D6FE}$ increased with time for $C_{s}>13\,\%$ whereas it remained constant with time for $C_{s}=12\,\%$. From a thermodynamic view, the increase in interfacial tension with time indicates the occurrence of a phase separation of spinodal type and the increase in interfacial energy to generate force (Ban et al. Reference Ban, Kobayashi, Suzuki and Nagatsu2017). The force originating from such phase separation, which is called Korteweg force, tends to minimize the free energy stored in the interface and can generate convection (Vladimirova, Malagoli & Mauri Reference Vladimirova, Malagoli and Mauri1999; Ban et al. Reference Ban, Fukuyama, Makino, Nawa and Nagatsu2016). We claim that the concentration region where $\unicode[STIX]{x1D6FE}$ increases with time corresponds to that where multiple droplet patterns were observed, shown in figure 3. Here, it is emphasized that such phase separation and Korteweg force play a crucial role in inducing such secondary instability of droplet formation. To consider an indicator of the rate of phase separation, we calculated the rate constant, $k$, from the time evolution of $\unicode[STIX]{x1D6FE}$. The $k$ under the condition of $C_{s}\geqslant 13\,\%$ was calculated by fitting the equation, $\unicode[STIX]{x1D6FE}=(\unicode[STIX]{x1D6FE}_{0}-\unicode[STIX]{x1D6FE}_{\infty })\text{e}^{-kt}+\unicode[STIX]{x1D6FE}_{\infty }$, where $\unicode[STIX]{x1D6FE}_{0}$ and $\unicode[STIX]{x1D6FE}_{\infty }$ are the values of interfacial tension at $t=0$ and at a steady state, respectively. The value of $k$ increases with $C_{s}$ (figure 6b). This result indicates that the rate of phase separation increases with $C_{s}$ and it is very much similar to the observation of smaller droplet size with increasing $C_{s}$ given in figure 5, which is important in understanding the anomalous VF dynamics in the partially miscible system, and further discussed in the next section.
3.3 Measurement of area density and self-propulsion droplets dynamics
Further, to uphold the existence of spinodal type phase separation with the salt concentration that falls in the two-phase zone of figure 1, we measured the temporal change in the area of the less-viscous salt-rich phase in both the immiscible and partially miscible systems during displacement. We consider only two salt concentrations,  $C_{s}=17$ and 20 % solution cases, and depict the evolution of area in figure 7(a), by using an image analysis software, ImageJ, to examine whether the phase separation occurred in the experiments or not. It is observed that the area of the injected salt-rich phase in the immiscible system is almost equal to the calculated area from the injection rate. However, the area in the partially miscible systems ( $C_{s}=17$ and $20$ % solutions) is larger than the areas of the injected salt-rich phase of the L-H system. The area difference clearly became pronounced over time (after 100 s). We also verify that, when the mixture of PEG and salt solutions (with their respective concentrations) of equal volumes undergoes phase separation, the resulting volume of salt-rich phase becomes larger than the corresponding PEG-rich phase; this occurs as per the described phase diagram of figure 1. These results indicate the proof of the occurrence of phase separation in the partially miscible system during the displacement. In order to justify this, we have repeated the VF experiments for $C_{s}=17$ and 20 % to find better statistics and calculated the temporal change of $\triangle A=A_{pm}-A_{im}$, where $A_{pm}$ and $A_{im}$ are the areas of the partially miscible ( $C_{s}=17\,\%$ and $20\,\%$) and immiscible systems, respectively. Further we have made the curve fitting using a least squares method for the averaged value of several experiments (three times for $C_{s}=17\,\%$ and four times for $20\,\%$) and observed that $\triangle A$ increases proportionally to $t^{1.4}$ for 17 % (figure 7b) and $t^{1.7}$ for 20 % (figure 7c). Such a power-law index is found with the coefficient of determination $R^{2}\sim 1$, i.e. for $C_{s}=17\,\%$, $R^{2}=0.9968$ with $t^{1.4}$ and for $C_{s}=20\,\%$, $R^{2}=0.9996$ with $t^{1.7}$. Such a coefficient of determination $R^{2}$ is a statistical measure to explain how well the regression predictions approximate the observed data points (Draper & Smith Reference Draper and Smith1998) and an $R^{2}$ of 1 indicates that the predictions perfectly fit the data. As known in the literature, if diffusion is the only driving force during phase separation, the typical size of a domain length scale increases with time as $t^{1/3}$ (Lifshitz & Slyozov Reference Lifshitz and Slyozov1961), and if convection occurs owing to a balance of interfacial tension with viscous forces, the typical domain length grows linearly with time (Siggia Reference Siggia1979; Poesio, Beretta & Thorsen Reference Poesio, Beretta and Thorsen2009). But, in our case, we have obtained the area differences $\triangle A\propto t^{1.4}$ for $C_{s}=17\,\%$ and $\triangle A\propto t^{1.7}$ for $C_{s}=20\,\%$, which corresponds to the relation of length scale evolution with $t^{0.70}$ for $C_{s}=17\,\%$ and $t^{0.86}$ for $C_{s}=20\,\%$. The value of the index, 0.86, is approximately close to 1 for $C_{s}=20\,\%$, especially. This shows convection dominantly acts during phase separation as per the scaling argument given by Siggia (Reference Siggia1979) and Poesio et al. (Reference Poesio, Beretta and Thorsen2009). However, the smaller value of the exponent as 0.70 for $C_{s}=17\,\%$ is reasonable for the following reason: as the formation of the droplet is less for $C_{s}=17\,\%$ than for $C_{s}=20\,\%$, thus, the rate of phase separation and the effects of the spontaneous convention could be smaller for $C_{s}=17\,\%$ than for $C_{s}=20\,\%$.
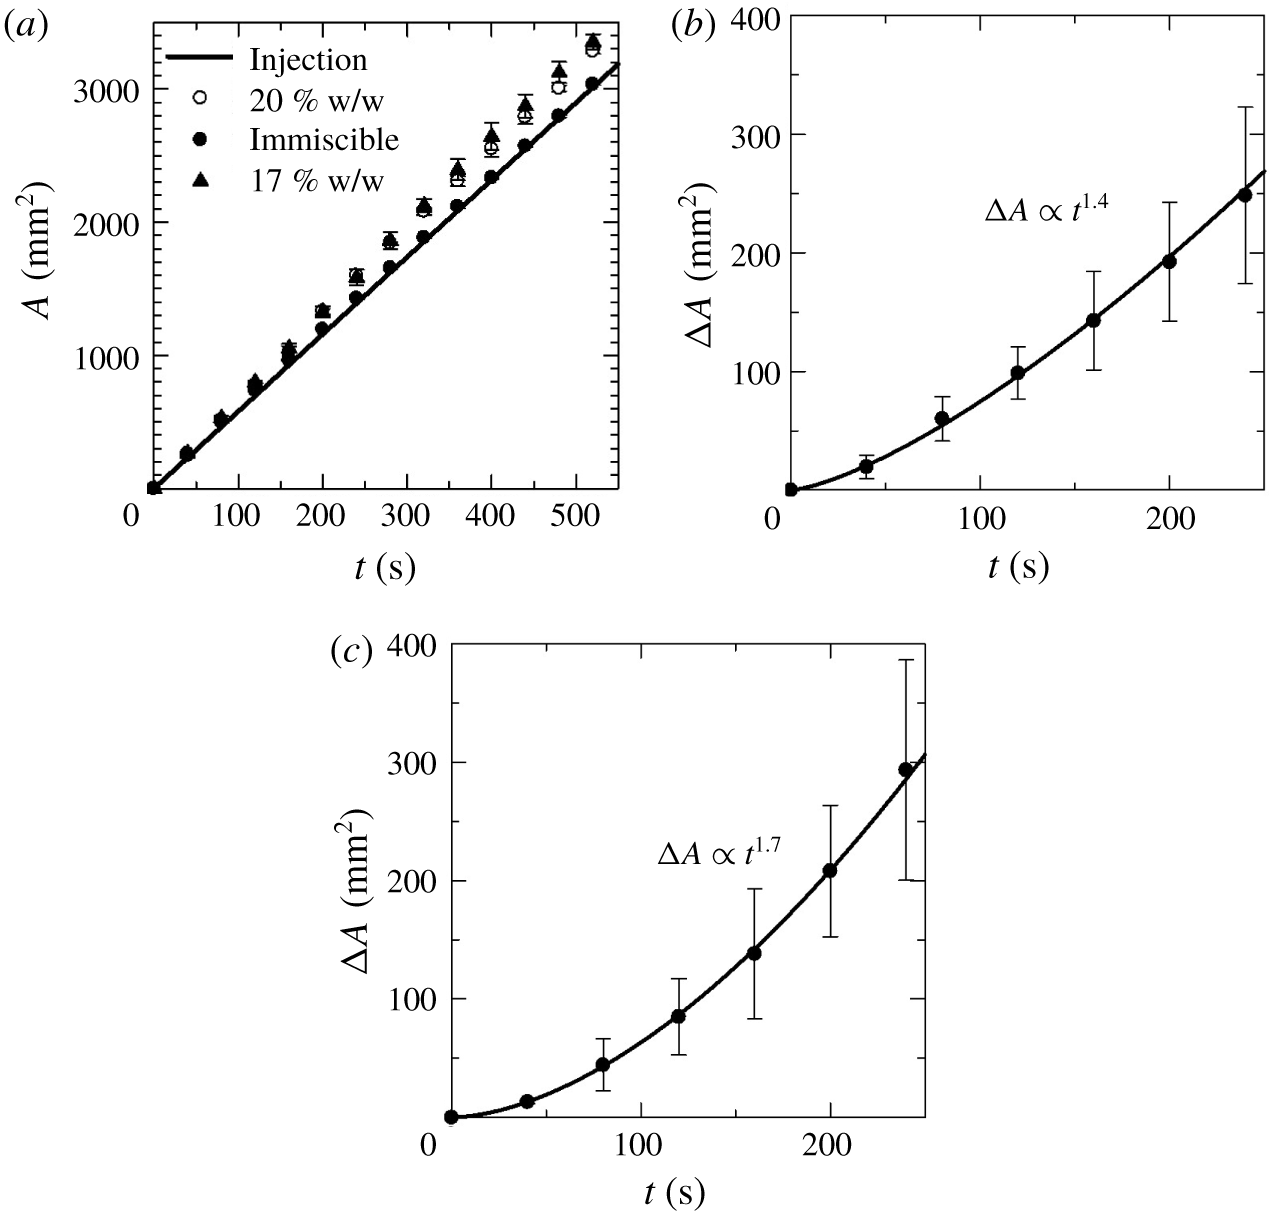
Figure 7. (a) Temporal change in the area of the salt-rich phase in both the immiscible and partially miscible systems during displacement at a flow rate  $1.9\times 10^{-9}~\text{m}^{3}~\text{s}^{-1}$. Temporal evolution of area difference $\triangle A$ between the salt concentrations and immiscible solutions with flow rate $1.9\times 10^{-9}~\text{m}^{3}~\text{s}^{-1},$ and least square curve fitting shows (b) $\triangle A\propto t^{1.4}$ with averaged value of several experiments for $C_{s}=17\,\%$, and (c) $\triangle A\propto t^{1.7}$ for $C_{s}=20\,\%$.
In order to understand further the effects of Korteweg convection due to the phase separation, we performed an experiment of less viscous fluid with salt solution  $C_{s}=19\,\%$ displacing the more viscous fluid of 36.5 % PEG solution in a flow rate $q=9.3\times 10^{-10}~\text{m}^{3}~\text{s}^{-1}$. Just after several droplets formed, we stopped the injection. Interestingly, we observe that the droplets further move spontaneously. We measured the trajectories of several droplets after stopping the injection of the less viscous salt-rich liquid (shown in figure 8a) and calculated their mean squared displacements (shown in figure 8b). Since mean squared displacement (MSD) is powerful in distinguishing the dynamics of a moving object (Howse et al. Reference Howse, Jones, Ryan, Gough, Vafabakhsh and Golestanian2007), we quantified the self-propelling dynamics through this MSD calculation. It is defined as
 $$\begin{eqnarray}\langle L^{2}\rangle =\frac{1}{N}\mathop{\sum }_{n=1}^{N}\{(x_{n}(t+\unicode[STIX]{x1D70F})-x_{n}(t))^{2}+(y_{n}(t+\unicode[STIX]{x1D70F})-y_{n}(t))^{2}\},\end{eqnarray}$$
 where  $x_{n}$ and $y_{n}$ are $x$- and $y$-coordinates of the position of droplet, $t$ is elapsed time after stopping the injection, $\unicode[STIX]{x1D70F}$ is the interval time and $N$ is the number of samples. Figure 8(b) clearly indicates that such droplets move at a constant speed initially and some droplets have reciprocatory motion; this is due to the oscillatory behaviour of the MSD. These results show that the formed multiple droplets can spontaneously propel even in the absence of fluid injection.
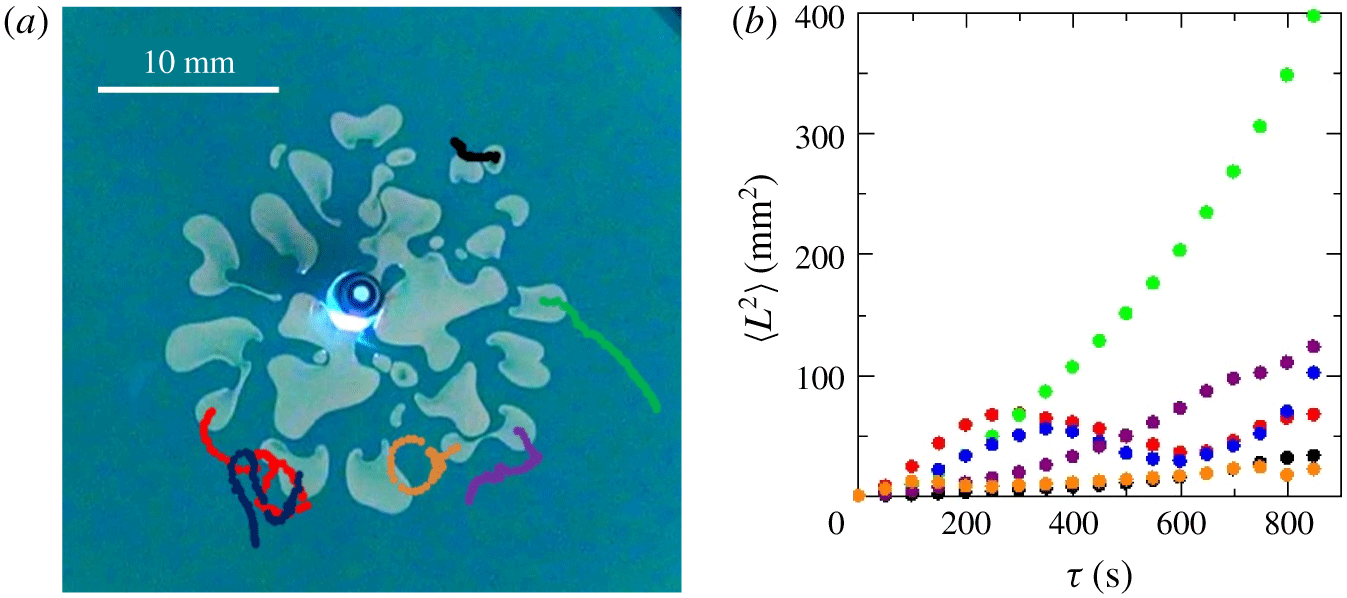
Figure 8. (a) The trajectories of six droplets after stopping the injection for  $C_{s}=19\,\%$ and $q=9.30\times 10^{-10}~\text{m}^{3}~\text{s}^{-1}$; (b) mean squared displacements of the droplets calculated based on the trajectories shown in panel (a). The colours of the dots correspond to those of the curves in the snapshots shown in panel (a).
3.4 Mechanism of the secondary instability
The development of the second instability dynamics can be divided into two stages: formation of the droplets from the developed viscous fingers and self-propulsion of the droplets. The mechanism of droplet formation should be similar to the mechanism proposed by De Wit & Homsy (Reference De Wit and Homsy1999). Their numerical study simulated fully miscible VF with a chemical reaction, the kinetics of which were essentially similar to a kind of phase separation, producing two fluids of low and high concentrations. When concentrations fell in the unstable region, the system spontaneously evolved toward the attracting chemical equilibrium. The convection generated by the variation of viscosity with the concentration enhanced system evolution. Both effects resulted in the pinching of viscous fingers and finally led to the formation of droplets. Our experimental system undergoes thermodynamic instability and phase separation of a spinodal type but without chemical reactions. In contrast to normal diffusion, such phase separation promotes mass transfer against the concentration gradients and enhances concentration fluctuations, leading to the separation of the system to low and high concentration regions. Furthermore, the body force generated by the compositional gradient creates a spontaneous fluid convection, promoting phase separation (Hohenberg & Halperin Reference Hohenberg and Halperin1977; Vladimirova et al. Reference Vladimirova, Malagoli and Mauri1999). Thus, the growth of the deformed region due to hydrodynamic instabilities is enhanced by the thermodynamic instabilities when the salt solution is in contact with the PEG solution in the spinodal region. Eventually, droplets are detached from the deformed region.
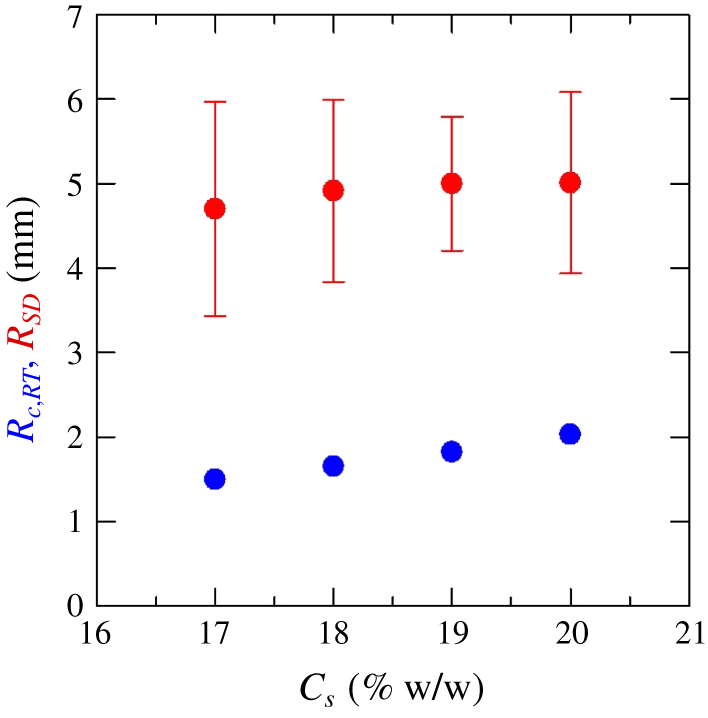
Figure 9. Average radius of the first generation droplets  $R_{SD}$ due to the phase separation by spinodal decomposition comparing with the critical radius of the droplet due to Rayleigh–Taylor instability $R_{c,RT}$ for different concentrations of salt solutions $C_{s}$.
Furthermore, we find whether the droplet formation is attributed to buoyancy effects or Rayleigh–Taylor (RT) instability or not, by comparing the average first droplets formed in our experiment with the calculated critical radius,  $R_{c,RT}$ due to RT instability, given as (Ban, Yamagami & Furumichi Reference Ban, Yamagami and Furumichi2012)
 $$\begin{eqnarray}R_{c,RT}=3.84\sqrt{\frac{\unicode[STIX]{x1D6FE}}{\triangle \unicode[STIX]{x1D70C}g}},\end{eqnarray}$$
 where  $\unicode[STIX]{x1D6FE}$ is an initial interfacial tension, $\triangle \unicode[STIX]{x1D70C}$ is density difference between displacing and displaced solutions and $g$ is the gravitational acceleration $(9.807~\text{m}~\text{s}^{-2})$. The experimentally obtained radius of the droplet $R_{SD}$, which is due to the phase separation, and critical droplet size due to RT instability, $R_{c,RT}$, are plotted in figure 9. The $R_{SD}$ is the average radius of the first generation of the droplets formed in the ATPS of 17, 18, 19, 20 % and defined as $R_{SD}=\sum _{n=1}^{N}\hat{R}_{d,n}/N$, where $\hat{R}_{d,n}=\sqrt{A_{d,n}/\unicode[STIX]{x03C0}}$, $N$ is the total number of such first generation of droplets, $A_{d,n}$ is the area of the droplet $n$. It is observed that the average first detached droplets radius $R_{SD}$ is approximately 5.01 mm for $C_{s}=20\,\%$, which is much larger than the critical radius, $R_{c,RT}$ predicted by RT instability, i.e. 1.99 mm for $C_{s}=20\,\%$. Similarly, larger droplet radius is also observed as compared to the corresponding $R_{c,RT}$ for all other $C_{s}=17,18,19\,\%$ solutions where eventually more droplets are formed. Hence, we confirm that the droplet formation in the partially miscible system is not from the buoyancy effects or the Rayleigh–Taylor instability. Regarding the self-propulsion of the droplets, this is the same as spontaneous motions of a single droplet by the Korteweg effect, which has been reported by several researchers, e.g. Ban et al. (Reference Ban, Yamada, Aoyama, Takagi and Okano2012, Reference Ban, Fukuyama, Makino, Nawa and Nagatsu2016), Molin, Mauri, & Tricoli (Reference Molin, Mauri and Tricoli2007) and Poesio et al. (Reference Poesio, Beretta and Thorsen2009).
To understand further that the considered ATPS (water–PEG–salt) undergoes phase separation, i.e. thermodynamically unstable with a specific composition of salt, the quantitative analysis is performed using the underlying Gibbs free energy per mole  $\triangle G_{m}$ based on the well known Flory–Huggins equation (Sargantanis & Karim Reference Sargantanis and Karim1997),
 $$\begin{eqnarray}\frac{\triangle G_{m}}{RT}=\unicode[STIX]{x1D719}_{w}\ln \unicode[STIX]{x1D719}_{w}+\frac{\unicode[STIX]{x1D719}_{p}}{r_{p}}\ln \unicode[STIX]{x1D719}_{p}+\frac{\unicode[STIX]{x1D719}_{s}}{r_{s}}\ln \unicode[STIX]{x1D719}_{s}+\unicode[STIX]{x1D712}_{pw}\unicode[STIX]{x1D719}_{p}\unicode[STIX]{x1D719}_{w}+\unicode[STIX]{x1D712}_{ps}\unicode[STIX]{x1D719}_{p}\unicode[STIX]{x1D719}_{s}+\unicode[STIX]{x1D712}_{sw}\unicode[STIX]{x1D719}_{s}\unicode[STIX]{x1D719}_{w},\end{eqnarray}$$
 where  $\unicode[STIX]{x1D719}_{i}$, with $i$ as $p,w$ and $s$ (PEG, water and salt, respectively) is the volume fraction and computed segment number $r_{p}=408.1$, $r_{s}=2.9$. The gas constant is $R$ and $T$ is the absolute temperature. The corresponding interaction parameters $\unicode[STIX]{x1D712}_{ij}$ between the $p,w,$ and $s$ are $\unicode[STIX]{x1D712}_{ps},\unicode[STIX]{x1D712}_{sw},\unicode[STIX]{x1D712}_{pw}$ and measurement of such compositional dependent interaction parameters of the ATPS were only obtained experimentally, which was a very challenging task. Recently, Morita (Reference Morita2013) measured $\unicode[STIX]{x1D712}_{ps},\unicode[STIX]{x1D712}_{sw},\unicode[STIX]{x1D712}_{pw}$ successfully based on the cloud-point measurement using a refractometer (ATAGO, RX-7000i) following the procedure explained by Mohsen-Nia, Rasa & Modarress (Reference Mohsen-Nia, Rasa and Modarress2006). Such a measurement is a technique of finding the temperature at which the sample of the mixture gets cloudy and then justifying the phase separation of the mixture compositions. From this cloud-point measurement the linear correlations, between $\unicode[STIX]{x1D712}_{ij}$ and $W_{p}/W_{w}$ (weight fraction of PEG with water), are obtained as $\unicode[STIX]{x1D712}_{pw}=0.670{-}1.01W_{p}/W_{w}$, $\unicode[STIX]{x1D712}_{ps}=5.59{-}16.9W_{p}/W_{w}$, $\unicode[STIX]{x1D712}_{sw}=8.22{-}15.9W_{p}/W_{w}$. Using such $\unicode[STIX]{x1D712}_{ij}$ and calculating the corresponding $\unicode[STIX]{x1D719}_{p},\unicode[STIX]{x1D719}_{w},\unicode[STIX]{x1D719}_{s}$, we found that the $\unicode[STIX]{x2202}^{2}\triangle G_{m}/RT/\unicode[STIX]{x2202}C_{s}^{2}=-6.17\times 10^{-5},-7.47\times 10^{-5},-9.14\times 10^{-5},-10.2\times 10^{-5},-10.7\times 10^{-5}~\text{J}~\text{mol}^{-3}$ for $C_{s}=12$, 14, 17, 19, 20 %, respectively. This result justifies that the interface undergoes thermodynamically unstable phase separation of spinodal type as the concentration conditions satisfy $\unicode[STIX]{x2202}^{2}\triangle G_{m}/RT/\unicode[STIX]{x2202}C_{s}^{2}<0$ (Porter, Easterling & Sherif Reference Porter, Easterling and Sherif2009; Kwiatkowski Da Silva et al. Reference Kwiatkowski Da Silva, Ponge, Peng, Inden, Lu, Breen, Gault and Raabe2018) which shows they are in the spinodal region. Further spontaneous Korteweg convection drives the secondary instability dynamics of multiple droplet formation shown in figure 3. However, in the case of $C_{s}=12\,\%$ the effectiveness of phase separation is small as it falls near the boundary region of phase diagram shown in figure 1. Based on this, we claim that in the current study, the phase transformation is initially driven by diffusion, which is followed by such a phase separation which takes place locally in the interfacial region. We propose that this is a new interfacial dynamics with spinodal type phase separation. Such phase separation is also called one of uphill diffusion phenomena; see Krishna (Reference Krishna2015) for a detail review on this subject and that arises due to the strong coupling between the diffusive fluxes of species and the thermodynamic forces due to chemical potential gradients.

Figure 10. (a) Concentration field of  $\unicode[STIX]{x1D719}_{p}$ obtained through numerical simulation. The dimensionless times are $t=1$, 20, 30 and 40 (from left to right). (b) Time evolution of droplet area $A$. (c) Trajectory of the computed droplet with initial composition in the drop ( $\unicode[STIX]{x1D719}_{w}=0.5,\unicode[STIX]{x1D719}_{p}=0.3,\unicode[STIX]{x1D719}_{s}=0.2$). It is formed in a uniform continuous phase with initial composition $\unicode[STIX]{x1D719}_{w}=0.1,\unicode[STIX]{x1D719}_{p}=0.1,\unicode[STIX]{x1D719}_{s}=0.8$ obtained from numerical simulation. (d) Mean squared displacement of self-propelled droplet corresponding to panel (c).
Further, to compare with the experimental findings of the second part of the secondary instability, i.e. self-propelling droplets shown in figure 8(b), we perform the numerical simulations using the model equations of conservation of mass and momentum by neglecting the convective force of Stokes equations (Ban et al. Reference Ban, Fukuyama, Makino, Nawa and Nagatsu2016),
 $$\begin{eqnarray}\displaystyle & \displaystyle \unicode[STIX]{x1D735}\boldsymbol{\cdot }\boldsymbol{v}=0, & \displaystyle\end{eqnarray}$$
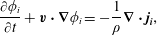 $$\begin{eqnarray}\displaystyle & \displaystyle \frac{\unicode[STIX]{x2202}\unicode[STIX]{x1D719}_{i}}{\unicode[STIX]{x2202}t}+\boldsymbol{v}\boldsymbol{\cdot }\unicode[STIX]{x1D735}\unicode[STIX]{x1D719}_{i}=-\frac{1}{\unicode[STIX]{x1D70C}}\unicode[STIX]{x1D735}\boldsymbol{\cdot }\boldsymbol{j}_{\boldsymbol{i}}, & \displaystyle\end{eqnarray}$$
 $$\begin{eqnarray}\displaystyle & \displaystyle \unicode[STIX]{x1D702}\unicode[STIX]{x1D6FB}^{2}\boldsymbol{v}-\unicode[STIX]{x1D735}p=-\mathop{\sum }_{i=p,s,w}\boldsymbol{F}_{\boldsymbol{i}}, & \displaystyle\end{eqnarray}$$
 $$\begin{eqnarray}\displaystyle & \displaystyle \boldsymbol{F}_{\boldsymbol{i}}=\frac{\unicode[STIX]{x1D70C}RT}{M_{w}}\unicode[STIX]{x1D707}_{i}\unicode[STIX]{x1D735}\unicode[STIX]{x1D719}_{i}, & \displaystyle\end{eqnarray}$$
 where  $\boldsymbol{v},\unicode[STIX]{x1D702},p$ are the velocity, viscosity and pressure, respectively, and $\boldsymbol{j}_{\boldsymbol{i}}$ the diffusion flux of component $i$. Here, $\unicode[STIX]{x1D70C}$ is the density, $M_{w}$ is the molecular weight, $\unicode[STIX]{x1D719}_{i}$ is the molar fraction of component $i$, and $\unicode[STIX]{x1D707}_{i}(=\unicode[STIX]{x1D6FF}G/\unicode[STIX]{x1D6FF}\unicode[STIX]{x1D719}_{i})$ is the generalized chemical potential of component $i$. The body force $\boldsymbol{F}_{\boldsymbol{i}}$ is directed toward the rich region of component $i$, which is referred to as Korteweg force in the literature (Vladimirova et al. Reference Vladimirova, Malagoli and Mauri1999; Ban et al. Reference Ban, Yamada, Aoyama, Takagi and Okano2012). We numerically simulate the motion of the single self-propelled droplet through Korteweg force and the detailed procedure of numerical simulation is described in Ban et al. (Reference Ban, Fukuyama, Makino, Nawa and Nagatsu2016). Figure 10(a) depicts, the concentration field of $\unicode[STIX]{x1D719}_{p}$ in the single droplet. Considering the respective free energy calculation of (3.1) with the above compositions and assuming the corresponding $\unicode[STIX]{x1D712}_{pw}=3,\unicode[STIX]{x1D712}_{sw}=3,\unicode[STIX]{x1D712}_{ps}=6$ for this numerical computation, we find the second derivative of Gibbs free energy with respect to the salt is also negative, i.e. in the thermodynamically unstable state. It is observed that, the droplet initially absorbs material from the surrounding continuous phase and excavates a ditch of material around its perimeter. The concentration profile around the droplet becomes non-uniform, thereby exerting body force $\boldsymbol{F}_{\boldsymbol{i}}$ leading to the spontaneous motion of the droplet at subsequent time. Also the area, trajectory and the MSD of the simulated moving droplet are shown in figures 10(b), 10(c) and 10 (d), respectively. In the simulation, the area is defined as the region occupied by the molar fraction of the water $\unicode[STIX]{x1D719}_{w}>0.5$ and the initial concentration of water in the drop is $\unicode[STIX]{x1D719}_{w}=0.5$. At the early stage, $\unicode[STIX]{x1D719}_{w}$ decreases by diffusion since the initial molar fraction of the water in the surrounding is $\unicode[STIX]{x1D719}_{w}=0.1$. Thus, the area where the $\unicode[STIX]{x1D719}_{w}\geqslant 0.5$ decreases at the early stage. Therefore we show the area of the drop evolution after $t\geqslant 25$, where the area represents the existence of phase separation, in the figure 10(b). Interestingly, increasing of drop area is proportional to $t^{1.6}$ (figure 10b) and such dynamics qualitatively matches our experimental findings presented in figure 7(b), i.e. the area increases with a power index ${\sim}$1.7 corresponding to the length increasing close to linear in time (Poesio et al. Reference Poesio, Beretta and Thorsen2009), justifying the spontaneous convection during phase separation. Also, the numerical simulations clearly show the rotational motion of the droplets (see figure 10c) expressed by the oscillatory behaviour of the MSD in figure 10(d) signifying the self-propelling dynamics of the secondary instability. We emphasize that figure 10(d) matches our experimental results in figure 8(b). Since the simulation considers the body force term in the momentum equation, the agreement between the experiment and simulation demonstrates that the body force should play a role in the experiment.
Here, we also mention that, in our experiment, miscibility of two aqueous solutions is thermodynamically controlled by varying the salt concentrations, thereby allowing systematic changes in the interfacial tension and underlying dynamics. Since the concentration of PEG, which is a surface-active agent, almost remains constant in all of our experiments, the droplet formation is not driven by the Marangoni effect, rather it is due to spontaneous convection induced by the phase separation.
4 Conclusion
We have succeeded in experimentally changing the solution system from immiscible to fully miscible or partially miscible by varying the concentrations of the components in an aqueous two-phase system while leaving the viscosities relatively unchanged at room temperature and atmospheric pressure. We have experimentally discovered a new topological change of VF instability obtaining a secondary instability such as multiple moving-droplets formation in a partially miscible system. We have proved, using several experimental methods such as measurement of VF areas in Hele-Shaw flow, interfacial tension measurement through spinning drop tensiometer, and cloud point measurement, that such kind of secondary instability occurs due to the spinodal type phase separation in the ATPS mixture which generates a Korteweg convection by compositional gradient. Further, we have shown the comparison of experimental observation of self-propelling droplet motion with numerical simulation of the transport equation using a chemical thermodynamic model. To our knowledge, this is the first successful experiment to find such secondary instability in a partially miscible system and to depict how hydrodynamics and chemical thermodynamics (phase separation) interplay leads to anomalous topological pattern dynamics. Such a discovery contributes in opening a new area of research by coupling hydrodynamics and chemical thermodynamics, and can be very useful for future developments related to global warming and energy problems, in particular,  $\text{CO}_{2}$-EOR (Orr & Taber Reference Orr and Taber1984), because such techniques are based on fluid displacement processes in partially miscible systems. Also, various other possible biological applications like the formation of spontaneous lipid droplets (Thiam, Farese & Walther Reference Thiam, Farese and Walther2013) and microfluidic single cell screening assays for the inhibition of a drug target (Debs et al. Reference Debs, Utharala, Balyasnikova, Griffiths and Merten2012; Schneider, Kreutz & Chiu Reference Schneider, Kreutz and Chiu2013) can be understood using the present coupling of hydrodynamics and chemical thermodynamics.
Acknowledgements
This work was supported by PRESTO-JST (no. 25103004 ‘Phase Interfaces for Highly Efficient Energy Utilization’). M.M. gratefully acknowledge the JSPS Invitation Fellowships for Research in Japan (no. L19548).
Declaration of interests
The authors report no conflict of interest.
Supplementary movie
Supplementary movie is available at https://doi.org/10.1017/jfm.2020.406.


 Open access