


1. Introduction
Segregation of granular mixtures is a commonly observed phenomenon in many industrial processes. Examples include the separation of mixtures of grains into regions rich in one type of grain during the formation of heaps, and flow through hoppers and silos. Similarly, granular segregation is evident in the case of the flow of mixtures in rotating tumblers and chute flows. The key factors that may lead to the segregation of granular mixtures are variations in the size, density, shape and surface properties. While studies investigating the effect of the particle shape (Maione et al. Reference Maione, De Richter, Mauviel and Wild2015; Pereira & Cleary Reference Pereira and Cleary2017) and surface properties are also reported (Windows-Yule, Douglas & Parker Reference Windows-Yule, Douglas and Parker2015; Gillemot, Somfai & Börzsönyi Reference Gillemot, Somfai and Börzsönyi2017), the size and density difference driven segregation has remained the focus of most studies due to their frequent occurrences in most practical scenarios.
Though studies investigating the combined effect of size and density together are also available (Jain, Ottino & Lueptow Reference Jain, Ottino and Lueptow2005; Pereira, Tran & Cleary Reference Pereira, Tran and Cleary2014; Tunuguntla, Bokhove & Thornton Reference Tunuguntla, Bokhove and Thornton2014; Gray & Ancey Reference Gray and Ancey2015; Chen et al. Reference Chen, Zhao, Xiao, Liu and Liu2016; Duan et al. Reference Duan, Umbanhowar, Ottino and Lueptow2021), the effect of density difference and size difference is usually studied independently in order to better understand the role of each separately. A large body of literature deals with size difference driven segregation, and different configurations/geometries have been used to study segregation of granular mixtures, including vibrated bed (Jain, Metzger & Glasser Reference Jain, Metzger and Glasser2013; Qiao et al. Reference Qiao, Duan, Dong, Wang, Jiang, Zhu and Zhao2021), hopper flow (Xiao et al. Reference Xiao, Fan, Jacob, Umbanhowar, Kodam, Koch and Lueptow2019; Deng et al. Reference Deng, Fan, Theuerkauf, Jacob, Umbanhowar and Lueptow2020), chute flow (Savage & Lun Reference Savage and Lun1988; Dolgunin & Ukolov Reference Dolgunin and Ukolov1995; Gray & Thornton Reference Gray and Thornton2005; Gray & Chugunov Reference Gray and Chugunov2006; Thornton, Gray & Hogg Reference Thornton, Gray and Hogg2006; Thornton et al. Reference Thornton, Weinhart, Luding and Bokhove2012; Deng et al. Reference Deng, Umbanhowar, Ottino and Lueptow2018; Tripathi et al. Reference Tripathi, Kumar, Nema and Khakhar2021), heap flow (Baxter et al. Reference Baxter, Tüzün, Heyes, Hayati and Fredlund1998; Schlick et al. Reference Schlick, Isner, Freireich, Fan, Umbanhowar, Ottino and Lueptow2016; Fan et al. Reference Fan, Jacob, Freireich and Lueptow2017), rotating tumbler (Gray & Hutter Reference Gray and Hutter1997; Hill et al. Reference Hill, Khakhar, Gilchrist, McCarthy and Ottino1999; Schlick et al. Reference Schlick, Fan, Umbanhowar, Ottino and Lueptow2015; Barker et al. Reference Barker, Rauter, Maguire, Johnson and Gray2021) and shear box (Bridgwater, Foo & Stephens Reference Bridgwater, Foo and Stephens1985; Trewhela, Ancey & Gray Reference Trewhela, Ancey and Gray2021).
Fan et al. (Reference Fan, Schlick, Umbanhowar, Ottino and Lueptow2014) used discrete element method (DEM) simulations to obtain a linear scaling relation for the species percolation velocity with the shear rate and the other species concentration in a binary mixture of different size particles. Using this empirical correlation in the convection–diffusion equation, the authors were able to predict accurately the size segregation in the case of heap flow. Schlick et al. (Reference Schlick, Fan, Umbanhowar, Ottino and Lueptow2015) used a similar approach to predict the size segregation in rotating cylinders as well. Multi-component mixtures having particles of different sizes have also been studied using a similar (Gray & Ancey Reference Gray and Ancey2011; Schlick et al. Reference Schlick, Isner, Freireich, Fan, Umbanhowar, Ottino and Lueptow2016; Deng et al. Reference Deng, Umbanhowar, Ottino and Lueptow2019) or slightly different (Gray Reference Gray2018; Bancroft & Johnson Reference Bancroft and Johnson2021; Trewhela et al. Reference Trewhela, Ancey and Gray2021) approach. Cui, Zhou & Jing (Reference Cui, Zhou and Jing2022) have recently extended the size segregation models for mixtures having different interstitial fluids as well.
Relatively fewer studies are available on granular mixtures differing only in density. Vibrated bed configuration has been a popular choice for experimental studies on density segregation (Burtally, King & Swift Reference Burtally, King and Swift2002; Hsiau & Chen Reference Hsiau and Chen2002; Shi et al. Reference Shi, Sun, Hou and Lu2007; Tai, Hsiau & Kruelle Reference Tai, Hsiau and Kruelle2010; Oshitani et al. Reference Oshitani, Sugo, Mawatari, Tsuji, Jiang and Franks2020), and a comparison of the experiments with DEM simulations for these configurations is also reported (Yang Reference Yang2006). In addition, a computational study of density segregation in wet and dry granular mixtures in a vibrated bed has also been performed (Lim Reference Lim2016). Liao, Hsiau & Nien (Reference Liao, Hsiau and Nien2014, Reference Liao, Hsiau and Nien2015) studied experimentally the density-driven segregation patterns and investigated the effects of the density ratio, rotation speed and fill level on the behaviour of density-induced granular segregation in a circular thin rotating drum. Fan & Hill (Reference Fan and Hill2015) investigated numerically and theoretically the effects of the shear rate gradient and granular temperature (trace of kinetic stress) on the segregation of particles of the same size and different densities sheared in vertical chute flow, and found that denser particles segregate in the region of lower shear rates.
Xiao et al. (Reference Xiao, Umbanhowar, Ottino and Lueptow2016) performed experiments and simulations of flowing binary density mixture in a quasi-two-dimensional bounded heap. Following the approach used for size segregation studies (Fan et al. Reference Fan, Schlick, Umbanhowar, Ottino and Lueptow2014; Schlick et al. Reference Schlick, Fan, Umbanhowar, Ottino and Lueptow2015), the authors used a linear relation of the segregation velocity with shear rate and other species concentration to predict segregation due to density difference. An empirical parameter termed the ‘segregation length’ captures the influence of density difference on segregation velocity and is reported to be proportional to the logarithm of the density ratio. This is in contrast to most of the previous studies (Tripathi & Khakhar Reference Tripathi and Khakhar2013; Tunuguntla et al. Reference Tunuguntla, Bokhove and Thornton2014) that suggest that the segregation flux is linearly dependent on the density difference. In addition, the obtained values for the segregation length scale depend upon the composition at the inlet of the bounded heap. Specifically, the segregation length scale obtained in the case of  $80\,\%$ light and $20\,\%$ heavy particles at the inlet was found to be ${\approx }25\,\%$ larger compared to the equal composition mixture at the inlet. Such concentration dependency of the segregation length scale is indicative of more complex concentration dependence that has been confirmed in recent studies (Jones et al. Reference Jones, Isner, Xiao, Ottino, Umbanhowar and Lueptow2018; Duan et al. Reference Duan, Umbanhowar, Ottino and Lueptow2021).
Another important limitation of these empirical correlation-based approaches originates from the fact that both the segregation flux and the diffusion flux vary linearly with the shear rate. In the case of steady, fully developed chute flows, the convection–diffusion equation reduces to the balance of segregation and diffusion fluxes, and dictates that the segregation should be independent of the shear rate. However, DEM simulations of binary mixtures of different density particles show a clear influence of the inclination angle (and hence shear rate) on the concentration profiles (Tripathi & Khakhar Reference Tripathi and Khakhar2013). In addition, the prediction of the segregation using these empirical approaches typically assumes a prior knowledge of the velocity field in the system of interest. Recently, Tirapelle et al. (Reference Tirapelle, Santomaso, Richard and Artoni2021) have shown that using Stokes’ law to obtain the percolation velocity enables prediction of segregation of a binary mixture of different density particles in an annular shear shell geometry. However, these authors also utilise an a priori known velocity profile in the system. The combined effects of rheology and segregation along with the momentum balance equations have been accounted for in the recent study by Barker et al. (Reference Barker, Rauter, Maguire, Johnson and Gray2021). Using a three-parameter segregation model obtained from the shear box experiments of Trewhela et al. (Reference Trewhela, Ancey and Gray2021), the authors were able to predict properties of a multi-component mixture of different-sized particles in a developing flow over an inclined surface. The proposed theory by these authors is fully coupled in two dimensions, and accounts for time-dependent variation of the properties using a well-posed rheological model for the bulk flow. The authors also showed that the current approach is able to predict qualitatively radial segregation in a rotating tumbler geometry as well.
In a different approach, Tripathi & Khakhar (Reference Tripathi and Khakhar2013) proposed a particle force-based segregation model for predicting density segregation in binary granular mixtures flowing over inclined surfaces. The authors accounted for the coupling of rheology and segregation, and used these constitutive models in the momentum balance equation to obtain theoretical predictions of various flow properties of interest. The predictions from the proposed theory were found to be in very good agreement with DEM simulations. This density segregation theory does not require any fitting parameter, and successfully captures the dependence of segregation on the inclination angle, mixture composition and density ratios. Recently, Tripathi et al. (Reference Tripathi, Kumar, Nema and Khakhar2021) used a similar particle force-based approach to predict size segregation of binary mixtures in chute flows for a wide range of compositions and inclinations for two different size ratios.
In order to generalise the particle force-based density segregation approach to multi-component systems, several issues need to be resolved. For the case of binary mixtures, the particle force-based theory leads to an ordinary differential equation that can be solved analytically to predict the species concentration variation as a function of distance from the base. Extension of this approach to multi-component mixtures leads to a system of inter-coupled ordinary differential equations for species concentrations. Simple analytical expressions for species concentrations are not possible due to the inter-coupling of the equations. Note that this inter-coupling of the species concentration equations is in addition to the inter-coupling of the rheological model with the segregation model. In addition, the presence of more than two components changes the qualitative behaviour of the species concentration fields. While the variation of the concentrations of the lightest and heaviest species with spatial location remains monotonic as in the case of binary mixtures, the concentration of species having intermediate densities shows a non-monotonic variation with spatial location, indicating the need for a generalised approach.
In this work, we address all these issues and present a continuum approach to predict various flow properties of multi-component granular mixtures comprising equal-sized spherical particles differing only in their densities. Both the density segregation model and the rheological model proposed for binary mixtures have been generalised to multi-component mixtures. These models are coupled with the momentum balance equations, and the resulting system of equations is solved iteratively to obtain the theoretical predictions of various properties. The predictions for mixtures having three, four and five species are compared with results obtained from DEM simulations. The predicted flow properties such as velocity profiles, shear stress, pressure and concentration fields at steady state are in excellent agreement with the DEM simulations for mixtures spanning a large range of compositions, and density ratios flowing over different inclination angles. Through this work, we take the first essential step towards proposing a generalised particle force-based segregation theory for multi-component mixtures differing in size and/or density.
The organisation of the paper is as follows. The methodology used for simulating the flow of a mixture of same-sized and different density particles over an inclined plane using the DEM is discussed in § 2. The density segregation model and the mixture rheological model for multi-component mixtures and their coupling with each other, as well as the momentum balance equations for steady, fully developed chute flow, are discussed in § 3. DEM simulation results for a wide range of compositions and densities of ternary mixtures are presented in § 4 along with a comparison with the theoretical predictions. Results for mixtures having more than three components are presented in § 5. Discussion about different initial configurations and the role of normal stress differences on theoretical predictions is presented in § 6, followed by a summary in § 7.
2. Simulation methodology
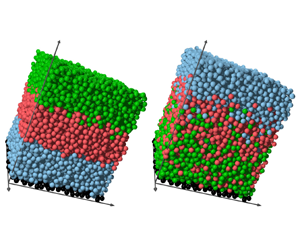
We simulate granular mixtures of different density and identical size particles without any polydispersity, modelled as slightly inelastic and frictional spheres of diameter  $d$, flowing over a bumpy inclined surface. At the start of the simulation, the flowing particles are arranged with their centres on a cubic lattice so that no two particles are in contact. All the particles are given random initial velocities. The chute angle is kept high for the initial few time units so that particles accelerate and gain energy. The inclination is then reduced to the desired value, and the flow is allowed to achieve a steady state. In some cases, we first settle the particles at a zero inclination angle and then increase the inclination to the desired angle. The steady-state results are found to be identical for both protocols. The particles are initially arranged in the increasing order of density with distance from the base so that the lowest-density particles are located near the base, and the highest-density particles are located near the free surface. A schematic representing such a completely segregated ternary mixture following the settling at zero inclination protocol is depicted in figure 1. The figure shows the arrangement of particles, with heavy (green) particles of mass $m_{H}$ at the top, medium-density (red) particles of mass $m_{M}$ in the middle, and light (blue) particles of mass $m_{L}$ near the base.

Figure 1. Snapshot representing the initial condition of a completely segregated ternary mixture of particles flowing (along the  $x$-direction) under the influence of gravity over a bumpy inclined surface at inclination $\theta$. Green spheres represent the heavy particles (mass $m_H$), red spheres represent intermediate particles (mass $m_M$), and blue spheres represent light particles (mass $m_L$). Black spheres represent the static particles that form the bumpy base.
The bumpy chute base represented by black spheres in figure 1 is prepared by taking a slice of  $1.2d$ thickness from a random close-packed configuration of spheres of size $d$. The simulation box is $20d\times 20d$ long and wide in the flow ( $x$) and neutral ( $z$) directions. The height of the simulation box in the $y$-direction is taken to be sufficiently large to ensure that the particles never reach the top surface of the simulation box, to accurately mimic the free surface flow. The total number of flowing particles simulated in the system is 10 000, so that the typical flowing layer height is $H\approx 25d$. The simulations for ternary mixtures are performed over a wide range of compositions, density ratios and inclination angles. For mixtures with more than three species, simulations are performed only for equal composition of the species. Three different sets of density ratios are used for quaternary mixtures, while a single density ratio is considered for the five-component mixture.
The DEM simulation is used to simulate the flow and segregation behaviour of the mixtures flowing over an inclined surface. The method accounts for the gravity force and the inter-particle contact forces acting on the particles. The positions, as well as the linear and angular velocities of all the particles, are updated at sufficiently small time steps by integrating numerically the equations of motion. A linear spring–dashpot model in both normal and tangential directions is used to calculate the contact forces. The magnitude of the tangential force is restricted by Coulomb's friction law. The contact force  $\boldsymbol {F}_{i j}$ between two contacting particles $i$ and $j$ is given as
 \begin{equation} \boldsymbol{F}_{i j} = (k_n \delta_n \hat{n}_{i j} - \gamma_n m_{eff} \boldsymbol{v}_{n i j}) - (k_t \delta_t \hat{t}_{i j} + \gamma_t m_{eff} \boldsymbol{v}_{t i j}), \end{equation}
where  $k_n$ and $k_t$ are the stiffnesses of the springs, and $\gamma _n$ and $\gamma _t$ are the viscous damping coefficients in the normal and tangential directions, respectively. Also, $\hat {n}_{ij}$ and $\hat {t}_{ij}$ are the unit vectors, and $\boldsymbol {v}_{nij}$ and $\boldsymbol {v}_{tij}$ are the normal and tangential relative velocities of the contact point. While the deformation in the normal direction at any instant is obtained as the instantaneous overlap, the deformation in the tangential direction $\delta _t$ is obtained by integrating the tangential velocity at the contact point since the beginning of the contact. The stiffness of the particles in the normal direction is $k_{n} = 2 \times 10^{5}\ {\rm mg}\ {\rm d}^{-1}$, and that in the tangential direction is $k_{t} = 2k_{n}/7$. The values of $\gamma _n$ and $\gamma _t$ are chosen to ensure that the restitution coefficients in the normal and the tangential directions are $e_{n} = 0.88$ and $e_{t} = 1$, respectively. Both static and sliding friction are assumed to be equal to $\mu = 0.5$. More details of the contact force model can be found in Tripathi & Khakhar (Reference Tripathi and Khakhar2011b).
The average velocity of all the  $N$ particles partially or completely situated in the sampling volume $V_s$ is calculated as $\boldsymbol {v}=\sum _{i=1}^{N} w_i \boldsymbol {v}_{i}$, where $w_i$ is the volume fraction of particle $i$ in the sampling volume, and $\boldsymbol {v}_{i}$ is the instantaneous velocity of particle $i$. The stress tensor is calculated as
 \begin{equation} \underline{\underline{\sigma}} = \frac{1}{V_s}\left[\sum_{i=1}^{N} w_i m_i(\boldsymbol{v}_{i} \boldsymbol{v}_{i} - \boldsymbol{v} \boldsymbol{v}) + \sum_{i=1,i\neq j}^{N_c} w_{ij}\boldsymbol{F}_{i j} \boldsymbol{x}_{i j} \right] . \end{equation}
The first term in (2.2) represents the contribution of the velocity fluctuations to the stress tensor due to volume fraction  $w_i$ of particle $i$ situated in the sampling volume. The second term represents the contribution due to the contact forces between the contacting particles summed over the $N_c$ pairs, with $w_{ij}$ being the fraction of the branch vector (which joins the centres of contacting particles $i$ and $j$) lying within the volume $V_s$. The sampling volume is taken as a strip of thickness $d$ spanning the entire area of the simulation box in the $x$–
$x$– $z$ plane. The pressure is calculated as the trace of the stress tensor, i.e. $P = (\sigma _{x x} + \sigma _{y y} + \sigma _{z z} )/3$, and the shear stress $\tau _{yx} = \sigma _{yx}$.
Measurements are taken only after the system has reached a steady state, characterised by constant kinetic energy and a constant height of the centres of mass of all the species in the mixture. Results at steady state are obtained by calculating the mean and standard deviation of the properties of interest over 10 sets of 10 time units each. The results are reported in dimensionless form using the mass of the lightest particles  $m_L$ as the mass scale, particle diameter $d$ as the length scale, $(d/g)^{1/2}$ as the time scale, and $m_L g$ as the force scale. Hence the velocity is scaled by $(gd)^{1/2}$, the shear stress and pressure are scaled by $m_L g/d^2$, the diffusivity is scaled by $(gd^3)^{1/2}$, and the shear rate is scaled by the inverse of the time scale.
3. Theory
3.1. Density segregation theory for ternary mixtures
Consider a ternary granular mixture consisting of three different species. The particles of the three species have identical volumes ( $V_p$) due to the same size of particles, and differ only in density (figure 2a). The masses of the heavy (green), medium (red) and light (blue) particles are $m_H$, $m_M$ and $m_L$, respectively, and $\rho _{i} = m_{i}/V_p$ is the density of the particles. Following Tripathi & Khakhar (Reference Tripathi and Khakhar2013), we use an effective medium approach and calculate the buoyant force on any particle by assuming it to be immersed in a continuum of density $\rho _m$ given as
 \begin{equation} \rho_{m}=\phi(\rho_{H} f_{H} + \rho_{M} f_{M} + \rho_{L} f_{L} ), \end{equation}
where  $\phi$ is the total solids volume fraction, and $f_{i}=n_i/n$ is the number fraction of the $i{\rm th}$ species, with $n_{i}$ the number density of the $i{\rm th}$ species, and $n$ the total number density. The species volume fraction $\phi _i$ is equal to the product of the species number fraction and the particle volume. Since the sizes of the particles of all the species are the same, $\phi _i=n_iV_{p}$ and the total volume fraction $\phi =\phi _H+\phi _M+\phi _L$ equals the product of the total number density $n=n_H+n_M+n_L$ and particle volume $V_p$, i.e. $\phi =nV_p$. Hence the volume fraction of the $i$th species $\phi _i/\phi$ equals the number fraction $n_i/n=f_i$. Thus $f_i$ can also be interpreted as the concentration of the $i{\rm th}$ species per unit granular volume.

Figure 2. (a) Schematic of a ternary granular mixture containing particles of three different masses. High-density particles of mass  $m_{H}$ are represented using green spheres, medium-density particles of mass $m_{M}$ are represented using red spheres, and low-density particles of mass $m_{L}$ are represented using blue spheres. (b) Gravity and buoyant force on the three types of particles in an effective medium of density $\rho _m$, where $g_y=g\cos \theta$ is the magnitude of the gravity component in the $y$-direction.
Consider a single heavy particle (green particle shown in figure 2b) immersed in this effective medium of density  $\rho _m$. The net body force acting on this particle in the upward direction (i.e. in the positive $y$-direction) is
 \begin{equation} F_{H} = F_{B}-m_{H}g\cos\theta, \end{equation}
where  $g \cos \theta$ is the magnitude of the $y$-component of gravitational acceleration, and $F_{B}$ is the buoyancy force exerted on this particle in the upward (i.e. positive $y$) direction by the granular medium (see figure 2b). To account for the presence of voids in the vicinity of this heavy particle, we hypothesise that the volume of the displaced granular fluid (shown using the dashed circle in figure 2b) is larger than the particle volume, so that $F_{B}={\rho }_{m}{V_{E}}{g\cos \theta }$, where ${V_{E}}$ is the volume of the displaced medium. The net force on the heavy particle in the upward $y$-direction is
 \begin{equation} F_{H}={\phi (\rho_{H} f_{H} + \rho_{M} f_{M} + \rho_{L} f_{L} )}{V_{E}}{g\cos\theta}-m_{H}g\cos\theta. \end{equation}
For the limiting case when the densities (and masses) of all three species are equal (i.e.  $\rho _{H} = \rho _{M} = \rho _{L} = m_H/V_p$), there should be no net force on the particle, i.e. $F_{H} = 0$. Since $f_H+f_M+f_L=1$, we get the effective volume of the particles to be $V_{E}= V_p/\phi$. An identical expression for $V_E$ has been obtained in the case of the binary mixture by Tripathi & Khakhar (Reference Tripathi and Khakhar2013) and is consistent with the theoretical calculations of Kumar, Khakhar & Tripathi (Reference Kumar, Khakhar and Tripathi2019). This expression for $V_E$ indicates that the free void volume among the particles is shared equally by all the particles in the case of equal-size particles. Using this expression for $V_E$, we get the buoyancy force acting on the particles in the upward direction as
 \begin{equation} F_{B} = [f_{H} m_{H} + f_{M} m_{M} + f_{L} m_{L}]g\cos\theta, \end{equation}
and the net force on a heavy particle in the  $y$-direction turns out to be
 \begin{equation} F_{H} ={-}m_{H} g\cos\theta + [f_{H} m_{H} + f_{M} m_{M} + f_{L} m_{L}]g\cos\theta. \end{equation}
Using  $f_{H}=1- f_{M} - f_{L}$, the above expression simplifies to
 \begin{equation} F_{H} ={-}[(m_{H} - m_{M})f_{M} + (m_{H} - m_{L}) f_{L}]g\cos\theta. \end{equation}
The forces on the medium- and light-mass particles in the  $y$-direction are obtained in a similar fashion, giving
 $$\begin{gather} F_{M} ={-}[(m_{M} - m_{H})f_{H} + (m_{M} - m_{L}) f_{L}]g\cos\theta, \end{gather}$$
 $$\begin{gather}F_{L} ={-}[(m_{L} - m_{M})f_{M} + (m_{L} - m_{H}) f_{H}]g\cos\theta. \end{gather}$$
 Since  $m_H>m_M>m_L$, (3.6) shows that the value of the net force on the heavy particle in the upward (i.e. positive $y$) direction is always negative. Similarly, the net upward force on the light particle always remains positive. The force direction on the medium-mass particle, however, depends upon the relative concentrations of heavy and light particles, and the mass differences between the particles. The net force acting on the heavy (light) particle leads to a downward (upward) motion of the particle that is balanced by the viscous drag offered by the granular layer.
Force balance equations in the flowing direction for the three types of particles can also be written in a manner similar to (3.6), (3.7) and (3.8). Such a force balance in the  $x$-direction gives rise to a slip velocity of the heavy particle in the flow direction due to the resultant force of gravity and buoyancy acting in the $x$-direction. Due to this slip velocity, the heavy particles move with a slightly different velocity in the $x$-direction compared to other particles. Such slip velocities have been reported for different-size tracer particles van der Vaart et al. (Reference van der Vaart, van Schrojenstein Lantman, Weinhart, Luding, Ancey and Thornton2018). Our simulation results indeed show a very small but finite slip velocity between the heavy, medium and light particle velocities in the flow direction. A detailed calculation of the lift force for same-size different-density tracer particles is also possible using the approach of van der Vaart et al. (Reference van der Vaart, van Schrojenstein Lantman, Weinhart, Luding, Ancey and Thornton2018). However, as discussed below, we find that the effect of this lift force on the segregation can be captured adequately without knowing the detailed expression.
Following Tripathi & Khakhar (Reference Tripathi and Khakhar2011a, Reference Tripathi and Khakhar2013), we assume that the viscous drag force on a settling sphere in a granular fluid is proportional to the viscosity  $\eta$ and settling velocity $v_i$, i.e. $F_D=-c{\rm \pi} \eta v_i d$, where $c=c(\phi )$ is the solids volume fraction dependent Stokes drag coefficient. For a heavy particle that is settling at a constant velocity through a surrounding mixture of particles, $F_H+F_D=0$, and the settling heavy particle achieves a terminal velocity
 \begin{equation} v_{H} = \dfrac{F_{H}}{c{\rm \pi}\eta d}. \end{equation}
It is evident that the above equation does not account for the presence of the lift force due to the slip velocity of the heavy particles. Let  $\beta$ be the ratio of the magnitude of the lift force to the combined force of gravity and buoyancy $F_H$, i.e. $F_{Lift}=\beta F_H$. In general, the factor $\beta$ is not a constant and needs to account for the unknown dependence of the shear rate, granular viscosity, particle density and all other factors that influence the ratio $F_{Lift}/F_H$. By accounting for the lift force in the force balance equation in the $y$-direction, we obtain $F_H+F_{Lift}=c{\rm \pi} \eta v_H d$. Using $F_{Lift}=\beta F_H$, we get $F_H=c{\rm \pi} \eta v_H d/(1+\beta )$. Thus the explicit inclusion of the lift force in the flow direction effectively leads to a modified value of the Stokes drag coefficient $c(\phi )=c/\beta$. The DEM simulations in Tripathi & Khakhar (Reference Tripathi and Khakhar2011a, Reference Tripathi and Khakhar2013) use the total $y$-direction force on the heavy particles to obtain the values of the Stokes drag coefficient $c(\phi )$ and thus implicitly account for both the lift force due to slip velocity between the species as well as the net force due to the combined effect of gravity and buoyancy in the $y$-direction.
Settling of these heavy particles leads to the segregation flux  $\dot {J}^{S}_{H}$ of heavy particles
 \begin{equation} \dot{J}^{S}_{H} = n_{H}(v_{H} - v_{m}), \end{equation}
where  $v_{m} = f_{H}v_{H} + f_{M} v_{M} + f_{L}v_{L}$ is the local volume average mixture velocity in the downward direction. Using the expressions for segregation velocities for medium- and light-mass particles as $v_{M} = F_{M}/c{\rm \pi} \eta d$ and $v_{L} = F_{L}/c{\rm \pi} \eta d$, where $F_M$ and $F_L$ are given by (3.7) and 3.8, we get $v_{m} = 0$. The segregation flux of heavy particles is given as
 \begin{equation} \dot{J}^{S}_{H} ={-}n f_{H}\,\dfrac{[(m_{H} - m_{M})f_{M} + (m_{H} - m_{L}) f_{L}]g\cos\theta}{c{\rm \pi}\eta d}. \end{equation}
The diffusion flux  $\dot {J}^{D}_{H}$ of heavy particles in the $y$-direction is
 \begin{equation} \dot{J}^{D}_{H} ={-} n D_H\,\dfrac{{\rm d}f_{H}}{{\rm d} y}, \end{equation}
where  $D_H$ is the self-diffusion coefficient of heavy particles. The constitutive equations (3.11) and (3.12), along with a transport equation of the form
 \begin{equation} \dfrac{\partial (n f_H)}{\partial t} ={-} \dfrac{\partial}{\partial y}(\dot{J}_{H}^{S} + \dot{J}_{H}^{D}), \end{equation}
can be used to obtain the time-dependent concentration profiles of the heavy species. We consider the steady-state case for the flow and segregation in the layer to get
 \begin{equation} \dot{J}_{H}^{S} + \dot{J}_{H}^{D} = 0. \end{equation}
Substituting (3.11) and (3.12) in the above equation and rearranging gives the following equation for the steady-state concentration field of the heavy species:
 \begin{equation} \dfrac{{\rm d}f_{H}}{{\rm d} y} ={-} \dfrac{f_{H}[( m_{H} - m_{M}) f_{M} + (m_{H} - m_{L}) f_{L} ] g \cos \theta}{D c{\rm \pi}\eta d}. \end{equation}
Various studies (Savage Reference Savage1993; Utter & Behringer Reference Utter and Behringer2004; Tripathi & Khakhar Reference Tripathi and Khakhar2013; Fan & Hill Reference Fan and Hill2015) have shown that the diffusion coefficient for granular mixtures in case of shear flows varies linearly with the shear rate  $\dot {\gamma }$, i.e.
 \begin{equation} D_H = b \dot{\gamma} d^2, \end{equation}
where  $b$ is a constant. Using the expression for viscosity $\eta = |\tau _{yx}|/\dot {\gamma }$ along with (3.16), we get
 \begin{equation} \dfrac{{\rm d}f_{H}}{{\rm d} y} ={-} \dfrac{f_{H}[( m_{H} - m_{M}) f_{M} + (m_{H} - m_{L}) f_{L} ] g \cos \theta}{b c {\rm \pi}\,|\tau_{yx}|\,{d}^3}. \end{equation}
Our DEM simulation results show that the self-diffusion coefficient for the three species is identical, i.e.  $D_H=D_M=D_L$, so the constant $b$ remains the same for all three species. Using this result, the equations governing the concentrations of medium- and light-mass particles are obtained as
 $$\begin{gather} \dfrac{{\rm d}f_{M}}{{\rm d} y} ={-} \dfrac{f_{M}[( m_{M} - m_{H}) f_{H} + (m_{M} - m_{L}) f_{L} ]g \cos \theta}{b c {\rm \pi}\,|\tau_{yx}|\,{d}^3}, \end{gather}$$
 $$\begin{gather}\dfrac{{\rm d}f_{L}}{{\rm d} y} ={-} \dfrac{f_{L}[( m_{L} - m_{M}) f_{M} + (m_{L} - m_{H}) f_{H} ]g \cos \theta}{b c {\rm \pi}\,|\tau_{yx}|\,{d}^3}. \end{gather}$$
Equations (3.17)–(3.19) show that the concentration of any one species depends upon the concentrations of the other two species and the mass (or density) difference between the species in addition to the gravity component and shear stress. As mentioned before, the Stokes drag coefficient  $c$ depends upon the packing fraction $\phi$, and the values reported by Tripathi & Khakhar (Reference Tripathi and Khakhar2013) are used in the present study.
3.2. Extension to  $N$-component mixtures

We now generalise the ternary density segregation theory to mixtures having  $N$ different components. Following the approach mentioned in the previous subsection, the net force acting on a particle of the $i{\rm th}$ component in the $y$-direction is
 \begin{equation} F_{i} = \sum_{j=1}^{N}m_{j} f_{j} g\cos\theta - m_{i} g\cos\theta, \end{equation}
where  $f_i$ is the concentration of the $i{\rm th}$ species per unit granular volume. Making use of the identity $\sum _{j=1}^{N}f_{j} = 1$, the above expression simplifies to
 \begin{equation} F_{i} ={-}\sum_{j=1}^{N} (m_{i} - m_{j})f_{j} g\cos\theta. \end{equation}
Equations (3.20) and (3.21) for the  $N$-component mixtures are analogous to (3.5) and (3.6) of the ternary mixture. As before, the steady-state terminal velocity of the $i{\rm th}$ species particle is obtained by balancing the net body force with the drag force:
 \begin{equation} v_{i} = \dfrac{F_{i}}{c{\rm \pi}\eta d}. \end{equation}
 Using these expressions for  $v_{i}$, we obtain $v_{m} = 0$, and the segregation flux of the $i{\rm th}$ species is calculated as $\dot {J}^{S}_{i} = n f_{i} v_{i}$, giving
 \begin{equation} \dot{J}^{S}_{i} ={-}\dfrac{n f_{i}}{c{\rm \pi}\eta d}{\sum_{j=1}^{N} (m_{i} - m_{j}) f_{j} g\cos\theta}. \end{equation}
The diffusion flux  $\dot {J}^{D}_{i}$ of the $i{\rm th}$ species is given as
 \begin{equation} \dot{J}^{D}_{i} ={-} n D\,\dfrac{{\rm d} f_{i}}{{\rm d} y}. \end{equation}
The time-dependent concentration  $f_i$ of species $i$ can be obtained using the transport equation
 \begin{equation} \dfrac{\partial (n f_i)}{\partial t} ={-}\dfrac{\partial}{\partial y}(\dot{J}_{i}^{S} + \dot{J}_{i}^{D}). \end{equation}
For an incompressible flow with constant  $\phi \ (=nV_p)$, we get an equation similar to the one given by Gray & Ancey (Reference Gray and Ancey2011) for multi-component size segregation:
 \begin{equation} \dfrac{\partial (f_i)}{\partial t} -\frac{\partial}{\partial y}\left(\dfrac{ f_{i}}{c{\rm \pi}\eta d}{\sum_{j=1}^{N} (m_{i} - m_{j}) f_{j} g\cos\theta}\right)= \frac{\partial}{\partial y}\left( D\,\dfrac{{\rm d} f_{i}}{{\rm d} y}\right). \end{equation}
 Interestingly, this equation has the same species concentration dependence of the segregation flux as postulated in (2.28) of Gray & Ancey (Reference Gray and Ancey2011) for multi-component mixtures of different size particles. Equation (3.26) shows that the segregation coefficients (or segregation parameters) for multi-component mixtures of different density particles depend on the mass differences between the particles, size of the particles, drag coefficient, component of the gravitational acceleration in the segregation direction, and local viscosity. Using (3.26), the steady-state concentration profile  $f_i$ of any species $i$ is given as
 \begin{equation} \dfrac{{\rm d} f_{i}}{{\rm d} y} ={-}\dfrac{f_{i}}{D c{\rm \pi}\eta d} \sum_{j=1}^{N} (m_{i} - m_{j}) f_{j} g\cos\theta. \end{equation}
Using the fact that the self-diffusion coefficients of different species are identical and are given by  $D = b \dot {\gamma } d^2$ for shear flows, the species concentration is described using the equation
 \begin{equation} \dfrac{{\rm d} f_{i}}{{\rm d} y} ={-}\dfrac{ f_{i} g \cos{\theta} }{b c {\rm \pi}\, |\tau_{yx}|\,d^3} \sum_{j=1}^{N} (m_{i} - m_{j})f_{j}. \end{equation}
The above equation represents the generalised form of (3.17)–(3.19) of the ternary mixture.
3.3. Multi-component mixture rheology and momentum balance equations
Equation (3.27) clearly shows that the local species concentration depends upon the local viscosity of the granular medium. This presence of viscosity in the density segregation model leads to the coupling of segregation with the rheology. The dense flow rheology of granular systems is described by the empirical dependence of the shear stress to pressure ratio (referred to as the effective friction coefficient  $\mu$) in terms of a non-dimensional inertial number $I$, i.e. ${|\tau _{yx}|}/{P}=\mu (I)$ (GDR MiDi 2004; Da Cruz et al. Reference Da Cruz, Emam, Prochnow, Roux and Chevoir2005). Jop, Forterre & Pouliquen (Reference Jop, Forterre and Pouliquen2006) suggested the following empirical form to capture the dependence of $\mu (I)$ on $I$:
$I$:
 \begin{equation} \mu(I)=\mu_{s}+\frac{\mu_{m}-\mu_{s}}{1+I_{0}/I}, \end{equation}
where  $\mu _{s}$, $\mu _{m}$ and $I_{0}$ are the rheological model parameters that need to be obtained from simulations/experiments, and the inertial number $I=\dot {\gamma } d/(P/\rho )^{1/2}$ depends upon the local shear rate $\dot {\gamma }$ and pressure $P$, in addition to the particle size $d$ and density $\rho$. Concerns about this rheology have been raised by various researchers (Barker et al. Reference Barker, Schaeffer, Bohórquez and Gray2015, Reference Barker, Schaeffer, Shearer and Gray2017; Heyman et al. Reference Heyman, Delannay, Tabuteau and Valance2017; Dsouza & Nott Reference Dsouza and Nott2020) since the $\mu \unicode{x2013}I$ rheology is found to be mathematically ill-posed at high and low inertial numbers. This ill-posedness of the rheological equation leads to grid-size-dependent results in the case of two-dimensional transient computations. However, these issues do not pose any problem for the steady-state flow property calculations in the present work. This rheological model is complemented with a dilatancy law describing the dependence of the solids volume fraction $\phi$ on the inertial number $I$. Most studies suggest a linear variation of $\phi$ with $I$:
$I$:
 \begin{equation} \phi=\phi_{max,l}-(\phi_{max,l}-\phi_{min,l})I, \end{equation}
where  $\phi _{max,l}$ and $\phi _{min,l}$ are model parameters.
Tripathi & Khakhar (Reference Tripathi and Khakhar2011b) have shown that the viscoplastic rheology of nearly monodisperse granular systems in the dense flow regime can be extended to binary granular mixtures in terms of a generalised inertial number  $I_{mix}=\dot {\gamma } d_{mix}/(P/\rho _{mix})^{1/2}$, where $d_{mix}$ and $\rho _{mix}$ are the local volume-averaged size and density of the particles. In the case of binary mixtures having same-size and different-density particles, $d_{mix}=d$ and $\rho _{mix}=\rho _1 f_1 + \rho _2 f_2$. Using this generalised inertial number rheology, the authors were able to predict the coupled effect of rheology and segregation in steady fully developed chute flows of binary mixtures differing in density for a range of density ratios (Tripathi & Khakhar Reference Tripathi and Khakhar2013). The authors also showed the presence of normal stress differences and accounted for this effect by a normal stress difference parameter $a$ that is used to correct the pressure calculated from momentum balance equations.
In this study, we extend the binary mixture rheology to multi-component mixtures by accounting for the presence of all the species in the expression of local volume average density. The local average density of particles in the case of a multi-component mixture is calculated as
 \begin{equation} \rho_{mix}(y)=\sum_{i=1}^{N} \rho_i f_i, \end{equation}
which requires knowledge of the concentrations of all the species  $f_i$. The calculation of the species concentration $f_i$ (using (3.28)) requires knowledge of the shear stress $\tau _{yx}$. This calculation of the shear stress (using (3.32)) requires knowledge of $\rho _{mix}$, which in turn depends upon the species concentration $f_i$ (see (3.31)). This interdependence of the concentration and the shear stress on each other is indicative of the inter-coupling of rheology and segregation with each other. In order to be able to predict the species concentrations due to the segregation of different density particles in steady fully developed chute flow, the momentum balance equations need to be solved along with the rheological model and density segregation model. The values of the rheological parameters are taken from Tripathi & Khakhar (Reference Tripathi and Khakhar2011b) and are reported in table 1.
Table 1. Values of the rheological model parameters (as in Tripathi & Khakhar Reference Tripathi and Khakhar2011b) used in this study.
Solving momentum balance equations for an incompressible, steady and fully developed flow over an inclined plane at inclination angle  $\theta$ in the $x$- and $y$-directions leads to
 $$\begin{gather} \tau_{yx}(y) ={-}g \sin \theta \int_{y}^{H} \phi \rho_{mix}\, {{\rm d} y}, \end{gather}$$
 $$\begin{gather}P (y) = g \cos \theta (1 - a \tan \theta )\int_{y}^{H} \phi \rho_{mix} \,{{\rm d} y}, \end{gather}$$
where  $H$ is the thickness of the flowing granular layer (known from the DEM simulations), and the parameter $a$ accounts for the anisotropy of the stress tensor due to non-zero normal stress differences (Tripathi & Khakhar Reference Tripathi and Khakhar2011b). Calculation of $\tau _{yx}$ and $P$ requires knowledge of $\phi$ and $\rho _{mix}$. Following Tripathi & Khakhar (Reference Tripathi and Khakhar2011b), the solids fraction $\phi$ is obtained by using the expression for the generalised inertial number $I_{mix}$ in the dilatancy law
 \begin{equation} \phi=\phi_{max,l}-(\phi_{max,l}-\phi_{min,l})I_{mix}. \end{equation}
The iterative procedure to solve the momentum balance equations along with the mixture rheological model and density segregation model is described in the next subsection.
3.4. Numerical solution of the equations
Using (3.32) and (3.33), the value of the effective friction coefficient at any inclination  $\theta$ is calculated as
 \begin{equation} \frac{|\tau_{yx}|}{P}=\mu(I) = \dfrac{\tan\theta} { 1 - a \tan\theta}. \end{equation}
The inertial number  $I$ is calculated by rearranging the empirical form of $\mu (I)$ as
 \begin{equation} I_{mix} =I_{o}\,\dfrac{\mu(I)-\mu_{s}}{\mu_{m}-\mu(I)}, \end{equation}
where we use the value of  $\mu (I)$ obtained in terms of $\theta$ from the previous equation. The calculation of the shear rate $\dot {\gamma }$ is done from the previously calculated value of the inertial number $I_{mix}$ using the relation
 \begin{equation} \dot{\gamma}(y)=\dfrac{I_{mix}}{d}\sqrt{\dfrac{P}{\rho_{mix}}}. \end{equation}
Finally, the velocity profile  $v_{x}(y)$ is obtained by integrating the shear rate as
 \begin{equation} v_x(y)= v_{slip} + \int_{0}^{y}\dot{\gamma} \,{{\rm d} y}, \end{equation}
where  $v_{slip}$ is the slip velocity at the chute base. We use a rough and bumpy base so that $v_{slip} \approx 0$ for all the cases considered in this study. However, the prediction of the shear rate using (3.37) requires knowledge of the local mixture density $\rho _{mix}$ as well as the local pressure $P$. Since the calculation of these properties requires knowledge of species concentration $f_i$, we utilise the multi-component segregation model proposed before as follows.
Algorithm 1: Algorithm used for predicting properties of an N-component mixture

The segregation model presented before requires that the system of equations represented by (3.28) be solved simultaneously for all  $N$ components of the mixture. These equations are solved iteratively for $N-1$ components in MATLAB using the ode45 solver, while the $N{\rm th}$ species concentration is calculated as $f_N = 1 - \sum _{i=1}^{N-1}f_i$. To solve these ordinary differential equations, the equations are expressed in symbolic form. While all other terms in (3.28) are in symbolic form, the shear stress $\tau _{yx}$ is calculated numerically using (3.31) and (3.32). Thus, given a set of values of $f_i$ at each $y$, we obtain values of $\tau _{yx}$ at each $y$. To represent the $\tau _{yx}(y)$ in symbolic form, we fit a polynomial using the poly-fit function in MATLAB, and obtain $\tau _{yx}(y)$ as a function of $y$. Note that this curve fitting is used only to represent the calculated shear stress data as a polynomial, hence any curve that is able to represent the data well suffices. Our simulation results show that while a linear fit seems to work well for density ratios up to 1.5, it fails for higher density ratios. Similarly, a quadratic fit also seems to work for most of the cases but fails in the case of mixtures with density ratios larger than 3. Given the monotonic variation of the shear stress, a cubic polynomial fit does not capture $\tau _{yx}$ variation with $y$. A quartic polynomial fit for $\tau _{yx}$ with $y$ works for all the cases, hence a fourth-order polynomial is fitted to $\tau _{yx}$.
The boundary conditions are required to solve the system of equations represented by (3.28). We use a guess value  $f_{i0} = f_{i}(y=0)$, where $f_{i0}$ is the concentration of the $i{\rm th}$ species at the base $y=0$. Note that the species concentrations at the base are not known a priori and remain to be determined. To determine these $f_{i0}$ values, we use the species mass balance equation for each species. For the appropriate value of $f_{i0}$ to be used as a boundary condition, the total species concentration of the layer must be equal to $f_{i}^{T}$, i.e. $({1}/{H}) \int _{0}^{H} f_{i} \,{{\rm d} y} = f_{i}^{T}$, where $f_{i}^{T}$ is the total concentration of the $i{\rm th}$ species. This species balance condition is used as the convergence criterion for calculating the unknown $f_{i0}$ value at the base $y=0$. We use the following condition for convergence of $f_i$ profiles:
 \begin{equation} \sqrt{\sum_{i=1}^{N} \left|\dfrac{1}{H} \int_{0}^{H} f_{i}\, {{\rm d} y} - f_{i}^{T}\right|^2 } < 10^{{-}4}. \end{equation}
The guess values  $f_{i0}$ are updated iteratively as follows:
 \begin{equation} f_{i0} = \begin{cases} f_{i0} + \Delta f_0, & \text{if} \ f_{i}^{T} > \dfrac{1}{H} \displaystyle\int_{0}^{H} f_{i}\, {{\rm d} y}, \\[10pt] f_{i0} - \Delta f_0, & \text{if} \ f_{i}^{T} < \dfrac{1}{H} \displaystyle\int_{0}^{H} f_{i}\, {{\rm d} y}, \end{cases} \end{equation}
until the convergence criterion given by (3.39) is satisfied. We choose  $\Delta f_0$ as $10^{-5}$ in this study, and report the algorithm for species concentration and other mixture properties in Algorithm 1.
4. Density segregation of ternary mixtures
One of the key assumptions in the theory proposed in § 3 is that the diffusivity of all the species in a mixture scales with the shear rate and squared particle size, i.e.  $D=b\dot {\gamma }d^2$ (see (3.16)). Since the size of all the particles is identical, this scaling suggests that the diffusivities of all the species are identical, irrespective of their densities. We first report results that confirm the validity of this assumption. Following Tripathi & Khakhar (Reference Tripathi and Khakhar2013), the diffusivity of the species is calculated as half of the slope of the graph of the mean square displacement (MSD) versus time. The MSDs are calculated for each bin along the height, and the initial position is the basis for each particle's diffusion. The self-diffusivity of each species is shown in figure 3(a) for steady flow of a ternary mixture over an inclination angle $\theta = 25^\circ$. Figures 3(b) and 3(c) show the diffusivity values of different species for a quaternary and quinary mixture, respectively. In all the cases, the diffusivities of various species are found to be identical to each other. Due to the segregation of the species across the flowing layer thickness, the diffusivity is calculated as the volume-averaged diffusivity of the species, i.e. $D=\sum f_i D_i$.

Figure 3. Variation of species self-diffusivity ( $D_i$) with $y$ for (a) a ternary mixture, (b) a quaternary mixture, and (c) a quinary mixture, flowing at inclination angle $\theta = 25^\circ$. The black line represents the volume-averaged diffusivity of the mixture.
Figure 4 shows the variation of the diffusivity with shear rate. Circular symbols correspond to data for ternary mixtures with equal composition of each species for three different sets of density ratios, 1.00 : 1.25 : 1.50, 1 : 2 : 3 and 1 : 3 : 5, at four different inclination angles,  $\theta = 23^\circ$, $25^\circ$, $27^\circ$ and $29^\circ$. The density ratios are based on the lightest particle density so that the density ratio 1 represents the lightest particle. Square symbols correspond to quaternary mixtures with equal composition of each species for three different sets of density ratios, 1.00 : 1.25 : 1.50 : 1.75, 1.0 : 1.5 : 2.0 : 2.5 and 1 : 2 : 3 : 4, at inclination angle $\theta = 25^\circ$. Triangles correspond to a quinary mixture with equal composition of each species for density ratio 1.0 : 1.5 : 2.0 : 2.5 : 3.0 at inclination angle $\theta = 25^\circ$. Data near the base and free surface are omitted. Evidently, a linear fit describes the data for all the cases; the slope of the fitted line is obtained as $0.04$ and is used in the theoretical predictions in this study. This value of parameter $b$ is nearly identical to the value 0.041 used in Tripathi & Khakhar (Reference Tripathi and Khakhar2013), and compares well with the values reported in other studies (0.042 by Fry et al. (Reference Fry, Umbanhowar, Ottino and Lueptow2019), and 0.046 by Duan et al. (Reference Duan, Umbanhowar, Ottino and Lueptow2021)). In the remaining part of this section, we report results for a large variety of ternary mixtures for different inclination angles, density ratios, and compositions. We use our particle-level force-based theory to predict accurately the segregation, along with other flow properties of the mixtures.

Figure 4. Variation of diffusivity  $D$ with $\dot {\gamma }$ for ternary, quaternary and quinary mixtures.
We first report results for a ternary mixture with density ratios  $\rho _L:\rho _M:\rho _H = 1:2:3$ having equal composition of each species at two different inclination angles, $\theta = 23^\circ$ and $29^\circ$. The simulations are performed starting from an initial condition of a completely segregated mixture. The steady-state concentration fields of light, medium and heavy species are shown in figures 5(a)–5(c), while figures 5(d)–5( f) show the shear stress, pressure and velocity profile variations with $y$ at steady state. Symbols represent the results obtained from DEM simulations. A completely segregated mixture will be represented by a step-like variation on the $y\unicode{x2013}f$ graph, while a well-mixed uniform mixture in the absence of segregation will be represented as a vertical line on the $y\unicode{x2013}f$ graph. Figures 5(a)–5(c) show that the concentration profile of all three species tends to be less segregated (i.e. the slope of the $y\unicode{x2013}f$ curve shifts towards the vertical line) with an increase in the inclination angle. At higher inclination angles, the concentration of the medium-mass particles increases (figure 5b), while that of heavy particles decreases (figure 5c) near the base. This is due to the fact that the diffusive mixing enhances due to higher shear rates at large inclinations, and the segregation becomes less sharp. The bulk density of the layer is smallest at the free surface due to the large concentration of light particles, and highest near the base due to large concentrations of heavy particles. This increase in the bulk density of the layer towards the base leads to a nonlinear variation of shear stress (figure 5d) and pressure (figure 5e) with $y$. Solid lines in figures 5(a)–5( f) correspond to theoretical predictions. The concentration fields of all three species are very well predicted by the theory described in § 3. The change in inclination angle $\theta$ from $23^\circ$ to $29^\circ$ leads to a noticeable change in the concentration profile, which is very well captured by the present theory. In addition, the variation of shear stress, pressure and velocity across the layer are predicted with very good accuracy using the present theory.

Figure 5. Comparison of the theoretical predictions (lines) with simulation results (symbols) for a ternary mixture at different inclination angles ( $\theta$) for equal composition (33.33 %) of each species at a particular density ratio $\rho _H:\rho _M:\rho _L = 3:2:1$.
4.1. Effect of density ratios
Figure 6 shows the segregation of mixtures with different density ratios. The simulations are performed at inclination angle  $\theta =25^\circ$ with equal compositions of each species, i.e. $f_L^T=f_M^T=f_H^T=1/3$. Figure 6(a) shows the snapshot for density ratio $\rho _H:\rho _M:\rho _L=1.50:1.25:1.00$; figure 6(b) shows the snapshot for density ratio $\rho _H:\rho _M:\rho _L=3:2:1$; figure 6(c) shows the snapshot for density ratio $\rho _H:\rho _M:\rho _L=5:3:1$; and figures 6(d)–6( f) show the concentration profiles for the respective cases below the snapshots.

Figure 6. Simulation snapshots and comparison of the theoretical predictions (lines) with simulation results (symbols) for ternary mixtures for different density ratios with equal composition (33.33 %) of each species in the ternary mixture at inclination angle  $\theta = 25^\circ$.
For small differences in particle densities, figure 6(a) shows that the region near the free surface resembles a binary mixture with a few medium-density (red) particles dispersed in light (blue) particles. This is also evident from figure 6(d), where  $f_L>f_M$ and $f_H\rightarrow 0$ near the free surface. The rest of the layer consists of a significant fraction of all three species; the concentration of heavy (green) particles increases, while that of light particles decreases towards the base. The concentration of medium-density particles increases from ${\approx }10\,\%$ near the free surface to ${\approx }40\,\%$ at $y=20$, and then shows little variation in the remaining part of the layer.
While the light particles do not undergo complete segregation for small density ratios, figures 6(b), 6(e) and 6(c), 6( f) show that a pure layer of light particles near the free surface is observable for higher-density ratios with  $f_M=f_H=0$. A binary mixture of medium and heavy particles consisting of larger fractions of heavy and smaller fractions of medium-density particles is found in the lower part of the layer, with $f_L=0$ in both cases. This is in contrast to the results shown for the case of a low density ratio where the lower portion of the layer consisted of all three species. The middle portion of the layer consists of a ternary mixture rich in medium-density particles. The concentration of light particles keeps increasing, and that of heavy particles keeps decreasing with increasing distance from the base. The medium-density particle concentration shows non-monotonic behaviour with $y$ and shows the maximum concentration in the middle of the layer. The theoretical predictions of the concentrations of all the species, shown using solid lines, are found to be in excellent agreement with the theory for all the density ratios considered in this study. A comparison of figures 6(d), 6(e) and 6( f) indicates that the extent of segregation in the layer increases with the increasing density difference among the species.
Figures 6(g) and 6(h) show that the pressure and shear stress profiles vary linearly with  $y$ near the free surface. This is attributed to the high concentration of light particles near the free surface, which leads to nearly constant bulk density of the layer near the free surface for all three cases. However, the nonlinear behaviour of the shear stress and pressure is exhibited in the lower part of the layer. As discussed before, this nonlinear behaviour is attributed to the increasing bulk density of the layer towards the base due to the increasing concentration of heavy particles near the base. With increasing density ratios, the magnitudes of shear stress and pressure increase due to increased bulk density of the layer. Figure 6(i) shows that an increase in the density ratios leads to a slight decrease in the layer velocity. These interesting variations of the shear stress, pressure and velocity are very well captured by the theory.
4.2. Influence of species total compositions
Figure 7 shows the results for three different mixture compositions of heavy, medium and light particles. Symbols represent the simulation data for density ratio  $\rho _L:\rho _M:\rho _H = 1:2:3$ at inclination angle $\theta = 25^\circ$. The total concentration of one of the species in the mixture is $50\,\%$, while the concentration of the other two species is $25\,\%$. Figures 7(a), 7(b) and 7(c) show steady-state snapshots of the system corresponding to $50\,\%$ light (blue), $50\,\%$ medium-density (red) and $50\,\%$ heavy (green) particles, respectively. Figures 7(d)–7( f) show concentration profiles for the respective mixtures below the snapshots. In all the cases, a pure layer of light (blue) particles is observable near the free surface. The thickness of the pure light particles layer is around one-third of the layer thickness in case $f_L^T=50\,\%$ and gets reduced in proportion of the total composition in figures 7(e) and 7( f). Beneath this pure layer of light particles, the concentration of light particles keeps reducing, while that of heavy particles keeps increasing as one moves towards the base.

Figure 7. Simulation snapshots and comparison of the theoretical predictions (lines) with simulation results (symbols) for ternary mixtures for various compositions of each species with density ratios  $\rho _{H} : \rho _{M}:\rho _{L} = 3:2:1$ at inclination angle $\theta = 25^\circ$.
The concentration profiles of heavy particles seem to be similar in mixtures having identical total heavy particle composition as shown in figures 7(d) and 7(e). Similarly, the light particle concentrations also appear to be very similar in mixtures with identical total light particle composition (figures 7e, f). The concentrations of medium-density particles, however, differ significantly from each other in figures 7(d) and 7( f), despite having identical total composition. This shows a non-monotonic variation with  $y$, and displays a maximum concentration somewhere in the middle part of the layer. As before, the theoretical predictions shown using solid lines capture all these features very well, including the nonlinear variation of shear stress (figure 7g) and pressure (figure 7h). Figure 7(i) illustrates that the mixture velocity profiles show very little effect of the mixture composition, which is also reflected in the theoretical predictions.
Figures 8(a)–8(c) show the concentration variations for mixtures having high concentration of two species with very little concentration of the third species. Specifically, figure 8(a) shows the concentration variation for a mixture with  $50\,\%$ composition of the light species, $40\,\%$ composition of the medium species, and $10\,\%$ composition of the heavy species. Figure 8(b) shows the concentration variation for a mixture with $10\,\%$ light, $50\,\%$ medium and $40\,\%$ heavy species. Similarly, figure 8(c) shows the concentration variation for a mixture with $40\,\%$ light, $10\,\%$ medium and $50\,\%$ heavy species. Figures 8(d)–8( f) show results for three different mixtures having species concentration combinations of $70\,\%$, $20\,\%$ and $10\,\%$. As before, the symbols represent the simulation data for density ratio ( $\rho _L:\rho _M:\rho _H = 1:2:3)$ at inclination angle $\theta = 25^\circ$, and lines represent the theoretical predictions. The concentration profiles of heavy, medium and light particles for all these cases are captured very well by the theory. The variations of shear stress, pressure and velocity (not shown) are similar to those reported in figure 7. The theory captures accurately these mixture properties for all these cases as well. These results establish that the theory presented in this work is able to predict accurately various properties of interest for a wide range of compositions of ternary mixtures.

Figure 8. Comparison of the theoretical predictions (lines) with simulation results (symbols) for ternary mixture for various compositions of each species with the same density ratios  $\rho _{H} : \rho _{M}:\rho _{L} = 3:2:1$ at inclination angle $\theta = 25^\circ$.
5. Density segregation of quaternary and quinary mixtures
Motivated by the success of our theoretical predictions for a large variety of ternary mixtures, in this section, we explore the suitability of our theory for mixtures having more than three components. Results for quaternary mixtures having four components and quinary mixtures having five components are discussed next. The lightest species is termed as species 1, and the higher-density species are represented using larger species index numbers. Thus  $\rho _i<\rho _j$ if $i< j$ in these multi-component mixtures.
Figures 9(a)–9(c) show the snapshots of three quaternary mixtures with different sets of density ratios of the species. Figures 9(d), 9(e) and 9( f) represent the concentration fields corresponding to density ratios  $1:1.25:1.5:1.75$, $1:1.5:2:2.5$ and $1:2:3:4$, respectively. In all the cases, total compositions of all the species are equal (i.e. $25\,\%$ each) and the simulations are performed at an inclination angle $\theta = 25^\circ$. The mixture with lowest density contrast, $\rho _4/\rho _1=1.75$, shows non-zero concentration of all four species through most of the layer (figures 9a,d). As expected, the region near the free surface is rich in lightest (blue) particles, while the region near the base is rich in heaviest (green) particles. Figures 9(b), 9(c), 9(e) and 9( f) show that this behaviour is observed for other density ratios as well. The absence of the lightest species particles near the base is evident at higher density ratios, while the region near the free surface is comprised of only the lightest particles, indicating complete segregation of light particles in the upper part of the layer. The region near the base shows very little concentration of the second-lightest species for these density ratios, and it consists of mostly the two heavier species. As in the case of ternary mixtures, the concentration of the heaviest species keeps decreasing, while that of the lightest species keeps increasing towards the free surface. The concentrations of the other two species having intermediate densities exhibit non-monotonic behaviour and show a maximum concentration somewhere in the middle portion of the layer. The concentration fields obtained from the theory (shown using solid lines) are found to be in excellent agreement with the DEM simulations (symbols) for all the species and density ratios.

Figure 9. Simulation snapshots and comparison of the theoretical predictions (lines) with simulation results (symbols) for quaternary mixtures with equal composition of each species for different density ratios and inclination angle  $\theta =25^\circ$.
Figures 9(g)–9(i) show that shear stress, pressure and velocity profiles are also very well predicted by the theory. For low density contrast, the shear stress and pressure profiles are found to deviate only marginally from linear variation. This indicates that the bulk density of the layer remains nearly the same across the layer height due to the absence of strong segregation. At higher density ratios, however, the increased extent of segregation leads to larger deviations from the linear variation. The theory captures these variations very well, along with the small changes that are observable in the velocity profile.
We next report results obtained for a five-component mixture having equal compositions of species. The simulation is performed starting from an initial configuration of completely segregated, density-wise inversely graded, arrangement of the species. Figure 10(a) shows the snapshot for this five component mixture, with density ratios  $\rho _1:\rho _2:\rho _3:\rho _4:\rho _5 = 1:1.5:2:2.5:3$. Figure 10(b) shows the concentration fields obtained from simulations (symbols) along with the theoretical predictions (solid lines). As before, a region rich in the lightest species 1 particles is observed near the free surface, with very few particles of other species. As we move towards the base, the concentration of the lightest species keeps decreasing, while that of the highest-density particles keeps increasing. The concentration fields of the species having intermediate densities show non-monotonic behaviour with maximum concentration in the bulk region of the layer. The concentration fields of all the species obtained from DEM simulations match very well with the theoretically predicted concentration fields. Figure 10(c) shows that the velocity profile is also predicted well by the theory for the quinary mixture.

Figure 10. Simulation snapshot and comparison of the theoretical predictions (lines) with simulation results (symbols) for a quinary mixture with composition of each species  $20\,\%$ for different density ratios at inclination angle $\theta =25^\circ$.
6. Discussion
6.1. Initial configuration independent steady state
The theory proposed in this work gives a unique concentration profile corresponding to the steady-state configuration. In order to verify the uniqueness of the steady-state configuration, we perform simulations for three different initial configurations of ternary mixtures. In the initial configuration utilised in the simulations reported so far, the light (blue) species is kept near the base, and the highest-density (green) species is situated near the free surface (see figure 11a). This case is referred to as ‘light near base’ (LNB). In the second case, the light species is kept near the free surface, and the heavy species is kept near the base, referred to as ‘heavy near base’ (HNB) (see figure 11b). The medium-density (red) species is sandwiched in between the two layers of heavy and light species for both these cases. In the ‘Mixed’ case (see figure 11c), the particles of different densities were well mixed with each other all across the layer. Figures 11(d) and 11(e) show the evolution of the centre of mass of the light and heavy species starting from the three different initial configurations. As expected, the centre of mass of the light species rises with time from its initial position and reaches the steady-state position for the LNB and Mixed cases (figure 11d). Little change in the position of the centre of mass of the light species for the HNB case is observed since the initial centre of mass position is nearly the same as that of the steady state. However, the steady-state centre of mass position of the light species for all three configurations is found to be the same. Similarly, figure 11(e) shows that while the evolution of the centre of mass of the heavy species is different for different initial configurations, the steady-state centre of mass locations for all three configurations are nearly identical. The results for the medium-density species (not shown here) also show that the steady-state centre of mass positions of the medium-density species are identical for the three initial configurations. In addition to the centre of mass positions, we also confirm that the steady-state concentration profiles for each of the three species are identical for the three different initial configurations. We have also performed simulations for a few other possible initial configurations and find that the steady-state centre of mass positions and the concentration profiles for all the species are identical for all the cases. Thus we conclude that the steady-state profiles observed in our simulations as well as those predicted from our theoretical formulation are indeed unique.

Figure 11. Snapshots showing initial configuration for a ternary mixture of equal compositions of each species with density ratio  $\rho _{H} : \rho _{M}:\rho _{L} = 3:2:1$ at inclination angle $\theta = 25^\circ$ for (a) light near base (LNB) case, (b) heavy near base (HNB) case, and (c) mixed case. Evolution of the centre of mass of (d) the light species and (e) the heavy species with time starting from different initial configurations.
However, the evolution of the centre of mass with time is found to be dependent on the initial configuration of the mixture. The centre of mass variation for the Mixed and HNB cases can be described well by an exponential fit (not shown) and hence seem to be governed by a single time scale (see figures 11d,e). In contrast, the centre of mass variation for the LNB case shows a sharp rise for the initial  ${\approx }300$ time units followed by a more gradual rise over a much longer duration. Such a variation indicates the existence of two different segregation time scales for this case. This interesting observation needs more detailed investigation and requires solving the momentum balance equation by accounting for the time-dependent variation of various properties of interest (such as velocity and viscosity) while simultaneously accounting for the time-dependent variation of the species composition. The problem of transient flow of granular mixtures undergoing segregation is beyond the scope of the present work and hence is not discussed further.
6.2. Influence of normal stress differences on theoretical predictions
The predictions for the species concentration, shear stress and pressure for different mixtures compare very well with the DEM simulations. However, the predictions for the mixture velocity at the free surface seem to differ by nearly 10 % from the DEM simulation results. Given the nearly perfect match of the other properties, this noticeable difference in the velocity requires explanation. Since this work utilises the mixture rheological parameters of Tripathi & Khakhar (Reference Tripathi and Khakhar2011b), we first observe the difference between the predicted mixture velocities and DEM simulations for binary mixtures as reported by these authors. We notice that differences of similar magnitude are observable in the case of binary mixtures (see figure 23 of Tripathi & Khakhar Reference Tripathi and Khakhar2011b). Since this result for the binary case uses the concentration variation as an input to the theory as obtained from the DEM simulation and not from any segregation model, we conclude that the source of this difference lies in the rheological model and not in the segregation model.
The results reported for the binary mixture case (Tripathi & Khakhar Reference Tripathi and Khakhar2011b) show that the normal stress difference has more significant influence on the predicted velocity profile as compared to shear stress etc. Hence in figure 12, we report the variation of the ratio of first and second normal stress differences to the magnitude of the shear stress for binary as well as three different ternary mixtures. Instead of using data only at steady state as reported in Tripathi & Khakhar (Reference Tripathi and Khakhar2011b), we use data as the segregation evolves during the flow for different inclinations in the range  $23^\circ \unicode{x2013}29^\circ$. This helps us to get more accurate and evenly distributed data over the entire range of inertial numbers. Figure 12(a) shows the variation of the ratio of $N_1=\tau _{xx}-\tau _{yy}$ to $|\tau _{yx}|$ with the inertial number $I_{mix}$. Figure 12(b) shows the variation of the ratio of $N_2=\tau _{yy}-\tau _{zz}$ to $|\tau _{yx}|$ with $I_{mix}$. While the assumption of nearly constant $N_2/|\tau _{yx}|$ seems to be correct, a linear variation of $N_1/|\tau _{yx}|$ with $I_{mix}$ is evident. A careful look at figure 21(a) of Tripathi & Khakhar (Reference Tripathi and Khakhar2011b) indeed confirms this weak linear dependence of the first normal stress difference to shear stress ratio with the inertial number. This linear dependence has been ignored in the rheological model proposed by Tripathi & Khakhar (Reference Tripathi and Khakhar2011b); instead, a constant value of $N_1/|\tau _{yx}|=0.1$ is assumed for all inertial numbers (shown using a dashed line in figure 12a). Usage of constant values for $N_1/|\tau _{yx}|$ and $N_1/|\tau _{yx}|$ over the entire range of $I_{mix}$ leads to the constant value of the anisotropy parameter $a=2/30$. While this assumption indeed simplifies the algorithm for calculation of various properties, we find that it leads to a small error in the calculation of inertial number that is manifested prominently in the values of the predicted velocity. In order to account for the linear variation of the ratio of the first normal stress difference to the magnitude of the shear stress, the calculation of the inertial number at any inclination $\theta$ requires a change in the algorithm given in the theory section. Instead, we use an iterative procedure to correct the obtained value of the inertial number before using it to predict the other properties as discussed below.

Figure 12. Variation of the ratio of (a) the first ( $\tau _{xx} - \tau _{yy}$) and (b) the second ( $\tau _{yy} - \tau _{zz}$) normal stress differences to the magnitude of shear stress $|\tau _{yx}|$ for an equal-composition binary mixture of density ratio $\rho _H/\rho _L=1.5$ (black symbols) and three different equal composition ternary mixtures. Three different sets of $\rho _L:\rho _M:\rho _H$, equal to $1:2:3$ (blue symbols), $1:1.25:1.5$ (red symbols) and $1:3:5$ (green symbols), are used for ternary mixtures. Solid lines are fitted to the data, and dashed lines are values used by Tripathi & Khakhar (Reference Tripathi and Khakhar2011b).
The equation of the solid line fitted to the data in figure 12(a) is  $N_1/|\tau _{yx}| = 0.27 I_{mix}$. Similarly, the solid line in figure 12(b) is $N_2/|\tau _{yx}| = 0.35$. Using these normal stress difference relations along with the identity $\tau _{xx}+\tau _{yy}+\tau _{zz}=0$, we obtain the stress anisotropy parameter $a = (0.35 - 0.27 I_{mix})/3$. Starting with the initial guess $a=2/30$, we compute the effective friction coefficient $\mu (I)$ using (3.35), and the mixture inertial number $I_{mix}$ using (3.36). Using this computed value of $I_{mix}$, we then re-compute the value of parameter $a = (0.35 - 0.27 I_{mix})/3$ and use this to compute $\mu (I)$ and $I_{mix}$ using (3.35) and (3.36). The above steps are repeated in an iterative manner until the values of stress anisotropy parameter $a$ and the value of the inertial number $I_{mix}$ converge. We use these converged values of $a$ and $I_{mix}$ following the algorithm mentioned in the theory section to predict concentration profiles and all the flow properties. The velocity profiles predicted using this procedure are reported as solid lines in figure 13(a) for equal composition of two different ternary mixtures. Figure 13(b) shows the revised predictions for a quinary mixture, using the solid line. The earlier predictions using the normal stress difference law by Tripathi & Khakhar (Reference Tripathi and Khakhar2011b) are shown using dashed lines, and the DEM simulation data are shown using symbols. Evidently, the velocity profiles obtained by accounting for the normal stress difference dependence on the inertial number are in much better agreement with the DEM data compared to the case assuming a constant ratio of the normal stress difference to the magnitude of the shear stress. While we report the revised velocity profiles for only three different mixtures here, we find that accounting for the revised normal stress difference laws eliminates the velocity difference observed in all the cases considered in this work. The predictions for the shear stress, pressure and species concentration are affected only marginally by this accurate accounting of the normal stress differences.

Figure 13. Predictions of the velocity profile (solid lines) for (a) two different ternary mixtures, and (b) a quinary mixture (as in figure 10a) having equal composition of the species using the revised normal stress difference laws. Symbols represent the DEM simulation results, and dashed lines represent the predictions using normal stress difference laws from Tripathi & Khakhar (Reference Tripathi and Khakhar2011b).
7. Summary
In this work, a particle force-based theory for predicting the segregation of multi-component granular mixtures differing in density in periodic chute flows is proposed. In contrast to the approaches that utilise either empirical correlations (Xiao et al. Reference Xiao, Umbanhowar, Ottino and Lueptow2016; Jones et al. Reference Jones, Isner, Xiao, Ottino, Umbanhowar and Lueptow2018; Deng et al. Reference Deng, Umbanhowar, Ottino and Lueptow2019) or similar expressions (Tunuguntla et al. Reference Tunuguntla, Bokhove and Thornton2014; Gray & Ancey Reference Gray and Ancey2015) relating percolation velocity to the shear rate, species composition and density ratio, the present theoretical approach obtains the percolation velocity starting from particle-level forces acting on the particles and using the Stokes drag on the particles due to their movement in the granular media. The expression for the segregation velocity obtained from the particle force-based approach is found to be proportional to the density difference. This is in contrast to the empirical approach, where the segregation velocity is proportional to the logarithm of the density ratios (Xiao et al. Reference Xiao, Umbanhowar, Ottino and Lueptow2016). Unlike most other works available in the literature (except that by Barker et al. Reference Barker, Rauter, Maguire, Johnson and Gray2021), the present work does not require a priori knowledge of the flow properties. Instead, the present approach permits coupling of the momentum balance equations with a multi-component mixture rheological model along with a multi-component segregation model, and enables prediction of all the flow properties of interest in chute flows.
In order to test the validity of our theoretical approach, we performed extensive DEM simulations exploring a large range of density ratios ( $1.25\leqslant \rho _H/\rho _L\leqslant 5$) and compositions ( $0.1\leqslant f^T_i \leqslant 0.7$) for steady flow of ternary mixtures at different inclination angles ( $23^\circ \leqslant \theta \leqslant 29^\circ$). The results for species concentration, velocity, shear stress and pressure obtained from the DEM simulations are compared with the predictions from the theory. We find that the theory predicts accurately the steady-state flow properties for the entire range of inclination angles, density ratios and mixture compositions for ternary mixtures. The concentration profiles and the centre of mass positions for all three species at the steady state are found to be identical irrespective of the initial configuration of the species in our DEM simulations. In addition, we performed DEM simulations for a quaternary mixture having equal composition of four components, as well as quinary mixtures having equal composition of five components. The flow properties obtained from these DEM simulation results are also found to be in good agreement with the predictions from the multi-component theory. However, the predicted values for the maximum velocity are found to be slightly smaller than those observed in the simulations. This difference in the velocity profile predictions can be eliminated by accounting for the variation of the first normal stress difference with the inertial number along with a revised value of second normal stress difference to shear stress ratio. These results establish that the particle force-based segregation theory presented in this work is capable of predicting accurately the steady-state density segregation in a large variety of mixtures.
Segregation due to density differences in binary mixtures as well as mixtures having a distribution of particle densities have been predicted successfully in heap and rotating cylinder flows by Xiao et al. (Reference Xiao, Umbanhowar, Ottino and Lueptow2016), Jones et al. (Reference Jones, Isner, Xiao, Ottino, Umbanhowar and Lueptow2018) and Deng et al. (Reference Deng, Umbanhowar, Ottino and Lueptow2019) using empirical correlations for the percolation velocities. However, the applicability of this empirical approach to predict density segregation in the case of steady, fully developed chute flows has not yet been explored. A detailed comparison of the empirical and particle force-based segregation models is currently under investigation and will be reported in the near future. The present work essentially generalises the particle force-based segregation model of binary mixtures by Tripathi & Khakhar (Reference Tripathi and Khakhar2013) to multi-component mixtures. The theory makes use of the inertial number based rheology to estimate the viscosity and uses Stokes’ drag relation to obtain the segregation velocity of the species. The segregation model obtained using this approach is able to predict the segregation very well in the dense flow regime. Recent work by Jing et al. (Reference Jing, Ottino, Umbanhowar and Lueptow2022) shows that the Stokes drag type relation holds for Reynolds number up to unity for a wide range of size and density ratios. The deviations from Stokes drag are also observed at higher Reynolds numbers due to inertial effects. While a Reynolds number less than unity is common for the dense flow regime, higher Reynolds numbers may be observable in the case of rapid dilute flows. Patro et al. (Reference Patro, Prasad, Tripathi, Kumar and Tripathi2021) have shown that a modified inertial number based rheological model can describe the granular flow behaviour not only for the dense regime but also for the rapid, dilute flow regime. The particle force-based approach presented in this work can also be useful for predicting segregation in such dilute flows by coupling the modified rheology with the findings of Jing et al. (Reference Jing, Ottino, Umbanhowar and Lueptow2022).
A particle force-based size segregation theory for binary mixtures has also been proposed recently by Tripathi et al. (Reference Tripathi, Kumar, Nema and Khakhar2021). The approach presented in this work can be useful for generalising the binary mixture size segregation theory to the multi-component mixtures differing in size as well. Interestingly, the current theoretical formulation leads to a segregation flux having the same species concentration dependence as proposed by Gray & Ancey (Reference Gray and Ancey2011) for a multi-component mixture of different-size particles. Since the segregation flux expression in this work is derived from first principles using the forces acting on the particle level, it permits us to obtain the explicit dependence of the segregation coefficients used by Gray & Ancey (Reference Gray and Ancey2011) on relevant properties of the species and the mixture. Specifically, we find that the segregation coefficients depend on the mass differences between the species, particle size, drag coefficient, gravitational acceleration component along the flow direction and local viscosity for same-size different-density mixtures. A particle force-based theory for multi-component size mixtures may be able to give more insights about segregation coefficients.
One of the key limitations of the present work is that it considers a periodic chute and ignores the variations along the flow direction. In reality, flow over inclined surfaces evolves along the flow direction before achieving a steady fully developed flow. In order to account for such effects, the momentum balance equations need to account for the change in the velocity with time as well as position along the flow direction. One possible way is to follow the continuum simulations approach used by Staron, Lagrée & Popinet (Reference Staron, Lagrée and Popinet2014) and Zhou et al. (Reference Zhou, Lagrée, Popinet, Ruyer and Aussillous2017). These authors use the  $\mu \unicode{x2013}I$ rheology to simulate granular flows in more complex situations such as silo flows, which can be extended easily to other geometries such as rotating cylinders and heap flows. However, the time-dependent equation for the species concentration also needs to be solved, along with the momentum balance and constitutive equations to account for the convective contribution due to the concentration variation along the flow direction. Recent work by Barker et al. (Reference Barker, Rauter, Maguire, Johnson and Gray2021) accounts for all these effects for multi-component mixtures of different-size particles in a rotating cylinder as well as over an inclined chute. A similar approach can also be useful for exploring the time-dependent evolution of the multi-component density mixtures flowing over an inclined chute by using the particle force-based segregation model proposed in this work.
Acknowledgements
V.K.S. and S.K. acknowledge the help of Mr S. Patro in performing the DEM simulations. The authors also acknowledge the help of Mr S. Mittal in generating the snapshots of the simulations.
Funding
A.T. gratefully acknowledges the financial support provided by the Indian Institute of Technology Kanpur via the initiation grant IITK/CHE/20130338.
Declaration of interests
The authors report no conflict of interest.
Data availability statement
The data that support the findings of this study are available from the corresponding author, A.T., upon reasonable request.


