


1. Introduction
According to Noether's theorem, conservation laws and symmetries are at the heart of physics. For a fluid system, in addition to energy, there is another important inviscid invariant: helicity  $H$, which is defined as $H=\int _V h\, \mathrm {d}V$ with $V$ the entire flow volume and $h=\boldsymbol {u}\boldsymbol {\cdot } \boldsymbol {\omega }$ being the helicity density ( $\boldsymbol {u}$ and $\boldsymbol {\omega }$ are the velocity and vorticity fields, respectively). Helicity measures the degree to which vortex lines embedded in a fluid system wind around each other (Moreau Reference Moreau1961; Moffatt Reference Moffatt1969) and is believed to play an essential role in turbulence cascade and fine-scale mixing. In addition, the importance of helicity is underscored by the growing awareness of the roles of links and knots on various physical systems, e.g. fluids (Kleckner & Irvine Reference Kleckner and Irvine2013), plasmas (Ricca & Moffatt Reference Ricca and Moffatt1992), liquid crystals (Martinez et al. Reference Martinez, Ravnik, Lucero, Visvanathan, Žumer and Smalyukh2014) and biology (Chichak et al. Reference Chichak, Cantrill, Pease, Chiu, Cave, Atwood and Stoddart2004).
For finite thickness vortex tubes, Moffatt (Reference Moffatt1969) and Moffatt & Ricca (Reference Moffatt and Ricca1992) showed that the helicity could be geometrically decomposed as
 \begin{equation} H=\sum_{i \neq j} \varGamma_{i} \varGamma_{j} L _{k,i j}+ \sum_{i} \varGamma_{i}^{2}(T_{w,i}+W_{r,i}), \end{equation}
where  $\varGamma _i$ is the circulation of vortex tube $i$,
$i$,  $L_{k,i j}$ is the Gauss linking number between tubes $i$ and $j$ and $W_{r,i}$ and $T_{w,i}$ are, respectively, the writhe and twist of the tube $i$. Note that both $L_k$ and $W_r$ can be obtained from the vortex tube centreline alone; however, the twist $T_w$ and global helicity $H$ – the former consisting of the torsion twist ( $T_t$) of the axis and the internal intrinsic twist ( $T_i$) of vortex lines within the core – require additional measurements inside each vortex tube.
The conservation of helicity in ideal (inviscid) fluids is a direct consequence of the Helmholtz laws of vortex motion. As the conservation laws are fundamental to flow dynamics, whether the conservation of helicity can be extended to viscous flows at very high Reynolds number ( $Re$) is a significant question. In viscous flows, vorticity diffuses, allowing nearby vortex tubes to reconnect (Kida & Takaoka Reference Kida and Takaoka1994; Yao & Hussain Reference Yao and Hussain2022). There have been extensive debates regarding helicity evolution in viscous fluids, including the extent of its conservation and potential mechanisms for its transfer between different forms (i.e. link, writhe and twist) (Kleckner & Irvine Reference Kleckner and Irvine2013). On the one hand, viscosity can alter the field-line topology during the reconnection process – breaking the conservation of helicity. On the other hand, as helicity dissipation occurs at small scales, one may argue that, for a slender vortex (i.e. when the core size is much smaller than the radius of curvature), the localized viscous effect near the reconnection region would not significantly alter the global helicity at sufficiently high $Re$, which mainly resides in large scales (Kivotides & Leonard Reference Kivotides and Leonard2021).
Given its importance, numerous research studies in the past decades have addressed the helicity dynamics in real fluids. For example, Kida & Takaoka (Reference Kida and Takaoka1987, Reference Kida and Takaoka1988) conducted the direct numerical simulation (DNS) of a trefoil knotted vortex and observed that  $H$ slowly decreases during the whole evolution. They further found that the decay rate decreases with increasing $Re$, which seems to imply that $H$ is conserved at a sufficiently high $Re$. Two vortex rings in the Hopf link configuration have also been studied using DNS by Aref & Zawadzki (Reference Aref and Zawadzki1991) and Kivotides & Leonard (Reference Kivotides and Leonard2003). Note that all these earlier studies were performed at relatively low $Re$, where viscous effects (i.e. diffusion and dissipation) are relatively strong. Irvine and co-workers (Kleckner & Irvine Reference Kleckner and Irvine2013; Scheeler et al. Reference Scheeler, Kleckner, Proment, Kindlmann and Irvine2014) experimentally created vortex links and knots in a water tank at relatively high $Re (\sim 2\times 10^{4})$ and observed that the centreline helicity (i.e. sum of link and writhe helicities) is conserved during the topological change. Note that their experimental techniques did not allow them to directly measure the twist, and all their claims are drawn based on the link/writhe calculated from the tracked vortex centrelines and the assumption of a negligible effect of twist due to rapid viscous dissipation. Inspired by the studies of Irvine and co-workers, Kerr (Reference Kerr2018b) numerically studied the evolution of a perturbed trefoil knotted vortex and confirmed that the helicity is conserved before reconnection, followed by a progressive decay after reconnection. Recently, Kivotides & Leonard (Reference Kivotides and Leonard2021) employed reconnection-capable vortex filament methods to investigate the topological and helicity dynamics of vortex links for moderate and high $Re$. By discretizing the finite-core vortex tubes into bundles of a finite number of filaments, they demonstrated that the helicity of linked vortex rings is conserved during the unlinking process, and most of the initial link converts to writhe during the post-reconnection evolution. Note that the vortex filament simulation by Kivotides & Leonard (Reference Kivotides and Leonard2021) did not take into account contributions from the intrinsic twist $T_i$ to the total helicity. They also performed a DNS of vortex link at $Re=1500$ using the finite-volume method and found that the helicity continuously decreases, which, similar to that observed by Kida & Takaoka (Reference Kida and Takaoka1987), is attributed to strong viscous dissipation at low $Re$. Recently, Zhao et al. (Reference Zhao, Yu, Chapelier and Scalo2021) conducted DNS of a trefoil knotted vortex for $Re\le 6000$ using the adaptive mesh refinement technique and found that $H$ experiences a sudden jump during reconnection at high $Re$. Yao, Yang & Hussain (Reference Yao, Yang and Hussain2021) performed DNS of a trefoil knotted vortex constructed using the method developed by Xiong & Yang (Reference Xiong and Yang2019, Reference Xiong and Yang2020a) for $Re$ up to $12\ 000$ and also observed that $H$ grows during and after reconnection with the rate of growth increasing with $Re$. They further showed that the increase of $H$ is mainly attributed to the generation of twist (include both positive and negative signs) before and during reconnection, which contrasts with the previous claims that the twist has a negligible effect on the helicity dynamics.
In addition to the above-mentioned works for classical fluids, there are also studies of linked or knotted vortex in quantum fluids. For example, Scheeler et al. (Reference Scheeler, Kleckner, Proment, Kindlmann and Irvine2014) simulated the evolution of trefoil knots in a superfluid with the Gross–Pitaevskii equation and observed that the centreline helicity experiences a discrete jump across the reconnection. Zuccher & Ricca (Reference Zuccher and Ricca2017) analysed the evolution of linked vortex rings, which, through multiple reconnections, cascade into three unlinked and almost planar vortex loops. They further found that the total helicity remains unchanged throughout the process, and the link helicity is gradually transferred to writhe and (torsion) twist helicities, followed by a continuous relaxation of twist across scales.
The objective of this work is to investigate the helicity and topological dynamics of vortex links in viscous flows. In particular, we aim to address whether helicity is conserved during the unlinking process. The rest of the paper is organized as follows. The details of the initial configuration and numerical set-up are given in § 2. The overall flow evolution and statistics are presented in § 3. The detailed helicity and the topological dynamics are discussed in §§ 4 and 5, respectively. Finally, conclusions are drawn in § 6.
2. Initial configuration and numerical set-up
The initial condition (figure 1) consists of two vortex rings in the Hopf-link configuration (i.e.  $\alpha =90^{\circ }$). The radius of the ring is selected as $R_0 = 1$. The initial vorticity distribution in the cross-section of the ring is assumed to be Gaussian along the radial direction
 \begin{equation} \omega(\rho)=\frac{\varGamma_0}{2 {\rm \pi}\sigma^{2}} \exp \left(-\frac{\rho^{2}}{2 \sigma^{2}}\right), \end{equation}
where the circulation  $\varGamma _0=1$, and the standard deviation $\sigma =1/(16\sqrt {2{\rm \pi} })\approx 0.025$. The effective core radius is estimated as $r_e=2\sigma$, within which the vortex tube contains 95 % of the circulation; hence, the ratio between the mean radius and core size $R_0/r_e=8\sqrt {2{\rm \pi} }\approx 20$. In the current study, the vorticity direction of two rings are chosen so that they have the same chirality; hence, the total Gauss linking number $L_k=\sum _{ij}L_{k,ij}=2$. The two rings lie in planes whose normal vectors are inclined at $45^{\circ }$ to the $z$-axis. In this way, the total moment of vorticity defined as
 \begin{equation} \boldsymbol{I} \equiv \frac{1}{2} \iiint_{\mathbb{R}^{3}} \boldsymbol{x} \times \boldsymbol{\omega}( \boldsymbol{x})\, \mathrm{d} V, \end{equation}
is non-zero only for the third component. Consequently, the initial two vortex rings and the subsequent rings formed after reconnection have skew symmetry in the  $x$–
$x$– $y$ plane (e.g. $\omega _z (x,y,z)=\omega _z(-x,-y,z)$) and mainly propagate along the $z$–direction. If the sign of vorticity in one of the rings is reversed (i.e. the two rings have opposite chiralities), then the link helicity becomes $-2$, and the moment of vorticity $\boldsymbol {I}$ is non-zero along the $x$-direction. As the initial writhe $W_r$ and twist $T_w$ of the rings are both zero, the flow evolution is overall the same between these two cases but with a reversed sign of $H$. Note that as demonstrated in Xiong & Yang (Reference Xiong and Yang2020b), such relationship, in general, is not valid when the initial $W_r$ and $T_w$ are non-zero (e.g. for coiled vortex rings).

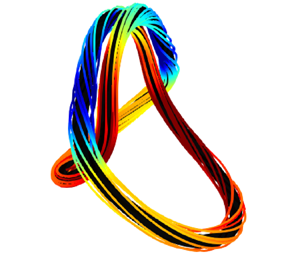
Figure 1. (a) Oblique, (b) top and (c) front views of the initial configuration of the Hopf link (represented by vorticity isosurface at 4 % of the maximum initial vorticity colour coded by the helicity density  $h$). Note that $\alpha =90^{\circ }$, and the blue lines inside the vortex rings denote the vortex axis.
DNS of the incompressible Navier–Stokes equations is carried out in a periodic domain  $[-{\rm \pi} :{\rm \pi} ]^{3}$ using a Fourier pseudospectral algorithm in the velocity–vorticity form (Pradeep & Hussain Reference Pradeep and Hussain2004; Yao & Hussain Reference Yao and Hussain2020a). Time integration is carried out with an explicit third-order Runge–Kutta scheme, while the viscous term is treated exactly with the integrating factor technique (Canuto et al. Reference Canuto, Hussaini, Quarteroni and Zhang2012). Time is non-dimensionalized as $t^{*}=t/(R^{2}_0/\varGamma )$. In the current study, we consider three different vortex Reynolds numbers (varied by changing the viscosity $\nu$) $Re=2000$, $3000$ and $4000$, with grid points $N^{3}=768^{3}$, $1280^{3}$ and $1536^{3}$, correspondingly. Grid and domain size convergence analyses are conducted in Appendix A, which clearly demonstrates that both the domain size and the grid resolutions employed here are adequate to capture the flow details.
3. Flow statistics and evolution
3.1. Flow structures
Figure 2 (and supplementary movie 1) shows the time progression of flow structures visualized using vorticity magnitude isosurface  $|\boldsymbol {\omega }|=0.04\omega _0$, with $\omega _0$ being the maximum vorticity magnitude at $t^{*}=0$. By self-induction, the initially perpendicularly placed vortex rings approach each other and also deform so that the neighbouring parts become anti-parallel and collide with each other. Then, the vortex rings start to reconnect and untie. Note that two reconnections occur simultaneously due to symmetry. Similar to what is observed for the trefoil knotted vortex (Yao et al. Reference Yao, Yang and Hussain2021), the reconnected parts (called bridges) combine with other parts – forming two separate vortex rings, i.e. a leading ring (LR) and a trailing ring (TR). The coiled TR continues to rotate counter-clockwise as it propagates along the $z$-direction. On the other hand, the LR is closely cuddled – different from what is observed for the trefoil knotted vortex (Yao et al. Reference Yao, Yang and Hussain2021; Zhao & Scalo Reference Zhao and Scalo2021). In addition, it continuously decays due to viscous cross-annihilation – similar to that observed by Aref & Zawadzki (Reference Aref and Zawadzki1991). Simultaneously, LR further undergoes reconnection to form two smaller rings – akin to that happening for an elliptical vortex ring with a large aspect ratio (Dhanak & Bernardinis Reference Dhanak and de Bernardinis1981; Cheng, Lou & Lim Reference Cheng, Lou and Lim2016). However, as the LR is strongly polarized (i.e. with strong axial flow), the reconnection here occurs in a much more complex manner, particularly at higher $Re$. The LR and the subsequent two smaller rings are very unstable due to the presence of strong axial flows and break up to form turbulent clouds consisting of numerous small-scale structures, which then rapidly decay. This is quite different from what was observed by Zuccher & Ricca (Reference Zuccher and Ricca2017) for quantum vortex links, where two distinct small rings develop. In addition, due to intense vortex stretching and weak viscous dissipation at high $Re$, more small scales are generated and wrapped around the TR – similar to what is observed for the trefoil knotted vortex (Yao et al. Reference Yao, Yang and Hussain2021). After $t^{*}=10$, as the LR becomes very weak, the flow is mainly dominated by the TR.

Figure 2. Evolution of flow structures represented by vorticity isosurface at 4 % of maximum initial vorticity ( $|\boldsymbol {\omega }|=0.04\omega _0$) shaded with helicity density $h=\boldsymbol {u}\boldsymbol {\cdot } \boldsymbol {\omega }$ for (a) $Re=2000$, (b) $Re=3000$ and (c) $Re=4000$. See also supplementary movie 1 available at https://doi.org/10.1017/jfm.2022.532 for the time evolution of different $Re$ cases.
Another feature of interest is that, while the vortex rings initially have predominately positive helicity density (i.e.  $+h$), some segments acquire negative helicity (i.e. $-h$) before and during reconnection, particularly at the tips of the rings. These $-h$ structures become more prominent and persist longer in time at higher $Re$. Hence, different from the previous well-studied scenario, where the two vortices undergoing reconnection are symmetrical, the reconnection here is asymmetric – similar to that considered by McGavin & Pontin (Reference McGavin and Pontin2019) and Yao et al. (Reference Yao, Yang and Hussain2021) for anti-parallel vortex reconnection with axial flows. Such asymmetric reconnection is also observed during the reconnection of a trefoil knotted vortex (Yao et al. Reference Yao, Yang and Hussain2021; Zhao et al. Reference Zhao, Yu, Chapelier and Scalo2021) and is the main reason for helicity increase during reconnection (Zhao & Scalo Reference Zhao and Scalo2021). In addition, the $+h$/
$+h$/ $-h$ zones appear alternatively in the TR at a late time (e.g. $t^{*}=10$ in figure 2c), which implies the presence of strong oscillations of axial flow/twist.
3.2. Flow statistics
Figures 3(a) and 3(b) show the time evolution of energy  $E=\int _V (\boldsymbol {u}^{2}/2)\, \mathrm {d}V$ and enstrophy $\varOmega =\int _V (\boldsymbol {\omega }^{2}/2)\, \mathrm {d}V$ for three different $Re$ cases. The energy $E$ monotonically decays, and the decay rate depends on viscosity and enstrophy, namely $\mathrm {d}E/ \mathrm {d}t=-2\nu \varOmega$. As a result, the decay of $E$ is enhanced during reconnection due to increased enstrophy. The enstrophy initially decays due to viscous dissipation, and the decay rate decreases with increasing $Re$ due to the limited viscous effect. For a rectilinear Lamb–Oseen vortex, the rate of change of enstrophy is $(1/\varOmega )\partial \varOmega /\partial t=2\nu /\sigma ^{2}$ with the core size $\sigma$ growing as $\sigma (t)= \sqrt {\sigma ^{2}_0+2\nu t}$ (Yao et al. Reference Yao, Yang and Hussain2021). Consequently, the enstrophy should follow $\varOmega (t)=\varOmega _0 \exp [-\int ^{t}_0(2\nu /\sigma ^{2}]\,\mathrm {d}t$ with $\varOmega _0$ being the enstrophy at $t^{*}=0$. For the linked vortices considered here, the initial decrease of $\varOmega$ also agrees with this prediction, but the agreement deteriorates as $Re$ increases – probably due to enhanced enstrophy production caused by vortex stretching. When reconnection starts, $\varOmega$ experiences rapid growth due to the generation of numerous small scales, and the peak of $\varOmega$ increases with $Re$ – akin to what was found by Yao & Hussain (Reference Yao and Hussain2020b). In addition, with increasing $Re$, the time for $\varOmega$ to reach the peak value slightly decreases – suggesting that the reconnection happens earlier at higher $Re$. It is somehow expected as the self-induced velocity of the vortex ring increases at higher $Re$ – due to smaller core size as the viscous diffusion is suppressed (Saffman Reference Saffman1970). Also, the duration of the increase of $\varOmega$ is shorter, implying that reconnection is more rapid at higher $Re$. Such a $Re$-trend has also been observed by Zhao et al. (Reference Zhao, Yu, Chapelier and Scalo2021) and Yao et al. (Reference Yao, Yang and Hussain2021) for a trefoil knotted vortex. The enstrophy then again experiences an exponential drop after the peak – the drop rate increasing with $Re$ this time, because more numerous and smaller scales are generated at higher $Re$ during reconnection.

Figure 3. Time evolution of (a) energy  $E$, (b) enstrophy $\varOmega$, (c) global helicity $H$ and (d) helicity dissipation $H_d$ for $Re=2000$ (red), $3000$ (blue) and $4000$ (black). Note that the shaded regions represent the time intervals when reconnection is happening. The dashed lines in (b) denotes $\varOmega (t)=\varOmega _0 \exp [-\int ^{t}_0(2\nu /\sigma ^{2}]\mathrm {d}t$ with $\sigma =\sqrt {\sigma ^{2}_0+2\nu t}$. The dashed line in (c) denotes the initial value of helicity; and the square symbols in (d) correspond to the time derivative of $H$ (the left-hand side of (3.1)).
The evolution of the global helicity  $H$ (figure 3c) is more interesting and complex. Initially, $H$ remains almost constant – equal to the link helicity $\varGamma ^{2}L_k$ (i.e. $=2$). It rapidly grows when reconnection starts, followed by a rapid drop. And the rates of growth/drop increase with $Re$. Note that such a rapid decay of $H$ is not observed for the trefoil knotted vortex case (Yao et al. Reference Yao, Yang and Hussain2021). As will be shown later, it is mainly due to the evolution of the LR. In addition, the peak value of $H$ also increases with $Re$, namely, from $H=2.42$ at $Re=2000$ to $3.0$ at $Re=4000$. Although the peak of $H$ occurs earlier as $Re$ increases, which is again consistent with the earlier reconnection at higher $Re$. Despite the fact that $H$ eventually decays at late times (e.g. $t^{*}>20$), its evolution immediately after reconnection strongly depends on $Re$. While $H$ slowly decays at $Re=2000$, it increases before reaching a quasi-steady state at high $Re$, and the growth becomes more rapid at higher $Re$. From this $Re$ trend, it is clear that $H$ would continuously increase at even higher $Re$. This indicates, in conjugation with the previous findings by Zhao et al. (Reference Zhao, Yu, Chapelier and Scalo2021) and Yao et al. (Reference Yao, Yang and Hussain2021) for the trefoil knotted vortex, that $H$ is not conserved during the unlinking/untying process, which contradicts the claims made by Scheeler et al. (Reference Scheeler, Kleckner, Proment, Kindlmann and Irvine2014) and Kivotides & Leonard (Reference Kivotides and Leonard2021) that the helicity is conserved for $Re \to \infty$. The oscillation of $H(t)$ during and after reconnection is quite surprising and is mainly attributed to the LR formed during reconnection. To confirm this, we consider the evolution of vortex link with a smaller angle (i.e. $\alpha =30^{\circ }$) in Appendix B. Similar to reconnection of a trefoil knot vortex, two distinct rings form after reconnection for this case. In addition, the strong oscillation of $H$ (i.e. rapid increase/decrease) is not observed there – suggesting that the evolution of $H$ after reconnection strongly depends on the initial configurations.
The governing equation for the global helicity  $H$ is
 \begin{equation} \frac{\mathrm{D} H}{\mathrm{D}t}=\underbrace{-\iiint 2 \nu\boldsymbol{\omega} \boldsymbol{\cdot} (\boldsymbol{\nabla} \times \boldsymbol{\omega})\,\mathrm{d}V}_{H_d}, \end{equation}
where the right-hand side is viscous dissipation  $H_d$ with $\boldsymbol {\omega } \boldsymbol {\cdot } (\boldsymbol {\nabla } \times \boldsymbol {\omega })$ being the so-called ‘superhelicity’ (Brissaud et al. Reference Brissaud, Frisch, Leorat, Lesieur and Mazure1973; Hide Reference Hide1989; Scheeler et al. Reference Scheeler, Kleckner, Proment, Kindlmann and Irvine2014). As $H$ is not positive-sign definite, $H_d$ can be either positive or negative – quite different from energy or enstrophy dissipation. The negative/positive values of $H_d$ represent decreases/increases of $H$, respectively. Therefore, $H_d$ can either be a source or sink of $H$. Nevertheless, as will be shown later, the helicity dissipation density $h_d$( $\equiv -2\nu \boldsymbol {\omega } \boldsymbol {\cdot } (\boldsymbol {\nabla } \times \boldsymbol {\omega })$), in general, is negative/positive where $h$ is positive/negative, respectively. For a twisted rectilinear vortex column (i.e. Batchelor vortex), the relative dissipation of helicity (in the form of twist) depends mainly on core size $\sigma$ and viscosity $\nu$, i.e. $H_d/ H=-2\nu /\sigma ^{2}$; and, therefore, helicity is expected to decay exponentially $H(t)/H(0)= \exp [-\int ^{t}_0(2\nu /\sigma ^{2})\,\mathrm {d}t]$ (Scheeler et al. Reference Scheeler, Kleckner, Proment, Kindlmann and Irvine2014; Yao et al. Reference Yao, Yang and Hussain2021).
Figure 3(d) shows the evolution of  $H_d$ for three different $Re$. It remains almost zero for $t^{*}<3$, becomes positive as reconnection starts and continuously increases and reaches the peak almost at the same time as the enstrophy (figure 3b). In addition, as $Re$ increases, the growth of $H_d$ starts earlier and at a larger rate – again due to an earlier and faster reconnection at higher $Re$. As the reconnection slows down, $H_d$ decreases and becomes even negative. And with increasing $Re$, the minimum value of $H_d$ becomes smaller and occurs at an earlier time. Then, $H_d$ non-monotonically increases with time and becomes positive again. At the very late time (i.e. $t^{*}>15)$, $H_d$ becomes very small – consistent with the slow decay of $H$ observed in figure 3(c). As substantial variations of $H_d$, as well as of $H$, mainly occur during and immediately after reconnection (i.e. $t^{*}<12$), in the following section, we will mainly examine their evolution during this period.
To further shed light on the helicity evolution, figure 4 shows the time evolution of helicity integrated in the  $x$–
$x$– $y$ plane, defined as
 \begin{equation} \langle h\rangle(z,t)=\iint h\, \mathrm{d} x\, \mathrm{d} y. \end{equation}
The evolution of  $\langle h\rangle$ is overall quite similar at different $Re$, except that the amplitude is larger at higher $Re$. At $t^{*}=0$, $\langle h\rangle$ is non-zero (positive) only in a narrow range of $z$, where the two vortex rings initially reside (i.e. $-3< z<-1.5)$. As time progress, the positive patch (i.e. $+\langle h\rangle$) advects towards larger $z$ values as the two rings move upwards. Interestingly, around $t^{*}=2$, $-\langle h\rangle$ develops at large $z$, further increasing at later times. This is consistent with figure 2 showing that the top parts of the rings are predominantly associated with negative helicity density (i.e. $-h$). Then, as the two new vortex rings form and separate after reconnection, $\langle h\rangle$ splits into two parts. Although there are some $-\langle h\rangle$ patches at the top of the trailing part (i.e. TR), it expeditiously disappears. In addition, the TR carries the majority of $H$, particularly at late times. For the leading part (i.e. LR), $\langle h\rangle$ is initially all negative, suggesting that the LR, in contrast to the TR, has dominantly $-h$. Interestingly, a narrow band of $+\langle h\rangle$ develops in LR, and then is rapidly replaced by strong $-\langle h\rangle$, which also diminishes at a late time.

Figure 4. Time evolution of  $x$–
$x$– $y$ plane-integrated helicity $\langle h\rangle (z,t)$ for (a) $Re=2000$, (b) $3000$ and (c) $4000$. Positive and negative isocontours [0.25 : 0.25 : 20] of initial maximum $\langle h\rangle$ (i.e. $\max (\langle h\rangle (z,0))$) are shown in red and blue, respectively.
4. Helicity dynamics
4.1. Pre-reconnection
Before reconnection ( $t^{*}\le 3$), $H$ remains almost constant. However, it does not mean that there is no generation of $h$ during this period. Instead, due to the helicity splitting mechanism discussed in Yao & Hussain (Reference Yao and Hussain2021), $\pm h$ are simultaneously developed. To demonstrate this, figure 5 shows the early time evolution (i.e. $t^{*}\le 3$) of flow structures represented by the vortex lines colour coded by $h$. For the linked vortex rings, the mutual interaction is one of the main contributors to $h$. Initially, $h$ is positive everywhere, attaining its maximum near the centre of the vortex rings (i.e. $A$ in figure 5a), where the induced velocity by the other ring is the largest and aligns with the vorticity. The two rings deform as they move close to each other due to self-induction. At the top parts, the two rings become anti-parallel and rapidly move upward as a dipole due to mutual induction. Consequently, at region $B$ in figure 5(d), the velocity is directed opposite to that of vorticity – resulting in the development of $-h$. As the rings move closer to each other, the higher mutual induction causes a much stronger $-h$ (regions $C$ and $D$ in figure 5e). As explained later, the $h$ generated due to mutual induction is mostly at large scales and associated with the link and writhe helicities.

Figure 5. Earlier evolution ( $0\le t^{*}\le 3$) of flow structures represented by vortex lines shaded with helicity density $h=\boldsymbol {u}\boldsymbol {\cdot } \boldsymbol {\omega }$ for $Re=3000$. The black and green arrows indicate the directions of vorticity and axial velocity, respectively.
In addition to mutual induction, there is another important mechanism of helicity density generation; namely, the twist of vortex lines with respect to the vortex centreline. Initially, all the vortex lines aligned with the vortex rings (figure 5a). As the rings evolve, the vortex lines become twisted, which, as discussed by Melander & Hussain (Reference Melander and Hussain1994), is mainly due to the vortex core dynamics. This process can be better illustrated by considering a simplified model – interaction between a vortex ring and a rectilinear tube (figure 6a), which is a good approximation of what occurs around region  $A$ in figure 5(a). Due to the variation of the induced velocity of the vortex ring, the vortex tube is compressed (i.e. $\omega _z \partial w/\partial z<0$) and stretched (i.e. $\omega _z \partial w/\partial z>0$) above and below the ring, respectively – resulting in a variation of the core size along the tube. As the vorticity magnitude is higher/lower in the region with a small/large core size, the initially straight vortex lines become radially displaced and undergo coiling (Melander & Hussain Reference Melander and Hussain1994; Yao & Hussain Reference Yao and Hussain2021). Note that the vortex lines are oppositely twisted with respect to planes $A$ and $B$; hence both $+h$ and $-h$ are generated simultaneously. Furthermore, as the vortex tube is, respectively, compressed and stretched above and below the ring, the twist of the vortex lines is correspondingly enhanced and suppressed. This explains the twists of vortex lines observed at regions $C$ and $D$ in figure 5(e) – particularly why the vortex lines in one segment are more twisted than in the other. Note that the $h$ generated through the twist of vortex lines is at small scales and is mainly associated with the twist helicity.

Figure 6. (a) Schematic of helicity density generation through the coiling of vortex lines; and (b) time evolution of  $H^{+}$ (dashed) and $H^{-}$ (dash-dotted) for $Re=2000$ (red), $3000$ (blue) and $4000$ (black). Note that the solid lines in (b) represent the global helicity, and the circles denote $-H^{-}(t)+H(0)$ with $H(0)=2$ the initial global helicity.
The generation of  $\pm h$ increases with increasing $Re$. To confirm that, following Yao et al. (Reference Yao, Yang and Hussain2021), figure 6(b) shows the volume integrated positive and negative helicity $H^{\pm }=\int h^{\pm }\, \mathrm {d}V$, where
 \begin{equation} h^{+}= \begin{cases} h, & \text{if } h\geq 0\\ 0, & \text{otherwise} \end{cases}, \end{equation}
and  $h^{-}=h-h^{+}$. As expected, $H^{+}(0)=H(0)$, and $H^{-}(0)$ is zero at $t^{*}=0$. Both the $H^{-}$ and $H^{+}$ slowly grow in magnitude during the initial approach stage, when the two vortex rings form anti-parallel structures. Just before reconnection, both of them rapidly increase – at roughly the same rate; hence, $H$ remains constant. In addition, the growth rate of $|H^{\pm }|$ increases with $Re$. During reconnection, although the magnitudes of $H^{-}$ and $H^{+}$ still increase, but with different rates. By comparing $H^{+}$ and $H^{-}+H(0)$, it is clear that $H^{+}$ grows faster – resulting in an increase of $H$. Then, the magnitudes of both $H^{+}$ and $H^{-}$ decrease, but with a different decay rate – akin to that observed by Yao et al. (Reference Yao, Yang and Hussain2021) for a trefoil knotted vortex.
Several comments deserve to be made here. First, as both the two helicity generation mechanisms discussed above are purely inviscid, they would also occur for Euler flows – despite the fact that reconnection would be strictly prohibited. Second, the evolution of vortex lines, particularly their strong twists, is quite different from that observed by Kivotides & Leonard (Reference Kivotides and Leonard2021), who used a bundle of a finite number of filaments to represent finite-core vortex rings. Due to the inability to capture the detailed core dynamics, one should be very cautious about using the vortex filament method for understanding the helicity dynamics in viscous flows. Finally, the rapid generation of  $\pm h$ and their decays are essential prerequisites for the oscillation of $H$ observed during and after reconnection. As shown later, the difference in the growth and decay rates of $H^{+}$ and $H^{-}$ is the main reason for the increase or decrease of $H$ observed in figure 3(c).
4.2. During reconnection
As discussed in § 3.2,  $H$ rapidly rises during reconnection, particularly at high $Re$. Such an increase has also been observed during the unknotting process of a trefoil knotted vortex (Yao et al. Reference Yao, Yang and Hussain2021; Zhao et al. Reference Zhao, Yu, Chapelier and Scalo2021). For both of these configurations, $\pm h$ patches are developed in the anti-parallel vortex structures before reconnection due to the helicity density generation mechanisms discussed above. In addition, due to the asymmetry presented in these two anti-parallel segments, the one with $-h$ is much stronger (as shown in figure 5(e) and further sketched in figure 7a). During reconnection, both $+h$ and $-h$ patches are then expected to be annihilated through viscous dissipation, and the more rapid dissipation of $-h$, presumably due to the larger amplitude, causes the net increase of $H$.
$H$.

Figure 7. (a) Schematic of the helicity dissipation during asymmetric reconnection of two anti-parallel vortex segments with different axial flows; and (b) the thread details.
Recently, Zhao & Scalo (Reference Zhao and Scalo2021) provided an analytical expression relating helicity dissipation to circulation transfer, i.e.
 \begin{equation} \frac{\mathrm{D} H}{\mathrm{D} t}={-}2(u_1-u_2)\delta \frac{\mathrm{d}\varGamma }{\mathrm{d}t}. \end{equation}
 Here,  $u_i$ is the axial velocity in the $i$th vortex segment, $\delta$ and $\mathrm {d}\varGamma /\mathrm {d}t$ are the characteristic length scale of the reconnection region and circulation transfer rate between the two segments. Equation (4.2) suggests that, when the axial flows in the two interacting vortices have the same strength, $H$ will remain unchanged during reconnection – consistent with what was observed by Yao & Hussain (Reference Yao and Hussain2021) for the symmetrical collision of two vortex rings. Once there is a difference between axial flows within the two interacting vortices, $H$ would change during reconnection. This point is further demonstrated in Appendix C by considering the asymmetric collision of two slender vortex rings. In addition, the rate of change of $H$ is proportional to the circulation transfer rate (i.e. $\mathrm {d}\varGamma /\mathrm {d} t$) and the difference in axial velocity (i.e. $u_1-u_2$) – agreeing with the more rapid increase of $H$ at higher $Re$ (figure 3d). This can also be explained by considering the sketch in figure 7(a). The difference between the axial velocities in the two vortex tubes results in a non-zero $\omega _z$, which, together with the vorticity gradient $\partial \omega _x/\partial y$, yields positive helicity dissipation $h_d$ – predominant $-\nu \omega _z\partial \omega _x/\partial y$. Furthermore, $h_d$ increase at higher $Re$ due to the much stronger vorticity gradient $\partial \omega _x/\partial y$ (Yao & Hussain Reference Yao and Hussain2020b). Zhao & Scalo (Reference Zhao and Scalo2021) demonstrated that, at low $Re$, (4.2) can successfully connect the change of $H$ with the reconnection process, and that, at high $Re$, the correlation between helicity changes and circulation transfer decreases due to the complex nature of reconnection (Kerr Reference Kerr2018a; Yao & Hussain Reference Yao and Hussain2020b, Reference Yao and Hussain2021).
To elaborate on the discussion above, figure 8 shows the evolution of flow structures represented by vortex lines colour coded by  $h$ for $Re=3000$ during reconnection. The vortex lines in the left ring are more twisted – consistent with the fact that the magnitude of $h$ is larger. As the two vortex rings closely touch, the vortex lines near the periphery start to cut and connect. The reconnected vortex lines form cusps and rapidly recede away from the reconnection site by their sharp curvature-driven self-induction – similar to that observed for symmetrical anti-parallel vortex reconnection (Melander & Hussain Reference Melander and Hussain1988; Kida & Takaoka Reference Kida and Takaoka1994). Successive reconnected vortex lines are similarly laid on top of each other and combine to form progressively stronger bridges. As in reconnection of anti-parallel vortex tubes with axial flows, the two bridges are not symmetric. In addition, due to compression, the reconnection vortex lines in the top bridge are so close that they can reconnect among themselves to form new loops. Furthermore, the induced velocity of the bridges continuously stretches the unreconnected threads, straightening the initially kinked and twisted vortex lines (as sketched in figure 7b) and causing the loss of $h$ there (mainly in the form of twist). Since structures in this region are predominantly associated with $-h$ before reconnection, their more rapid decrease during reconnection yields an overall increase of $H$.
$H$.

Figure 8. Evolution of flow structures represented by vortex lines shaded with helicity density  $h=\boldsymbol {u}\boldsymbol {\cdot } \boldsymbol {\omega }$ for $Re=3000$ during reconnection: (a) $t^{*}=3.52$, (b) $t^{*}=4.04$ and (c) $t^{*}=4.37$. Note that the bottom row shows the corresponding zoomed-in view of the reconnection region.
4.3. Post-reconnection
The evolution of  $H$ after reconnection is complicated and can be better explained by examining the LR and TR, separately. Figure 9(a) shows the helicity for the top $H^{>}(t)$ (i.e. LR) and bottom $H^{<}(t)$ (i.e. TR) parts, defined as
 \begin{equation} H^{>}(t)=\int^{\rm \pi}_{z_s}\langle h\rangle\, \mathrm{d}z, \quad H^{<}(t)=\int^{z_s}_{-{\rm \pi}} \langle h\rangle\, \mathrm{d}z, \end{equation}
where  $z_s$ represents the separation location between the LR and TR (denoted by the dashed lines in figure 4). In addition, figure 9(b–d) shows the corresponding helicity dissipation $H^{>}_d(t)$ and $H^{>}_d(t)$ for $Re=2000$, $3000$ and $4000$, respectively.

Figure 9. (a) The helicity for the top LR  $H^{>}$ (dash-dotted ) and bottom TR $H^{<}(t)$ (dashed) at different $Re$; and the corresponding helicity dissipation $H^{>}_d(t)$ (dash-dotted) and $H^{>}_d(t)$ (dash) for (b) $Re=2000$, (c) $Re=3000$ and (d) $Re=4000$. Note that, in (a), the solid lines represent the global helicity $H$; and in (b–d), the solid lines denote the global helicity dissipation $H_d$, and the square symbols correspond to the time derivative of $H$ (the left-hand side of (3.1)).
As the TR predominately has positive  $h$,
$h$,  $H^{<}$ is positive. At low $Re$ (i.e. $2000$), it continuously decreases with time, and the corresponding $H^{<}_d$ remains negative for all times. Due to increased generation of $h$ before and during reconnection, the magnitude of $H^{<}$ grows with $Re$. In addition, the decay rate of $H^{<}$ decreases with increasing $Re$ at early times (i.e. $t^{*}<8)$, which is mainly due to the suppressed viscous effect. For all $Re$ cases, $H^{<}_d$ becomes rather small when $t^{*}>8$. Interestingly, it becomes slightly positive at $Re=4000$. As a result, $H^{<}$ experiences a minor increase, which, as discussed in Scheeler et al. (Reference Scheeler, Kleckner, Proment, Kindlmann and Irvine2014) and Yao et al. (Reference Yao, Yang and Hussain2021), is mainly due to the effect of writhe and twist helicity conversions presented for a coiled vortex ring.
As the LR is closely cuddled, its helicity evolution is more complex than that of the TR. The  $H^{>}$ is always negative and decreases initially – suggesting that the contribution of $-h$ in LR becomes larger. Then, $H^{>}$ increases and asymptotically approaches zero at the late time. In addition, the growth rate increases with $Re$ – implying a more rapid dissipation of negative $h$ at higher $Re$. By comparing $H$ with $H^{>}$, it is clear that the decrease and increase of $H$ immediately after reconnection (i.e. $4.5< t^{*}<6$) is mainly caused by the LR. During $6< t^{*}<12$, the decay rates of $H^{>}$ and $H^{<}$ is comparable – resulting in a quasi-steady evolution of $H$. After that, the $H^{>}$ almost decays to zero, and the evolution of $H$ is mainly governed by $H^{<}$, which continuously decays with time (figure 3c).
Figure 10(a–d) further shows the evolution of vortex lines (colour coded by the helicity density  $h$ ) in TR at several instants after reconnection for $Re=3000$ with figure 10(e–h) displaying the corresponding helicity dissipation density $h_d$. Note that helicity dissipation is indicated by negative (blue) and positive (red) of $h_d$ in the $+h$ and $-h$ regions, respectively. As the TR is mostly associated with $+h$, vortex lines are mostly right-hand twisted. In addition, the TR is coiled near the two reconnected sites (indicated by A and B in figure 10a) with $h$ being positive or negative on each side of the kink structure – resulting from reconnection of two oppositely polarized vortex segments (figure 8). Due to the induced velocities of the kinks, the TR rotates counter-clockwise. In addition, the kink structures also travel counter-clockwise along with the TR through folding/unfolding. The $\pm h$ patches, which propagate along the ring, decay with time due to viscous dissipation. Correspondingly, the vortex lines progressively become untwisted. The regions with strong $h$ have intense $h_d$ of opposite sign – indicating that significant helicity dissipation occurs in the strong helical region. Initially, the region with $-h_d$ is much larger than that of $+h_d$ (figure 10e) – consistent with an overall decrease of $H^{<}$ in the TR (figure 9a). The region with positive $+h_d$ enlarges at late times (i.e. $t^{*}=8.5$), and becomes comparable to that of $-h_d$ – suggesting the decrease of dissipation of $H^{>}$. At late times, both $\pm h$ decrease, and $h_d$ is mainly localized in the kink region.

Figure 10. Evolution of flow structures represented by (a–d) vortex lines shaded with helicity density  ${h=\boldsymbol {u}\boldsymbol {\cdot } \boldsymbol {\omega }}$ and (e–h) helicity dissipation density $h_d$ for the TR after reconnection at $Re=3000$. Note that red and blue colours denote positive and negative of $5\,\%$ of the maximum value, and the transparent (grey) isosurface represents $|\boldsymbol {\omega }|=0.04\omega _0$.
Figures 11(a)–11(c) show the evolution of LR represented by vortex lines colour coded by the helicity density  $h$ at several instants immediately after reconnection for $Re=3000$. The LR, which results from the recombination of the top parts of the initial vortex rings, is closely touched. The vortex lines inside are strongly twisted, predominately near the ends (i.e. the bridges). In addition, they are oppositely twisted on each side of the bridges. As $h$ is small near the tipping points, the vortex lines there are almost parallel. Due to the self-induction of the curved vortex segments, the LR continuously undergoes reconnection. However, different from what is typically observed for elliptic vortex rings or colliding vortex rings (Kida & Takaoka Reference Kida and Takaoka1988; Yao & Hussain Reference Yao and Hussain2020c), here, the two vortex segments collide and reconnect in an asymmetric manner.

Figure 11. Evolution of the LR represented by (a–c) vortex lines shaded with helicity density  $h=\boldsymbol {u}\boldsymbol {\cdot } \boldsymbol {\omega }$ and (d–f) vorticity isosurface shaded by $\omega _y$ helicity dissipation density $h_d$ at $Re=3000$.
The process can be better illustrated by the top view of the vorticity isosurface colour coded by  $\omega _y$ shown in figure 11(d–f) and with adjoining illustrated sketches in figure 12. The two vortex tubes collide with a slight offset, and then the top of one vortex flips over the other (figures 10d and 12b). Due to skew symmetry, the vortex dipole at the centre (I in figure 11d) is still symmetric but becomes asymmetric near the end (II in figure 11d). In particular, the core of the left vortex is deformed. Consequently, the initially straight vortex lines become curved, and their induced velocity causes the vortices to be polarized (figure 12c): $h$ is positive near the centre and negative near the side – consistent with what is shown in figure 11(b). In addition, it further pulls one vortex to the top of the other one – causing the overall twist of the LR (figure 11e). In addition, the centre region rotates clockwise – akin to what was observed by Yao & Hussain (Reference Yao and Hussain2021) for reconnection of anti-parallel co-polarized vortex tubes. The positive $h$ around the tipping point is rapidly dissipated through reconnection, which is consistent with a decrease of $H^{>}$ observed in figure 9. Consequently, the LR becomes predominantly $-h$ (figure 10c), and its subsequent break up due to instability (figure 13) results in the loss of $-h$; hence, a decrease of $H^{>}$.

Figure 12. Schematic of the asymmetric reconnection of the LR.

Figure 13. Evolution of flow structures represented by vorticity isosurface at 4 % of maximum initial vorticity ( $|\boldsymbol {\omega }|=0.04\omega _0$) colour coded by helicity density $h$: (a) $t^{*}=6.2$ and (b) $t^{*}=7.0$.
Finally, figure 14 shows the isosurfaces of helicity dissipation density  $h_d$ for the LR at several instants. Initially, $\pm h_d$ appears alternatively – which is opposite to the distribution of $h$ shown in figure 11. Then, as the central region becomes right-hand twisted, $h_d$ becomes predominantly negative – consistent with the decrease of $H^{>}$. At the late time, regions with $+h_d$ increase and become comparable to that of $-h_d$. Both $\pm h_d$ occurs at small scales – implying the existence of a forward helicity cascade along with the energy cascade.

Figure 14. Isosurface of helicity dissipation density  $h_d$ for the LR at $Re=3000$: (a) $t^{*}=4.5$, (b) $t^{*}=5.0$,(c) $t^{*}=5.5$, (d) $t^{*}=6.2$ and (e) $t^{*}=7.0$. Note that red and blue colours denote positive and negative of $5\,\%$ of the maximum value.
5. Topological aspects of helicity dynamics
5.1. Properties of vortex centrelines
In this section, we examine the topological dynamics of the vortex links in terms of the vortex core centrelines (axes). Following Yao et al. (Reference Yao, Yang and Hussain2021), we use the method developed by Levy, Degani & Seginer (Reference Levy, Degani and Seginer1990) based on the normalized helicity density  $\boldsymbol {u}\boldsymbol {\cdot } \boldsymbol {\omega }/(|\boldsymbol {u}||\boldsymbol {\omega }|)$ and implemented in Paraview by Sadlo et al. (Reference Sadlo, Hausner, Hofmann, Jung, Karch, Peikert, Pilz, Roth and Sdeo2019) to identify vortex centrelines. The method assumes that the angle between the velocity and vorticity vectors is typically minimal near the axis and can filter out the regions of low vorticity as well as regions of high vorticity but low velocity (Levy et al. Reference Levy, Degani and Seginer1990). It has been demonstrated to successfully extract the vortex axis, except for the period when reconnection occurs and the vortex axis is hardly defined (Yao et al. Reference Yao, Yang and Hussain2021). Figure 15 displays the evolution of the axes for two vortex rings before reconnection and for the TR after reconnection at $Re=3000$. Note that, as the LR after reconnection is closely cuddled with irregular core shape (figure 11) and rapidly breaks up afterward, its centreline is rather difficult to extract and, therefore, is not included.

Figure 15. Evolution of extracted vortex axis (shaded with centreline helicity density  $h_c=\boldsymbol {u}\boldsymbol {\cdot } \boldsymbol {T}$) for (a) vortex rings before reconnection and (b) the TR after reconnection at $Re=3000$.
Several interesting quantities can be measured based on the tracked vortex axis. The first one is the length of the vortex centreline  $l_c$. Figure 16 shows the evolution of lengths for the vortex ring before reconnection and the TR after reconnection (normalized by the initial length of a single vortex ring $2{\rm \pi} R_0$). Consistent with what was observed by Scheeler et al. (Reference Scheeler, Kleckner, Proment, Kindlmann and Irvine2014), the length $l_c(t)$ before reconnection continuously increases and is almost identical for different $Re$. During reconnection, the rate of growth of $l_c(t)$ increases with $Re$, which is due to a larger vortex stretching at higher $Re$. After reconnection, $l_c(t)$ for the LTR remains almost constant and, interestingly, is approximately twice the initial length of the vortex ring.

Figure 16. Time evolution of (a) normalized length  $l_c/(2{\rm \pi} R_0)$ and (b) the third components of the directed area enclosed by the vortex centrelines $S_3$ for the vortex ring before reconnection, and LTR after reconnection.
The moment of vorticity for a vortex knot in a fluid at rest at infinity is related to the impulse (Batchelor Reference Batchelor2000). As a theoretical estimation for the thin vortex filament, substituting  $\boldsymbol {\omega }\,\mathrm {d} V = \varGamma \, \mathrm {d}\boldsymbol {c}$ in (2.2) yields
 \begin{equation} \boldsymbol{I} =\varGamma \boldsymbol{S}, \end{equation}
where  $\boldsymbol {S}=\oint _c\boldsymbol {c}\times \, \mathrm {d}\boldsymbol {c}/2$ is the directed area enclosed by the curve (Wu, Ma & Zhou Reference Wu, Ma and Zhou2007). Equation (5.1) provides a geometric way to estimate the momentum by computing the individual momentum components from direct measurements of the area regions obtained by planar projections of the vortex axis (Zuccher & Ricca Reference Zuccher and Ricca2019).
The vortex link here has an initial impulse  $\boldsymbol {I} = (0, 0, \sqrt {2}{\rm \pi} )$. Figure 16(b) shows the evolution of the third component of $\boldsymbol {S}$, i.e. $S_3$. Note that the other two components are negligible for all times and hence are not shown. Before reconnection, $S_3$ visually collapses for all $Re$ cases and slightly increases with time. As $\boldsymbol {I}$ is invariant, the increase of $S_3$ is mainly due to the decrease in circulation $\varGamma$ through viscous cross-diffusion. The difference between the calculated value and the theoretical prediction (based on constant circulation assumption) is within $1\,\%$ for all $Re$ cases. After reconnection, $S_3$ for TR also slightly increases with time, and is very close to the theoretical value for the whole flow system. This suggests that the moment of vorticity is mainly carried by the TR – consistent with the flow visualization in figure 11 showing that the area for the LR projected in the $x$–
$x$– $y$ plane is negligible.
5.2. Centreline helicity
For sufficiently thin vortex tubes with minimal vorticity variation across the cross-section, the global helicity is encoded completely along the centreline of the vortex tube (Bretherton Reference Bretherton1970; Scheeler et al. Reference Scheeler, van Rees, Kedia, Kleckner and Irvine2017). Hence,
 \begin{equation} H_c=\sum_i \varGamma_i \oint_{C_i} \boldsymbol{u}(s)\boldsymbol{\cdot} \boldsymbol{T}(s)\, \mathrm{d}s, \end{equation}
where  $h_c=\boldsymbol {u}\boldsymbol {\cdot } \boldsymbol {T}$ is the centreline helicity density and $\boldsymbol {T}$ denotes the unit tangential vector along the vortex centreline $C$. Equation (5.2) provides an easy way for estimating the helicity of the flow without the need for measuring the full velocity and vorticity fields. The value of $H_c$ has also been employed to represent the link and writhe helicities, which is based on the assumption that the twist helicity is small and can be dissipated rather rapidly, particularly for a very thin vortex (Scheeler et al. Reference Scheeler, Kleckner, Proment, Kindlmann and Irvine2014).
Figure 17 compares  $H_c$ and $H$ for the vortex rings before reconnection and for TR after reconnection. Note that the circulation $\varGamma$ is assumed to remain the same as the initial value, and $H$ in TR is calculated based on (4.3a,b). Before reconnection, $H_c$ is almost identical to $H$ – confirming that $H_c$ is a reasonably good approximation for $H$. After reconnection, $H_c$ experiences oscillations, which are due to the growth and annihilation of the axial flows along the vortex ring. In addition, the agreement between $H_c$ and $H$ deteriorates with increasing $Re$, which, as discussed in Yao et al. (Reference Yao, Yang and Hussain2021), is mainly due to the following two reasons. First, reconnection induces strong core deformation near the interaction region, such as forming vortex sheets. Consequently, the vortex core becomes irregular with a substantial vorticity variation, especially at higher $Re$. Second, the threads, which wrap around the TR, are polarized and contain a certain amount of $h$, which is somehow excluded by $H_c$. Therefore, $H_c$ cannot be employed to approximate $H$ immediately after reconnection. Due to viscous diffusion, the vortex core of TR would become regular (i.e. circular) again, and the threads become weaker, $H_c$ would eventually approach $H$. But the time it takes seems to significantly increase with $Re$.
$Re$.

Figure 17. Time evolution of the centreline helicity  $H_c$ (square) and helicity (lines) for the vortex rings before reconnection and for TR after reconnection at $Re=2000$ (red), $3000$ (blue) and $4000$ (black).
5.3. Gauss linking and self-link numbers, writhe and torsion twist
Here, we attempt to provide a topological interpretation of the helicity dynamics. The definition of the geometric and topological quantities presented in (1.1) are summarized here. The Gauss linking number between the vortices  $i$ and $j$ is obtained by the double integral over the axes
 \begin{equation} L_{k,i j}=\frac{1}{4 {\rm \pi}} \int_{C_{i}} \int_{C_{j}} \frac{\boldsymbol{X}_{i}- \boldsymbol{X}_{j}}{| \boldsymbol{X}_{i}- \boldsymbol{X}_{j}|^{3}} \boldsymbol{\cdot} ( \mathrm{d} \boldsymbol{X}_{i} \times \mathrm{d} \boldsymbol{X}_{j}), \end{equation}
where  $\boldsymbol {X}_{i}$ and $\boldsymbol {X}_{j}$ denote the position vectors of a point on $C_i$ and $C_j$, respectively. The total Gauss linking number $L_k$, which takes integer values only, provides a measure of the degree of linking of two (or more) disjoint vortices.
The writhe is defined as
 \begin{equation} W r_{i}=\frac{1}{4 {\rm \pi}} \int_{C_{i}} \int_{C_{i}} \frac{ \boldsymbol{X}_{i}- \boldsymbol{Y}_{i}}{| \boldsymbol{X}_{i}- \boldsymbol{Y}_{i}|^{3}} \boldsymbol{\cdot} (\mathrm{d} \boldsymbol{X}_{i} \times \mathrm{d} \boldsymbol{Y}_{i}), \end{equation}
where  $\boldsymbol {X}_{i}$ and $\boldsymbol {Y}_{i}$ denote two distinct points on the same vortex axis $C_i$. Note that $W_{r,i}$ is a global geometric property of $C_i$ and is always zero if $C_i$ is a plane curve (Zuccher & Ricca Reference Zuccher and Ricca2017). Since writhe takes into account distortion, it is often a good indicator of three-dimensional folding of the vortex.
The twist is defined by the rate of rotation of the ribbon unit vector around the curve  $C_i$, and it can be further decomposed into torsion $T_t$ and intrinsic twist $T_i$, given respectively by
 \begin{equation} T_t=\frac{1}{2 {\rm \pi}} \int_{C_{i}} \tau(s)\, \mathrm{d} s, \end{equation}
and
 \begin{equation} T_i=\frac{1}{2 {\rm \pi}} \int_{C_{i}} \xi(s)\, \mathrm{d} s, \end{equation}
with  $\tau (s)$ and $\xi (s)$ denoting local torsion and the rate of azimuthal change along $C_i$. Note that the sum of $W_r$ and $T_t$ is the self-linking number $L_s$, which takes integer values only (Pohl Reference Pohl1968).
Figure 18(a,b) shows the total Gauss link ( $L_k$), writhe ( $W_r$), torsion twist ( $T_t$) and self-link ( $L_s$) for the vortex links before reconnection and the LTR after reconnection at $Re=2000$ and $4000$, respectively. As the numerical computation of writhe and torsion is very sensitive to small-scale noise, a local smoothing filter similar to that used in Scheeler et al. (Reference Scheeler, Kleckner, Proment, Kindlmann and Irvine2014) and Yao et al. (Reference Yao, Yang and Hussain2021) is applied to the raw extracted vortex centreline. Initially, $L_k$ is equal to two and remains unchanged before reconnection, as $L_{k,12}=L_{k,21}=+1$. In addition, $W_r$ is initially zero and slightly decreases before reconnection, which is consistent with what was observed by Zuccher & Ricca (Reference Zuccher and Ricca2017) for quantum vortex links. During this period, $T_t$ is equal to $-W_r$; consequently, $L_s$ remains zero. In addition, the variation of $W_r$ and $T_t$ only weakly depends on $Re$.
$Re$.

Figure 18. Time evolution of total Gauss link ( $L_k$), writhe ( $W_r$), torsion twist ( $T_t$) and self-link ( $L_s$) for (a) $Re=2000$ and (b) $4000$.
During reconnection, when the vortex rings undergo dramatic changes in topology, all these quantities are expected to experience abrupt changes. As two vortices untie,  $L_k$ decreases to zero after reconnection. The $W_r$ value for TR becomes positive and slowly varies with time, and $T_t$ also jumps through reconnection; consequently, $L_s$ for TR becomes $2$ after reconnection. Note that the integer $L_s$ jumps discontinuously through $\pm 1$ as a curve passes through a configuration containing a point of inflexion (Moffatt & Ricca Reference Moffatt and Ricca1992). Owing to the bi-symmetry of the vortex links, the curve deformation during the reconnection involves passage through two inflexional configurations. This explains why $L_s$ becomes $2$ for the TR. For the same reason, $L_s$ for the LR is also speculated to be $2$ – causing a doubling of the total linking number ( $L_k+L_s$) during reconnection. This argument can be confirmed in Appendix B for the smaller angle case (i.e. $\alpha =30^{\circ }$). As $Re$ increases, $W_r$ mildly increases, and $T_t$ decreases. Note that $T_t$ for TR further jumps around $t^{*}\approx 7$, which causes $L_s$ to increase from $2$ to $4$. As the numerical calculation of $T_t$ (and also $L_s$) is very sensitive at the inflexional configuration for which $T_t$ is discontinuous by $\pm 1$, the jump of $T_t$ suggests that additional inflexion points develop in the TR, which might be due to the influence of the other structures. Hence, in viscous flows, $T_t$ (also $L_s$) is also not conserved during the evolution.
Figure 19(a,b) shows the sum of  $L_k$ and $W_r$ for the vortex links before reconnection and for the TR after reconnection at $Re=2000$ and $4000$, respectively. Here, $H/\varGamma ^{2}$ is also included for comparison. The behaviour of $L_k+W_r$ here is similar to that observed in experiments in classical fluids by Scheeler et al. (Reference Scheeler, Kleckner, Proment, Kindlmann and Irvine2014) and also simulations in superfluids by Proment & Krstulovic (Reference Proment and Krstulovic2020). Before reconnection, $L_k+W_r$ continues to decrease. Although we are unable to resolve $W_r$ during reconnection and that for the LR, it seems that the evolution of $L_k+W_r$ is continuous through reconnection. It is confirmed in Appendix B for the $\alpha =30^{\circ }$ case, where $L_k+W_r$ for the total two rings varies continuously through reconnection – consistent with the claim made by Laing, Ricca & Sumners (Reference Laing, Ricca and Sumners2015).

Figure 19. Comparison between  $H/\varGamma ^{2}$ and the sum of Gauss link and writhe ( $L_k+W_r$) for (a) $Re=2000$ and (b) $4000$.
From figure 19, it is clear that that twist, which can be approximated as the difference between  $H/\varGamma ^{2}$ and $L_k+W_r$, is the main contributor to the complex helicity dynamics observed in figure 3. As both the experimental work by Scheeler et al. (Reference Scheeler, Kleckner, Proment, Kindlmann and Irvine2014) and the numerical work by Kivotides & Leonard (Reference Kivotides and Leonard2021) only considered $L_k+W_r$, the conservation of helicity is based on the assumption that the twist generated through reconnection is small and can be rapidly damped through viscous dissipation. From our DNS results and also the previous works by Zhao et al. (Reference Zhao, Yu, Chapelier and Scalo2021) and Zhao & Scalo (Reference Zhao and Scalo2021), this assumption is trivially invalid. The contribution of $T_w$ (especially $T_i$) to $H$ is very significant during and after reconnection and enlarges with increasing $Re$. Hence, it is expected that twist would play a more significant role at very high $Re$.
$Re$.
6. Concluding remarks
The DNS of two slender vortex rings in Hopf-link configuration is performed at three different  $Re$ (i.e. $2000$, $3000$ and $4000$). The global helicity $H$, although remaining constant before reconnection, increases during reconnection, followed by a rapid decay – both the growth and decay rates increase with $Re$. Before eventually decaying at the very late time, $H$ further increases after reconnection and reaches an almost quasi-plateau at high $Re$. In addition, the asymptotic value of the plateau increases with $Re$, suggesting that $H$ is not conserved at very high $Re$ – contrasting with the previous findings by Scheeler et al. (Reference Scheeler, Kleckner, Proment, Kindlmann and Irvine2014) and Kivotides & Leonard (Reference Kivotides and Leonard2021). We further discover that significant amounts of positive and negative twist helicities are simultaneously generated before and during reconnection, and the difference in their decay rates is the main reason for the increase of $H$ during reconnection. Different from what was observed for a trefoil knotted vortex (Yao et al. Reference Yao, Yang and Hussain2021; Zhao & Scalo Reference Zhao and Scalo2021), $H$ at higher $Re$ experiences strong oscillation, which is attributed to the subsequent reconnection and break-up of the closely cuddled LR.
The topological aspects of the helicity dynamics are also examined. The centreline helicity, calculated as  $H_c=\sum _i \varGamma _i \oint _{\mathcal {C}_i} \boldsymbol {u}\boldsymbol {\cdot } \boldsymbol {T}(s)\, \mathrm {d}s$, is found to be a good approximation for $H$ only before reconnection. It deviates from $H$ after reconnection, particularly at high $Re$. The writhe, $W_r$, is initially zero, continuously decreases before reconnection and experiences a sudden jump for the newly formed ring immediately after reconnection. However, the sum of link and writhe ( $L_k+W_r$) seems to vary continuously during reconnection – implying that link is mostly converted to writhe during reconnection. But during this conversion process, significant amount of twist ( $T_w$) is generated. Our results also clearly show that $T_w$, which continuously increases with $Re$, plays a significant role in the helicity dynamics, particularly at very high $Re$. It is worth mentioning that the initial configuration considered here is too idealized such that two reconnections occur simultaneously due to symmetry. It would be interesting to examine how the flow evolution and helicity dynamics are altered in a more complicated geometry, which is more generic in real flows.
Supplementary movie
Supplementary movie is available at https://doi.org/10.1017/jfm.2022.532.
Acknowledgements
Computational and visualization resources provided by Texas Tech University HPCC, TACC Lonestar, Frontera, and Stampede2 under XSEDE are acknowledged.
Declaration of interest
The authors report no conflict of interest.
Appendix A. Grid convergence analysis
We provide here a grid sensitivity analysis for Reynolds numbers  $Re=2000$ and $4000$. For each $Re$, three different grid resolutions are tested, namely, $N^{3}=512^{3}$, $768^{3}$ and $1024^{3}$ for $Re=2000$; and $N^{3}=1024^{3}$, $1536^{3}$ and $2048^{3}$ for $Re=4000$. Figures 20(a) and 20(b) show the time evolution of enstrophy $\varOmega$ and helicity $H$ for these cases. The good collapse of $\varOmega$ indicates that grid resolutions we employed in the main text are sufficient to capture the small scales generated during the reconnection process. In addition, good agreements for $H$ among different resolutions are also observed, particularly at earlier times. The small difference at the late times after reconnection might be due to the insufficiency in capturing the strong axial velocity associated with the twisted structures. Furthermore, to examine the domain size effect, an additional simulation with domain size $(3{\rm \pi} )^{3}$ is performed for $Re=2000$ with $N^{3}=1024^{3}$, which yields exactly the same results as the smaller domain case – confirming the adequacy of the domain size chosen in the main study.

Figure 20. Time evolution of (a) enstrophy  $\varOmega$ and (b) global helicity $H$ for $Re=2000$ (red), $4000$ (blue) with different grid resolutions and domain sizes.
Appendix B. Evolution of the link of vortex rings at a different angle
In this section, we consider the evolution of the link of two vortex rings at a smaller angle (i.e.  $\alpha =30^{\circ }$ in figure 1). Two different $Re$ (i.e. $2000$ and $4000$) are considered, and the grid resolutions for each $Re$ are identical to those used in the main text. Figure 21(a) shows the time progression of flow structures visualized based on vorticity magnitude isosurface $|\boldsymbol {\omega }|=0.04\omega _0$ for $Re=2000$. Similar to figure 2, the two rings become perturbed and become locally anti-parallel before reconnection. Note that, as the two rings are initially closer, the reconnection happens earlier than in the $\alpha =90^{\circ }$ case. After two simultaneous reconnections, the vortex link unties to form two distinct coiled vortex rings – quite different from that for the $\alpha =90^{\circ }$ case. These two rings then move upward as they rotate. The whole process is quite similar to that observed in Yao et al. (Reference Yao, Yang and Hussain2021) for the trefoil knotted vortex. Figure 21(b) shows the corresponding time progression of the vortex centrelines, which captures well the evolution of the vortex rings before and after reconnection.

Figure 21. Time evolution of flow structures represented by (a) vorticity isosurface  $|\boldsymbol {\omega }|=0.04\omega _0$ (shaded with helicity density $h=\boldsymbol {u}\boldsymbol {\cdot } \boldsymbol {\omega }$) and (b) vortex centrelines (shaded with centreline helicity density $h_c = \boldsymbol {u} \boldsymbol {\cdot } \boldsymbol {T}$) for vortex link with $\alpha =30^{\circ }$ at $Re=2000$.
The topological quantities (i.e.  $L_k$, $W_r$, $T_t$ and $L_s$) calculated based on the extracted vortex centrelines are shown in figure 22(a,b) for $Re=2000$ and $4000$, respectively. Before reconnection, the evolution of all these quantities is quite similar to that for the $\alpha =90^{\circ }$ case. After reconnection, $L_k$ again becomes zero. The value of $W_r$ for both rings becomes positive and slowly varies with time. In particular, similar to what is discussed in Yao et al. (Reference Yao, Yang and Hussain2021), $W_r$ continuously increases/decreases for the LR/TR – as the LR and TR are being stretched and compressed, respectively. In addition, the TR has a larger $W_r$, which is consistent with what is shown in figure 21 where the TR has more three-dimensional folding. The value of $T_t$ also abruptly increases for both rings during reconnection, but this time, $T_t$ for the LR is larger than that of the TR. Hence, $T_t$ is not conserved through reconnection, which is quite different from what was shown in Laing et al. (Reference Laing, Ricca and Sumners2015) for the ideal anti-parallel reconnecting segments. Consequently, after reconnection, $L_s(\equiv W_r+T_t)$ for each ring remains constant all the time and is equal to the value of $L_s$. This suggests that the total linking number ( $L_k+L_s$) doubles during reconnection, which is consistent with our previous findings for a trefoil knotted vortex (Yao et al. Reference Yao, Yang and Hussain2021). Note that whether such doubling of $L_k+L_s$ through reconnection is universal for various configurations needs further investigation.

Figure 22. Time evolution of Gauss link ( $L_k$), writhe ( $W_r$), torsion twist ( $T_t$) and self-link ( $L_s$) for vortex link with $\alpha =30^{\circ }$ at (a) $Re=2000$ and (b) $4000$.
Finally, figure 23 compares  $H/\varGamma ^{2}$ with $L_k+W_r$ at $Re=2000$ and $4000$. Different from the $\alpha =90^{\circ }$ case, $H$ slightly increases before reconnection, which is probably due to the strong mutual interaction of the vortex rings as they are closer at smaller $\alpha$. Similar to what is observed for the $\alpha =90^{\circ }$ case, $H/\varGamma ^{2}$ rapidly grows during reconnection and then decreases – suggesting that the increase of $H$ through reconnection is quite universal. However, the rapid decay of $H$ immediately after reconnection observed for the $\alpha =90^{\circ }$ case does not occur here – further implying that it is mainly due to the evolution of the LR. The value of $L_k+W_r$ also increases at the earlier time and becomes slightly higher than $H$, indicating the generation of negative twist helicity. It then decreases before the reconnection and rapidly drops during the reconnection. And the variation of $L_k+W_r$ seems to be continuous – indicating that the link is mainly converted to writhe during the unlinking process. The decay of $L_k+W_r$ slightly decreases with increasing $Re$. After reconnection, the variation of $L_k+W_r$ with time becomes limited and only has some slight oscillations, which is consistent with what was observed in Yao et al. (Reference Yao, Yang and Hussain2021) for the trefoil knotted vortex case. Again, the difference between $H/\varGamma ^{2}$ and $L_k+W_r$ increases with $Re$ – suggesting the more significant generation of $T_w$ at higher $Re$. Due to the dissipation of $T_w$, $H/\varGamma ^{2}$ and $L_k+W_r$ would eventually collapse, but the time it takes becomes much longer at higher $Re$.
$Re$.

Figure 23. Comparison between  $H/\varGamma ^{2}$ (solid line) and the sum of Gauss link and writhe $L_k+W_r$ (square) for vortex link with $\alpha =30^{\circ }$ at $Re=2000$ (red) and $Re=4000$ (black).
Appendix C. Helicity dynamics in asymmetric reconnection of colliding vortex rings
We demonstrate that the symmetry breaking in the generation of  $\pm h$ during asymmetric vortex reconnection causes significant helicity variation, by comparing DNS results in symmetric and asymmetric collision of two vortex rings. The symmetrical initial configuration (figure 24a) is set by the parameter equations
 \begin{equation} \left\{ \begin{array}{@{}l} c_{x,\pm}(\zeta)=\dfrac{\sqrt{2}}{2}\cos(\zeta) \mp \varepsilon, \\ c_{y,\pm}(\zeta)={-}\sin(\zeta), \\ c_{z,\pm}(\zeta)={\pm}\dfrac{\sqrt{2}}{2}\cos(\zeta), \end{array}\right. \end{equation}
where  $\varepsilon =0.85$ denotes the separation distance between two rings. The asymmetric initial configuration (figure 24b) is set by slightly rotating a ring by $\theta ={\rm \pi} /8$ around a diameter on the $x-z$ plane. The parametric equations for the rotated ring are
 \begin{equation} \left\{ \begin{array}{@{}l} c_{x,+}(\zeta)=\dfrac{\sqrt{2}}{2}[\cos (\zeta)+\sin (\zeta) \sin (\theta)]-\varepsilon, \\ c_{y,+}(\zeta)={-}\sin (\zeta) \cos (\theta), \\ c_{z,+}(\zeta)=\dfrac{\sqrt{2}}{2}[\cos (\zeta)-\sin (\zeta) \sin (\theta)]. \end{array}\right. \end{equation}
The other geometric parameters in these two cases are the same as those for the Hopf link, i.e.  $R_0=1$, $\varGamma _0=1$ and $\sigma =1 /(16 \sqrt {2 {\rm \pi}}) \approx 0.025$. The DNS with the initial conditions in (C1) and (C2) is performed at ${Re} = 2000$ with $N^{3}= 768^{3}$ grid points.

Figure 24. Initial (a) symmetric and (b) asymmetric configurations of a pair of vortex tubes represented by the vorticity isosurface at  $4\,\%$ of maximum initial vorticity.
The time evolutions of the symmetric and asymmetric vortex ring collisions in figure 25(a,b) look quite similar. The two unlinked vortex rings are reconnected into a coiled vortex ring. During the reconnection, two bridges separate outwards, along with threads stretching upwards. On the other hand, the subtle difference in the structural evolutions between symmetric and asymmetric cases is compared in figure 25(c,d), focusing on the small region of the bridge and adjacent threads. We can clearly observe the uneven generations of  $h$ for the main vortex tube and threads during the asymmetric reconnection. In particular, the pair of threads generate strong opposite helicity densities with significantly different magnitudes. On the contrary, the symmetry is preserved in the generation of $\pm h$ during the symmetric reconnection. Figure 26 plots the time evolution of $H$,
$H$,  $H^{+}$ and $H^{-}$ in symmetric and asymmetric reconnections. Similar to figure 6 for the Hopf link, both $|H^{+}|$ and $|H^{-}|$ surge during the reconnection. In the symmetric reconnection, the identical growths of $|H^{+}|$ and $|H^{-}|$ cancel each other, so $H$ is conserved. In the asymmetric reconnection, the relatively small difference in the growths of $|H^{+}|$ and $|H^{-}|$ in the skewed collision leads to the notable fluctuation of $H$.
$H$.

Figure 25. Time evolution of the isosurface of  $|\boldsymbol {\omega }|=0.04 \omega _0$ shaded by the helicity density in (a) symmetric and (b) asymmetric cases; close-up top views of the vortex structure after (c) symmetric and (d) asymmetric reconnections at $t^{*}=2$.

Figure 26. Time evolution of (a)  $H$ (solid line), (b) $H^{+}$ (dashed line) and $H^{-}$ (dash-dotted line) for symmetric (black) and asymmetric (red) cases. The circles denote $-H^{-}(t)$.
Figure 27(a,b) further shows the difference for the topological helicity decomposition in symmetric and asymmetric reconnections, respectively. In the former case, the positive and negative writhing or twisting of the perfectly symmetric vortex tube is completely cancelled out in the evolution. In the latter case, in contrast, the contacting vortex tubes are not strictly anti-parallel, leading to the changes in writhing and twisting and the fluctuation of  $H$.
$H$.

Figure 27. Time evolution of  $H/\varGamma ^{2}$ and the topological helicity decomposition in (a) symmetric and (b) asymmetric reconnection cases.
Appendix D. Effects of the vortex tube thickness
It is well known that the tube thickness  $\sigma$ of the vortex ring affects its self-induced velocity and, hence, its evolution. As shown in Yao & Hussain (Reference Yao and Hussain2020b), $\sigma$ also plays an important role in the reconnection process, i.e. the reconnection time and rate. Most importantly, the decay rate of helicity is strongly influenced by $\sigma$. Therefore, in this appendix, we examine the effect of $\sigma$ on the helicity evolution of the linked vortex rings by conducting an additional simulation with smaller initial tube thickness (i.e. $\sigma _0=1 /(32 \sqrt {2 {\rm \pi}})$) at $Re =2000$ on $N^{3}=1536^{3}$ grid points.
Figure 28(a) compares the evolutions of  $H$,
$H$,  $H^{+}$ and $H^{-}$ between the $\sigma _0=1 /(16 \sqrt {2 {\rm \pi}})$ and $1 /(32 \sqrt {2 {\rm \pi}})$ cases. It is clear that all these quantities follow similar trends between these two cases, with the only difference being that they surge earlier for the smaller tube thickness (i.e. $\sigma _0=1 /(32 \sqrt {2 {\rm \pi}})$) case, which is due to a larger convective velocity and, hence, an earlier reconnection. A good agreement between these two cases can also be observed for the $L_k+W_r$, particularly before reconnection (figure 28b) – suggesting that the helicity dynamics is less sensitive to $\sigma _0$.

Figure 28. Time evolution of (a)  $H$ (solid line), $H^{+}$ (dashed line) and $H^{-}$ (dash-dotted line) and (b) $L_k+W_r$ (square) for $\sigma _0=1/(16\sqrt {2{\rm \pi} })$ (red) and $\sigma _0=1/(32\sqrt {2{\rm \pi} })$ (red) cases at $Re=2000$.
Note that the similar evolution of helicity between these two different  $\sigma _0$ cases is somehow not unexpected. In viscous flows, the vortex tube thickness generally grows as $\sigma =\sqrt {\sigma ^{2}_0+2\nu t}$. Figure 29 shows the time evolution of $\sigma$ for different $\sigma _0$ and $\nu$ cases. For initially small tube thickness $\sigma _0$, the viscous effect soon becomes the dominant contribution to $\sigma$ for the large $\nu$ case. Consequently, the difference of $\sigma$ between different $\sigma _0$ becomes smaller. Interestingly, at $\nu =1/2000$, the evolution of $\sigma$ for $\sigma _0=1 /(32 \sqrt {2 {\rm \pi}})$ is also very close to the case with zero initial tube thickness (i.e. $\sigma _0=0$), which implies that the helicity evolution at $Re=2000$ would still be quite similar to that shown in figure 28 for even smaller $\sigma$. Figure 29 also shows that the relative difference in $\sigma$ increases with decreasing $\nu$ – suggesting that the flow evolution and the associated helicity dynamics between different $\sigma _0$ might be quite different at high $Re$. However, due to the spatial requirement for resolving the fine vortex core and small scales generated during reconnection, it is currently rather challenging to employ DNS to exam it, but it is definitely a subject that is worth pursuing in the future.

Figure 29. Time evolution of the vortex tube thickness  $\sigma$ for different $\sigma _0$ and $\nu$ cases.


 Open access