


1. Introduction
Shock-containing supersonic jets often generate high-intensity tones at discrete frequencies, such as the screech tones of underexpanded free jets (Tam Reference Tam1995; Raman Reference Raman1999) and impingement tones generated by the jets that impinge on a plate (Henderson & Powell Reference Henderson and Powell1993; Edgington-Mitchell Reference Edgington-Mitchell2019). It is widely recognized that the discrete tones generated in underexpanded jets are due to the acoustic feedback loops that are established in the flow (Edgington-Mitchell Reference Edgington-Mitchell2019). The self-sustaining feedback loop in underexpanded jets can be divided into four physical processes (Raman Reference Raman1999; Edgington-Mitchell Reference Edgington-Mitchell2019): the downstream propagation of instability waves, the generation process of upstream-propagating disturbances, the upstream propagation of disturbances, and the receptivity process near the nozzle exit. The downstream-propagating component of the feedback loop is generally thought to be the Kelvin–Helmholtz (K–H) wavepacket (Jordan & Colonius Reference Jordan and Colonius2013), which extracts energy from the mean flow to maintain the feedback loop (Tam & Ahuja Reference Tam and Ahuja1990). Using the adjoint equation approach, Barone & Lele (Reference Barone and Lele2005) developed a framework for the receptivity analysis of compressible free shear flows. Mitchell, Honnery & Soria (Reference Mitchell, Honnery and Soria2012) investigated experimentally the receptivity process near the nozzle exit for supersonic impinging jets. The schlieren images recorded by ultra-high-speed cameras showed that the arrival of upstream-propagating acoustic waves at the nozzle lip generates sinusoidal disturbances in the jet shear layer, then these disturbances grow into the downstream-propagating coherent structures. Karami et al. (Reference Karami, Stegeman, Ooi, Theofilis and Soria2020) investigated the receptivity near the nozzle exit of underexpanded impinging jets by solving the linearized three-dimensional Navier–Stokes equations. The azimuthal mode numbers and Strouhal numbers of the external disturbances that have the highest receptivity are determined by a transfer function defined as the ratio of the output flow energy to the input energy of the acoustic disturbance.
1.1. Sound-generation and resonance-closure mechanisms for underexpanded free jets
The screech frequencies of underexpanded free jets decrease steadily with the increase of the nozzle pressure ratio (NPR). But at some particular NPR ranges, abrupt jumps of screech frequencies appear (Powell Reference Powell1953). For screeching axisymmetric jets, as the degree of jet underexpansion is increased, the instability mode of jets changes successively from the axisymmetric A1 mode to another axisymmetric A2 mode, a flapping B mode, a helical C mode, and finally another flapping D mode (Powell Reference Powell1953; Davies Reference Davies1962; Powell, Umeda & Ishii Reference Powell, Umeda and Ishii1992; Li et al. Reference Li, Zhang, Hao and He2020).
Powell (Reference Powell1953) first described the screech phenomenon of axisymmetric underexpanded free jets, and proposed that the screech tone was generated from a series of monopole sources that are located at the shock tips. The phase relationship between these sources leads to the directive radiation of screech tone in the upstream direction. The weakest link model of Tam & Tanna (Reference Tam and Tanna1982) suggested that the interaction between the K–H wavepacket and the shock cells produces two wave-like disturbances whose wavenumbers are respectively the sum and difference of the wavenumbers of the K–H wavepacket ( $k_h$) and the shock cells ( $k_s$). The phase velocity of the disturbances can be negative and supersonic when $k_h$ and $k_s$ are close (Tam, Parrish & Viswanathan Reference Tam, Parrish and Viswanathan2014). The supersonic disturbances lead to the production of upstream-propagating acoustic waves via the Mach wave radiation (Tam Reference Tam2009). The shock-leakage theory (Manning & Lele Reference Manning and Lele1998; Suzuki & Lele Reference Suzuki and Lele2003; Shariff & Manning Reference Shariff and Manning2013) explains the physical mechanism of how the interaction between a vortex in the shear layer and a shock generates acoustic waves. For underexpanded free jets, the shock-leakage phenomenon has been observed in the large eddy simulation of a planar jet (Berland, Bogey & Bailly Reference Berland, Bogey and Bailly2007) and in the schlieren visualizations of round jets (Edgington-Mitchell et al. Reference Edgington-Mitchell, Weightman, Lock, Kirby, Nair, Soria and Honnery2021b).
The upstream-propagating component in the screech feedback loop of underexpanded free jets is traditionally considered as the upstream-propagating freestream acoustic waves. Shen & Tam (Reference Shen and Tam2002) first proposed that the upstream-propagating guided jet modes (Tam & Hu Reference Tam and Hu1989) could act as the upstream-travelling waves in the feedback loops for the A2 and C screech modes. In recent years, Edgington-Mitchell et al. (Reference Edgington-Mitchell, Jaunet, Jordan, Towne, Soria and Honnery2018) and Gojon, Bogey & Mihaescu (Reference Gojon, Bogey and Mihaescu2018) provided experimental and numerical evidence to support that the screech feedback loops in the A1, A2 and C modes are closed by the guided jets modes. For the A1 and A2 screech modes, the screech frequency prediction models based on the guided jet mode (Mancinelli et al. Reference Mancinelli, Jaunet, Jordan and Towne2019, Reference Mancinelli, Jaunet, Jordan and Towne2021) provide a better agreement with experimental observations than other models in which the feedback loop is closed by the freestream acoustic waves. Edgington-Mitchell et al. (Reference Edgington-Mitchell, Wang, Nogueira, Schmidt, Jaunet, Duke, Jordan and Towne2021a) investigated the interaction between various wave-like structures in screeching jets via experimental measurements and linear stability analyses. They demonstrated that the upstream-propagating guided jet modes are energized by the interaction between the K–H wavepacket and shock cells in screeching jets. Recently, Nogueira et al. (Reference Nogueira, Jordan, Jaunet, Cavalieri, Towne and Edgington-Mitchell2022b) conducted linear stability analyses on shock-containing jets by taking a spatially periodic mean flow as a surrogate of shock cells. An absolute instability mechanism between the K–H mode and the upstream-propagating guided jet mode is discovered. The frequencies and mode shapes related to the absolute instability have good agreement with the screech frequencies and the most energetic coherent structures of screeching jets. Then, via a similar methodology, Nogueira et al. (Reference Nogueira, Jaunet, Mancinelli, Jordan and Edgington-Mitchell2022a) also suggested that the A1 screech mode is closed by the guided jet mode generated by the interaction between the K–H mode and the primary wavenumber of the averaged shock structures. The A2 mode is associated with the interaction between the K–H wavepacket and the first suboptimal wavenumber peak of the shock structures. Furthermore, Edgington-Mitchell et al. (Reference Edgington-Mitchell, Li, Liu, He, Wong, Mackenzie and Nogueira2022) demonstrated that the upstream-propagating guided jet modes are shown to be active in all stages of screech, and the mode staging of screech tone can be due to either a change in which peak of the shock spectra the K–H wavepacket is interacting with, or a change in azimuthal mode, or both.
1.2. Acoustic resonance of vertical jet impingement
Because of the existence of the plate, the flow structures of underexpanded impinging jets are more complex (Henderson Reference Henderson2002). The staging behaviour of impinging tones is dependent largely on the NPR and the nozzle-to-plate spacing (Edgington-Mitchell Reference Edgington-Mitchell2019). Multiple intense tones are often present simultaneously in impinging jets (Henderson & Powell Reference Henderson and Powell1993), and sometimes, the impinging tones that are produced for the plate spacings between  $5D$ and $10D$ are related to the jet screech (Henderson Reference Henderson2002).
Several theories are proposed to explain the generation process of upstream-propagating disturbances in underexpanded impinging jets. Henderson (Reference Henderson2002) suggested that the oscillation of the standoff shock is responsible for the production of upstream-propagating waves in both small- and large-plate impingement. Nevertheless, discrete tones are also observed in subsonic impinging jets (Tam & Ahuja Reference Tam and Ahuja1990). This means that the interaction between the downstream-propagating K–H wavepacket and the impinging plate can produce intense tones in the absence of shock structures. Henderson, Bridges & Wernet (Reference Henderson, Bridges and Wernet2005) examined the generation process of impinging tones via phase-locked particle image velocimetry measurements. They demonstrated that the tones are generated in the wall jet at radial distance  $1.3D$. The oscillations of the boundary of the wall jet lead to the production of upstream-propagating waves. Weightman et al. (Reference Weightman, Amili, Honnery, Soria and Edgington-Mitchell2017b) proposed that the periodic transient shocks in the wall jet of underexpanded impinging flows are responsible for the production of the impinging tone. The time delay between the inception of the shock and the formation of the acoustic wave also explains the phase lag in the phase criterion of feedback loop. However, Bogey & Gojon (Reference Bogey and Gojon2017) conducted numerical simulations on supersonic impinging round jets, and they observed that upstream-propagating acoustic waves are produced in the region of jet impingement. Additionally, in the experiments of Weightman et al. (Reference Weightman, Amili, Honnery, Edgington-Mitchell and Soria2017a), acoustic waves are observed to be produced at the edges of the standoff shock, which is like the shock-leakage phenomena.
Tam & Ahuja (Reference Tam and Ahuja1990) first evidenced the role of the upstream-propagating guided jet modes in the resonance loop of subsonic impinging jets. In the numerical studies of Gojon, Bogey & Marsden (Reference Gojon, Bogey and Marsden2016) and Bogey & Gojon (Reference Bogey and Gojon2017), by combining the feedback model (Ho & Nosseir Reference Ho and Nosseir1981) and the dispersion relations of upstream-propagating guided jet modes, the tone frequencies, the mode number of the feedback loop, and the oscillation modes of ideally expanded supersonic impinging jets are well determined. However, in the experimental investigations of Henderson et al. (Reference Henderson, Bridges and Wernet2005) and Weightman et al. (Reference Weightman, Amili, Honnery, Soria and Edgington-Mitchell2017b), visualizations of flow fields showed that freestream acoustic waves travel to the nozzle exit outside the jet, perturb the shear layer and close the feedback loop.
1.3. Jet impingement on an inclined plate
There are numerous instances of supersonic jet impingement against an angled surface (Edgington-Mitchell Reference Edgington-Mitchell2019). When supersonic jets impinge on inclined flat plates, the flow structures are shown to be highly complex due to the local structure of the free jet and the interactions between shock waves in the free jet and those created by the plate (Lamont & Hunt Reference Lamont and Hunt1980). The flow and acoustic fields of ideally expanded supersonic jets impinging on an inclined flat plate were investigated extensively. At least three types of acoustic waves are observed in the flow fields: Mach waves generated from the shear layer of main jets, acoustic waves generated from the impingement region, and Mach waves generated from the shear layer of the supersonic flow downstream of the jet impingement (Nonomura, Goto & Fujii Reference Nonomura, Goto and Fujii2011). The source locations and possible mechanism of the second type of acoustic waves are investigated further in Nonomura et al. (Reference Nonomura, Honda, Nagata, Yamamoto, Morizawa, Obayashi and Fujii2016). Akamine et al. (Reference Akamine, Nakanishi, Okamoto, Teramoto, Okunuki and Tsutsumi2015) studied the propagation directions, the spectra, and the extent of the source regions of the acoustic waves using the results of microphone measurements and schlieren visualizations. Brehm, Housman & Kiris (Reference Brehm, Housman and Kiris2016) proposed that the noise generation in the jet-impingement region is attributed to vortex stretching and tearing, and shock oscillations induced by the motion of downstream-propagating coherent structures, and the noise generation in the wall jet is associated with supersonically convecting large-scale coherent flow structures. Several tones are produced when planar supersonic jets impinge on inclined plates, and these tones are due to the feedback mechanism between the nozzle lips and the flat plate (Gojon & Bogey Reference Gojon and Bogey2019). Based on amplitude fields and velocity spectra in the jet shear layer, the feedback mechanism seems to be established mainly along the lip farther away from the plate. However, the acoustic resonance mechanism of the underexpanded jets that impinge on an inclined plate is not been investigated extensively.
The K–H wavepacket and shock cell structures also exist in the flow fields of underexpanded impinging jets. The interaction between the K–H wavepacket and shock cell structures, and the absolute instability mechanism between the K–H mode and the upstream-propagating guided jet mode, might also be associated with the acoustic resonance in impinging jets. It is natural that the spatial characteristics of shock structures are altered by the appearance of the impinging plate, and so are the frequencies and instability modes of acoustic resonances. In the present paper, the resonance mechanism and mode staging process for the axisymmetric screech modes of underexpanded jets that impinge on an inclined plate are studied experimentally. The paper is organized as follows. An introduction to the experimental set-up and the post-processing methods of experimental results are given in § 2. In § 3, experimental results of acoustic measurements and schlieren visualizations are displayed in detail. The influence of the impinging plate on the averaged shock structures is analysed. The flow structures that are associated with the generation of tones are extracted, and a discussion on the mode staging mechanism is presented. The screech frequencies of different modes are predicted by the phase criterion of the acoustic feedback loop. Concluding remarks are given in § 4.
2. Experimental set-up and post-processing methods
2.1. Experimental set-up
The experimental facilities and instruments used in the present study are shown schematically in figure 1. These facilities are optimized for schlieren visualizations and not anechoic. The cases considered here are cold jets issuing from a converging nozzle that has exit diameter  $D=10$ mm and contraction ratio 6.25 : 1. The external lip thickness of the nozzle is 5 mm ( $0.5D$). This nozzle lip thickness is intermediate compared with those used in the experiments of Powell et al. (Reference Powell, Umeda and Ishii1992) and Weightman et al. (Reference Weightman, Amili, Honnery, Edgington-Mitchell and Soria2019). The inner wall of the nozzle is smooth, and the jets are not tripped. As presented in figure 1(b), underexpanded jets impinge on an inclined plate with an impingement angle of $30^{\circ }$ in the present experiments. This impinging plate is a round aluminium plate with diameter 50.0 $D$. At the jet centreline, the impinging distance is set as 5.0 $D$, and the impinging distances at the upper and lower lip lines are $5.9D$ and $4.1D$, respectively. The static pressure 5 $D$ upstream of the nozzle exit is measured by using a COSMO digital pressure gauge. The measurement range of this pressure gauge is from 0 to 1.000 MPa, and the accuracy is 0.25 % of full scale. The total pressure upstream of the nozzle ( $p_0$) is further calculated based on isentropic flow relations. The NPR is defined as the ratio between $p_0$ and the ambient pressure $p_\infty$, and ranges from 2.0 to 4.0. The corresponding range of the ideally expanded jet Mach number $M_j$ is $[1.05, 1.56]$. The Reynolds number $Re_j = \rho _j U_j D / \mu _j$ ranges from $2.1\times 10^5$ to $2.7\times 10^5$, where $\rho _j$, $U_j$ and $\mu _j$ are respectively the ideally expanded jet density, velocity and dynamic viscosity.

Figure 1. Schematics of (a) the test facilities and (b) the nozzle and impinging plate.
Acoustic measurements are conducted by using a  $1/4$ inch diameter condenser microphone (Ono Sokki MI-1531) and a preamplifier (Ono Sokki MI-3140) with frequency range $10\ {\rm Hz}\unicode{x2013}100\ {\rm kHz}$. As shown in figure 1(a), the microphone is located at angle $120^{\circ }$ (measured from the downstream axis) and distance $50D$ from the nozzle exit. The microphone is calibrated by a sound calibrator (Ono Sokki SC-3120) prior to the measurements. The acoustic signals are analysed by using a fast Fourier transform (FFT) analyser (Ono Sokki CF-9400). A Hanning window function with $50\,\%$ overlap is used. The FFT analysis provides the noise spectra with highest frequency 100 kHz. These noise spectra are averages of 20 samples. The frequency resolution of the noise spectra is 62.5 Hz.
The time-resolved schlieren images are obtained by using a Photron Fastcam SA-Z high-speed camera. The frame rate of the camera is set as 80 000 frames per second. For the vast majority of cases in the present study, at least four images are recorded during a single period of the dominant screech tone. At this frame rate, the schlieren images are recorded with array size  $640\times 360$ pixels. 48 pixels are contained in the range of the nozzle diameter. By considering the frame rate and the light intensity, the exposure time is set as $6.25\ \mathrm {\mu }{\rm s}$. The knife edge is set perpendicular to the jet axis. Variations of axial density gradients integrated along the optical path are observed in the current schlieren images.
2.2. Decomposition of schlieren data
The time-resolved schlieren image sequences contain a wealth of information about the flow dynamics (Edgington-Mitchell et al. Reference Edgington-Mitchell, Weightman, Lock, Kirby, Nair, Soria and Honnery2021b). Spectral proper orthogonal decomposition (SPOD) introduced by Towne, Schmidt & Colonius (Reference Towne, Schmidt and Colonius2018) is a model analysis method to extract coherent structures or modes from experimental and computational flow data. Each SPOD mode oscillates at a single frequency. SPOD combines the advantages of the dynamic mode decomposition (Schmid Reference Schmid2010) in terms of the temporal correlation among the resulting modes with the optimality and orthogonality of the standard proper orthogonal decomposition (Schmidt & Colonius Reference Schmidt and Colonius2020). Here, in order to educe the information of schlieren images associated with the acoustic resonance of impinging jets, SPOD is applied on the greyscales of schlieren sequences  $\boldsymbol{\mathsf{G}}$. The specific algorithm for computing SPOD modes from flow snapshots can be found in Towne et al. (Reference Towne, Schmidt and Colonius2018) and Schmidt & Colonius (Reference Schmidt and Colonius2020). For the sake of completeness, the algorithm is outlined here briefly. The vector $\boldsymbol {g}_i \in \mathbb {R}^N$ represents the instantaneous greyscales of a schlieren image at time $t_i$, which we call a snapshot of the flow. The length $N$ of the vector is the number of pixels in a schlieren image. Now, $M$ flow snapshots with an equal time spacing are recorded by the high-speed camera. This data set can be represented by the data matrix
 \begin{equation} \boldsymbol{\mathsf{G}} = [\boldsymbol{g}_1, \boldsymbol{g}_2, \ldots, \boldsymbol{g}_M] \in \mathbb{R}^{N\times M}. \end{equation}
Subsequently,  $\boldsymbol{\mathsf{G}}$ is divided into a set of smaller and overlapping blocks as follows:
 \begin{equation} \boldsymbol{\mathsf{G}}^{(n)} = [\boldsymbol{g}^{(n)}_1, \boldsymbol{g}^{(n)}_2, \ldots, \boldsymbol{g}^{(n)}_{N_f}] \in \mathbb{R}^{N\times N_f}, \end{equation}
where  $\boldsymbol{\mathsf{G}}^{(n)}$ is the $n$th block, consisting of $N_f$ flow snapshots. The $i$th entry in $\boldsymbol{\mathsf{G}}^{(n)}$ is $\boldsymbol {g}_{i+(n-1)(N_f-N_o)}$, where $N_o$ is the number of snapshots by which the blocks overlap. The total number of blocks $N_b$ can be calculated as $\lfloor (M-N_o)/(N_f-N_o)\rfloor$, where $\lfloor {\cdot } \rfloor$ denotes the floor operator. The discrete Fourier transform (DFT) is computed for each block in the temporal direction. To reduce spectral leakage, a Hanning window is used in the present analyses. Also, $\hat {\boldsymbol {g}}^{(n)}_j$ is the Fourier component at frequency $f_j$ in the $n$th block. All realizations at a given frequency $f_j$ are collected into the new data matrix
 \begin{equation} \hat{{\mathsf{G}}}_{f_j} = [\hat{\boldsymbol{g}}^{(1)}_j, \hat{\boldsymbol{g}}^{(2)}_j, \ldots, \hat{\boldsymbol{g}}^{(N_b)}_j]. \end{equation}
SPOD eigenvectors and eigenvalues are obtained by solving the eigenvalue problem
 \begin{equation} \hat{{\mathsf{G}}}_{f_j}^* \boldsymbol{\mathsf{W}} \hat{{\mathsf{G}}}_{f_j} \boldsymbol{\varTheta}_{f_j}= \boldsymbol{\varTheta}_{f_j} \boldsymbol{\varLambda} _{f_j}, \end{equation}
where  $\boldsymbol{\mathsf{W}}$ is the weight matrix. Then the SPOD modes for a given $f_j$ can be obtained from the eigenvectors $\boldsymbol {\varTheta }_{f_j}$ as $\hat {\boldsymbol {\varPsi }}_{f_j} = \hat{{\mathsf{G}}}_{f_j} \boldsymbol {\varTheta }_{f_j} \boldsymbol {\varLambda }_{f_j}^{-1/2}$, and the diagonal matrix of eigenvalues $\boldsymbol {\varLambda }_{f_j}$ contains the energy of the SPOD modes.
Coherent structures at a specific frequency  $f_j$ are contained in the SPOD modes $\hat {\boldsymbol {\varPsi }}_{f_j}$. These structures can be associated with a broad range of wavenumbers. The DFT in the jet axial direction is conducted on a chosen SPOD mode $\hat {\boldsymbol {\psi }}_{f_j}(x,y)$. Within the axial domain defined as $[x_1,x_2]$, the spatial Fourier coefficients $\boldsymbol {I}_{f_j,k}(y)$ are obtained from
 \begin{equation} \boldsymbol{I}_{f_j,k}(y)= \sum_{x=x_1}^{x_2} \hat{\boldsymbol{\psi}}_{f_j}(x,y)\,\mathrm{e}^{-{\rm i}kx}, \end{equation}
where  $k$ is the axial wavenumber, and $i=\sqrt {-1}$. In order to analyse the different components of the acoustic feedback loop further, bandpass wavenumber filters are applied. The wave structures $\tilde {\boldsymbol {\psi }}_{f_j,[k_1,k_2]}(x,y)$ within the axial wavenumber domain $[k_1,k_2]$ are reconstructed via
 \begin{equation} \tilde{\boldsymbol{\psi}}_{f_j,[k_1,k_2]}(x,y)=\sum_{k=k_1}^{k_2} \boldsymbol{I}_{f_j,k}(y)\,\mathrm{e}^{{\rm i}kx}. \end{equation}
3. Results and discussions
3.1. Results of acoustic measurements and schlieren visualizations
The acoustic measurements in the present study are not conducted in an anechoic environment. The purpose of these measurements is to obtain the frequencies of screech tones. In order to explore the influence of the inclined impinging plate on the evolutionary process of screech frequencies, acoustic measurements are conducted on underexpanded free jets and the underexpanded jets that impinge on an inclined plate. The results of the acoustic experiments are presented in figure 2. As shown in figure 2(a), with the increase of  $M_j$, the screech frequencies of free jets exhibit several typical stages, and the tonal frequencies of impinging jets are also divided into similar stages in figure 2(b). However, there are some differences in the mode staging processes of the axisymmetric screech modes between free and impinging jets. The $M_j$ range for the A2 screech mode of impinging jets is obviously wider than that of underexpanded free jets. For underexpanded free jets, the screech mode transforms from the A2 mode to the B mode around $M_j=1.19$ ( ${\rm NPR} = 2.40$), which agrees with our previous results (Li et al. Reference Li, Liu, Hao, Zhang and He2021). As shown in figure 2(b), the impinging jets generate strong tones that belong to the A2 mode until $M_j=1.28$ ( ${\rm NPR}=2.70$). When $M_j$ is around 1.36 ( ${\rm NPR} \approx 3.0$), the dominant screech mode of free jets is the flapping B mode or the helical C mode. In figure 2(b), from $M_j=1.28$ to $M_j=1.45$, there are evident tones of impinging jets in the frequency range where the axisymmetric upstream-propagating guided jet mode $(0,2)$ (Tam & Ahuja Reference Tam and Ahuja1990) is propagable. In the following subsections, the analysis results of schlieren data will indicate that the azimuthal feature of the dominant flow structures at these tonal frequencies is axisymmetric. This screech mode is denoted as A3 in the present paper. The tonal frequencies belonging to the axisymmetric screech modes of free and impinging jets are extracted from figures 2(a) and 2(b), and compared with each other in figure 2(c). At the same $M_j$, the screech frequency of free jets agrees well with that of impinging jets.

Figure 2. Contour of the sound pressure level (SPL) as a function of  $M_j$ for (a) underexpanded free jets, and (b) impinging jets. Here, $St_j = f D_j / U_j$, where $f$ is the frequency, $D_j$ is the ideally expanded equivalent jet diameter, and $U_j$ is the ideally expanded velocity. The screech frequencies of axisymmetric modes in (a,b) are extracted and plotted in (c). The black, magenta and blue symbols in (c) indicate the A1, A2 and A3 screech modes, respectively. Dotted and dashed red lines, respectively, correspond to the branch- and saddle-point tracks of the $(0,2)$ upstream-propagating guided jet mode (Tam & Ahuja Reference Tam and Ahuja1990).
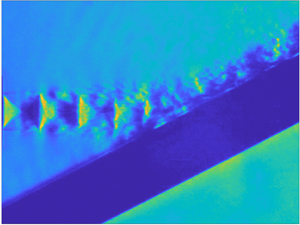
Based on the above-mentioned acoustic results, three flow conditions,  $M_j= 1.12$, 1.28 and 1.40, are chosen to investigate the acoustic resonance mechanism of the A1, A2 and A3 screech modes for the underexpanded jets that impinge on an inclined plate. The schlieren snapshots of the impinging jets at these three Mach numbers are shown in figure 3, and the schlieren snapshots of the free jets at the same $M_j$ are also plotted as a reference. The nozzle exit is located at $X/D=0$. In these schlieren images, negative density gradients in the jet axial direction appear as the brighter regions, such as the expansion fan near the nozzle exit, and positive density gradients in the jet direction correspond to the darker regions, such as the shocks in the jet core. Along the jet shear layer, the successive bright and dark regions are respectively associated with the expansion and compression parts of the K–H wavepacket. At $M_j= 1.12$, both the free and impinging jets generate the screech tones of the axisymmetric A1 mode. As shown in figures 3(a,d), in the axial range of the first several shock cells, the dominant instability waves of the free and impinging jets are nearly symmetric with respect to the jet axis. For the free jets, the dominant screech mode is the B mode at $M_j= 1.28$, and transforms from the B mode to the C mode at $M_j=1.40$. The instability waves in the upper and lower sides of the free jets are out of phase in figures 3(b,e) and 3(c, f). As shown in figure 2(b), at $M_j=1.28$ and 1.40, the impinging jets generate multiple tones that respectively belong to the axisymmetric and antisymmetric modes. Thus the features of instability waves in the shear layers of impinging jets are more complex, as presented in figures 3(b,e) and 3(c, f).

Figure 3. Schlieren snapshots of (a–c) underexpanded free jets, and (d–f) impinging jets, at (a,d)  $M_j=1.12$, (b,e) $M_j=1.28$, and (c, f) $M_j=1.40$.
3.2. Characteristics of averaged shock structures
As shown in figure 3, underexpanded jets impinge on the inclined plate, and downstream of the impingement location, the deflected jet turns into a wall jet (Brehm et al. Reference Brehm, Housman and Kiris2016). Previous experiments of André, Castelain & Bailly (Reference André, Castelain and Bailly2014) determined that the potential core length of an underexpanded free jet is approximately  $9D$, and the potential core becomes longer with the increase of $M_j$. In the current experimental configuration, the jet impingement occurs before the end of the potential core. Thus the inclined plate can influence the shock cell structures to some extent.
Integrated spatial characteristics of shock cell structures are required to explain the staging behaviour of screeching free jets (Edgington-Mitchell et al. Reference Edgington-Mitchell, Li, Liu, He, Wong, Mackenzie and Nogueira2022; Nogueira et al. Reference Nogueira, Jaunet, Mancinelli, Jordan and Edgington-Mitchell2022a). Therefore, the averaged shock structures in the underexpanded jets impinging on an inclined plate are analysed in detail. The averaged schlieren images of the underexpanded impinging jets at  $M_j=1.12$, 1.28 and 1.40 are shown in figure 4, and the averaged schlieren images of their free counterparts are also displayed as a reference. These averaged schlieren images are obtained by using 2560 successive schlieren images. Hundreds of screech periods are contained in this duration. The averaged greyscale distributions along $Y/D = 0$, and their wavenumber spectra, are also presented in figure 4 to better demonstrate the similarities and differences between averaged shock structures in underexpanded free and impinging jets. The streamwise domain of spatial Fourier transforms for impinging jets is $0\leqslant X/D\leqslant 6$. For underexpanded free jets, the axial fluctuations of greyscales associated with shock cells are almost invisible at $10D$ downstream of the nozzle exit. The streamwise domains for spatial transforms of free jets are respectively set as $0\leqslant X/D\leqslant 10$ and $0\leqslant X/D\leqslant 6$, to analyse the effect of the domain lengths on the shock wavenumber spectra.

Figure 4. Averaged schlieren images, distributions and wavenumber spectra of averaged greyscales along  $Y/D=0$ of underexpanded free and impinging jets at (a) $M_j=1.12$, (b) $M_j=1.28$, and (c) $M_j=1.40$. The primary shock wavenumber peak $k_{s1}$ is indicated by the red square. The first and second suboptimal shock wavenumber peaks ( $k_{s2}$ and $k_{s3}$) are respectively indicated by the magenta and cyan squares.
The wavenumber spectra of underexpanded free and impinging jets that are shown in figure 4 have similar features. There is a primary peak in each wavenumber spectrum that is associated with the first several shock cells whose shock spacings are relatively constant. On the right of this primary peak, a series of suboptimal peaks represent the axial variation in shock spacing that occurs further downstream (Edgington-Mitchell et al. Reference Edgington-Mitchell, Li, Liu, He, Wong, Mackenzie and Nogueira2022). The primary shock wavenumber peak is denoted as  $k_{s1}$ and is indicated by the red squares in figure 4; the first and second suboptimal shock wavenumber peaks are denoted as $k_{s2}$ and $k_{s3}$, indicated by the magenta and cyan squares, respectively. As shown in figure 4, the spacings of the first several shock cells of impinging jets have good agreement with those of the corresponding free jets. Thus the $k_{s1}$ values of impinging jets are very close to those of the corresponding free jets. However, the shock cells of impinging jets, which are located just upstream of the impinging plate, are obviously shorter. By comparing with the corresponding free jets, the sixth and seventh shock cells of the $M_j=1.12$ impinging jet, the fifth shock cell of the $M_j=1.28$ impinging jet, and the fourth shock cell of the $M_j=1.40$ impinging jet have shorter spacings. The axial variation of shock spacings of impinging jets is more drastic because of the existence of the impinging plate. Correspondingly, at $M_j =1.12$ and 1.28, the $k_{s2}$ values of impinging and free jets are very close to each other, and the $k_{s3}$ values of impinging jets have higher wavenumbers. In the case $M_j=1.40$, the wavenumbers of both $k_{s2}$ and $k_{s3}$ of the impinging jet are higher than those of the corresponding free jet. It is indicated that the effect of the impinging plate on jet shock cell structures becomes more obvious with the increase of $M_j$. Furthermore, in each case of figure 4, the peaks in the wavenumber spectra of the free jet based on different domain lengths are close to each other. This implies that the influence of domain lengths for spatial Fourier transforms on the shock spectra of free jets is limited, and the above-mentioned differences in the shock wavenumber spectra between the free and impinging jets are not due to the different domain lengths.
In order to analyse the sensitivities of  $k_{s1}$, $k_{s2}$ and $k_{s3}$ to the choice of radial position, spatial Fourier transforms are conducted at different radial positions, and the resultant wavenumber spectra are represented in figure 5. As shown in figure 4, the averaged shock structures of free jets are symmetric with respect to the jet axis. The high-amplitude regions corresponding to $k_{s1}$, $k_{s2}$ and $k_{s3}$ in the shock wavenumber spectra of free jets are concentrated mainly at the jet axis, as displayed in figure 5. Thus the determinations of the peak wavenumbers of averaged shock cells for free jets are based on the wavenumber spectra along $Y/D=0$. For impinging jets, as shown in figure 5, the high-amplitude regions corresponding to $k_{s1}$ and $k_{s2}$ are also located mainly at the jet axis. The $k_{s3}$ values can still be determined at the jet axis in figures 5(a), 5(b) and 5(c). However, for the impinging jet at $M_j= 1.51$, there are two spots of higher amplitudes near $Y/D= \pm 0.25D$ on the right of the $k_{s2}$, as shown in figure 5(d). This is because of the asymmetry of averaged shock structures under the influence of the inclined impinging plate at higher $M_j$. In view of the approximate wavenumbers of these two high-amplitude spots, $k_{s3}$ is defined as the average of the wavenumbers corresponding to the maximum amplitude points of these two spots for these cases, to represent the axial variation in shock spacing.

Figure 5. Normalized wavenumber spectra of averaged schlieren images for underexpanded free and impinging jets at (a)  $M_j=1.12$, (b) $M_j=1.28$, (c) $M_j=1.40$, and (d) $M_j=1.51$. In each panel, the top image is the spectrum of the free jet and the bottom image is the spectrum of the impinging jet. The primary shock wavenumber peak $k_{s1}$ is indicated by the red square. The first and second suboptimal shock wavenumber peaks ( $k_{s2}$ and $k_{s3}$) are respectively indicated by the magenta and cyan squares.
The full spectrum representations of averaged shock structures for underexpanded free and impinging jets are displayed in figures 6(a) and 6(b), respectively. The range of  $M_j$ is from 1.09 to 1.56. The wavenumber spectra of 20 cases are displayed in each figure. The wavenumber spectrum in $-0.5 \leqslant Y/D \leqslant 0.5$ of the time-averaged schlieren image is plotted for each case. Nogueira et al. (Reference Nogueira, Jaunet, Mancinelli, Jordan and Edgington-Mitchell2022a) suggested that the A1 and A2 screech modes are respectively closed by the guided jet modes that are energized by the interaction between the K–H wavepacket and the first two shock wavenumber peaks. The $k_{s1}$ and $k_{s2}$ values of free and impinging jets are extracted from figures 6(a) and 6(b), and are compared in figure 6(c). In the present $M_j$ range, the $k_{s1}$ value of impinging jets has good agreement with that of free jets, and the specific values of $k_{s2}$ of impinging jets are slightly higher than those of free jets at some $M_j$. The $k_{s3}$ value is more noticeable in figure 6(b). For the shock wavenumber of impinging jets, $k_{s3}$ corresponds to the change of shock cell spacings caused by the appearance of the impinging plate. The values of $k_{s3}$ for impinging jets are also extracted from figure 6(b) and displayed in figure 6(c) for further research.

Figure 6. Normalized wavenumber spectra of averaged schlieren images as a function of  $M_j$ for (a) underexpanded free jets and (b) impinging jets. The red, magenta and cyan dashed lines respectively display the trends of $k_{s1}$, $k_{s2}$ and $k_{s3}$. The $k_{s1}$, $k_{s2}$ and $k_{s3}$ values of underexpanded free and impinging jets are extracted from (a,b) and plotted in (c). The shock wavenumbers of free and impinging jets are respectively indicated by the crosses and squares in (c). The red, magenta and cyan symbols in (c) are respectively corresponded to $k_{s1}$, $k_{s2}$ and $k_{s3}$.
3.3. Eigenvalues and modes of SPOD
SPOD is applied on the schlieren image sequences in order to obtain the coherent flow structures that are associated with the generation of screech tones. In the present analyses,  $M=2560$ snapshots are used in each case. For the current $M_j$ range, with the increase of $M_j$, the non-dimensional time step between consecutive snapshots $\Delta t\,U_j/ D_j$ ranges from 0.42 to 0.50. The range of the corresponding maximum resolvable non-dimensional frequency is from 1.19 to 1.00. Here, $N_f$ (size of each block) and $N_o$ (overlap between two consecutive blocks) are respectively set as 256 and 128 ( $0.5N_f$), resulting in a total of $N_b = 19$ SPOD modes at each frequency. The non-dimensional frequencies $St_j$ of the acoustic resonances that are investigated in the following subsections are in the range 0.40 to 0.70. The non-dimensional time span of one block is more than 100, which corresponds to tens of periods of acoustic resonance.
As shown in figure 7, for the impinging jets at  $M_j =1.12$, 1.28 and 1.40, the tonal frequencies of the noise spectra agree well with the peak frequencies in the distributions of the eigenvalues of the first SPOD modes; and at tonal frequencies, the first SPOD modes are obviously more energetic than the second and third SPOD modes. These results indicate that the flow structures at tonal frequencies possess more energy and show a low-rank dynamic feature. Therefore, in the following subsections, the structures of screech feedback loops are investigated based mainly on the first SPOD modes at tonal frequencies. As shown in figure 2(b), the impinging jets at $M_j=1.12$, 1.28 and 1.40 generate the screech tones of the A1, A2 and A3 modes, respectively. The frequencies of the chosen SPOD modes are indicated by blue circles in figure 7, and summarized in table 1.

Figure 7. SPOD energy spectra and acoustic spectra for the impinging jets at (a)  $M_j=1.12$, (b) $M_j=1.28$, and (c) $M_j=1.40$. The black solid, dashed and dotted lines respectively indicate the SPOD eigenvalues of the first three SPOD modes. The red lines indicate the noise spectra. The blue circles indicate the chosen SPOD modes.
Table 1. Frequencies of screech tones and chosen SPOD modes for different jets.

As presented in figure 8, upstream of the impingement location, the real parts of the chosen SPOD modes are symmetric with respect to the jet axis, which agrees with the azimuthal feature of the A1 and A2 modes, and indicates that the A3 mode is another kind of axisymmetric screech mode. In figure 8, the normalized amplitude fields of the chosen SPOD modes exhibit standing wave patterns (Panda Reference Panda1999; Edgington-Mitchell Reference Edgington-Mitchell2019) along the jet shear layer. The presence of this standing wave pattern is due to the partial interference between the upstream- and downstream-propagating waves that constitute the screech feedback loop (Panda Reference Panda1999). Moreover, as presented in figures 8(c, f), the amplitudes on the lower side of the jet are slightly weaker than those on the jet's upper side. This phenomenon will be discussed further in the following subsections.

Figure 8. The first SPOD modes for jets with (a,d)  $M_j = 1.12$ at $St_j=0.60$, (b,e) $M_j = 1.28$ at $St_j=0.49$, and (c, f) $M_j = 1.40$ at $St_j=0.47$. (a–c) Real part of the mode. The blue contours indicate negative values, and yellow contours indicate positive values. (d–f) Normalized amplitude field of the mode. The colour scales range from 0 (blue) to 1 (yellow).
3.4. Wavenumber spectra of SPOD modes
In a chosen SPOD mode, the flow structures oscillate at a specific screech frequency. However, the different components of the screech feedback loop are associated with a broad range of wavenumbers. Thus spatial Fourier transforms are conducted on the chosen SPOD modes using (2.5). The axial range for the spatial Fourier transform is from  $X/D=0$ to $X/D=8$. The normalized wavenumber spectra of the current three SPOD modes are presented in figure 9. In the positive wavenumber domain, the majority of energy is associated with the downstream-propagating K–H wavepacket. The wavenumber of the K–H wavepacket ( $k_h$), which is estimated as the wavenumber corresponding to the maximum amplitude in the positive wavenumber domain, is indicated by the yellow dashed lines in figure 9 and listed in table 2. Then the convective velocity of the K–H wavepacket is calculated as $U_c=\omega _s/ k_h$, where $\omega _s$ is the angle frequency of screech. As shown in table 2, the $U_c$ value for the chosen cases ranges from $0.60 U_j$ to $0.65 U_j$, which agrees with the results in Mercier, Castelain & Bailly (Reference Mercier, Castelain and Bailly2017) and Powell et al. (Reference Powell, Umeda and Ishii1992).

Figure 9. Normalized wavenumber spectra of the chosen SPOD modes for the jets at (a)  $M_j=1.12$, (b) $M_j=1.28$, and (c) $M_j=1.40$. The dashed vertical yellow lines indicate the wavenumber of $k_h$. The dashed vertical red, magenta and cyan lines respectively indicate the wavenumbers of $k_h\pm k_{s1}$, $k_h\pm k_{s2}$ and $k_h\pm k_{s3}$. The dashed vertical green lines indicate the wavenumber of the upstream-propagating acoustic wave $k_a=-\omega _s/a_\infty$. The $k_h\pm$ spectrum of the averaged schlieren image is also shown in the bottom of each panel as a reference.
Table 2. Characteristic wavenumbers in the wavenumber spectra of SPOD modes.

At screech frequencies, the upstream-propagating guided jet mode can be stimulated by the interaction between the K–H wavepacket and shock cell structures (Edgington-Mitchell et al. Reference Edgington-Mitchell, Wang, Nogueira, Schmidt, Jaunet, Duke, Jordan and Towne2021a); Nogueira et al. (Reference Nogueira, Jaunet, Mancinelli, Jordan and Edgington-Mitchell2022a) suggested that the A1 and A2 screech modes are respectively closed by the guided jet modes that are energized by the interaction between the  $k_h$ and different shock wavenumbers. Thus, for the present three cases, $k_h\pm$, the spectrum of the averaged schlieren image, is also plotted in figure 9. It should be noted that there are some high-amplitude regions that are located mainly in the lower wavenumber domains in the wavenumber spectra of averaged schlieren images. The wavenumbers of these high-amplitude regions are obviously less than $k_{s1}$ and may correspond to the nozzle-to-plate distance. The low-wavenumber domains of the wavenumber spectra of averaged schlieren images are omitted in figure 9, which leads to the white gaps in figure 9. The wavenumbers of high-amplitude regions in the wavenumber spectra of SPOD modes have good agreement with $k_h\pm k_{s1}$, $k_h\pm k_{s2}$ and $k_h\pm k_{s3}$. These results suggest that the interactions between the K–H wavepacket and the shock cells distribute energy to all of these wavenumbers. However, the radial features of the jet modes corresponding to these energetic wavenumbers are different. In the positive wavenumber domain, the stimulated waves at $k_h + k_{s}$ are trapped mainly in the jet core. These are the duct-like modes that are identified by Edgington-Mitchell et al. (Reference Edgington-Mitchell, Wang, Nogueira, Schmidt, Jaunet, Duke, Jordan and Towne2021a) via local stability analyses, and are similar to that identified in high-subsonic jets (Towne et al. Reference Towne, Cavalieri, Jordan, Colonius, Schmidt, Jaunet and Brès2017). For the case $M_j=1.12$, there is more energy at $k_h-k_{s1}$, $k_h-k_{s2}$ and $k_h-k_{s3}$ in the negative wavenumber domain. At the first interaction wavenumber, there are significant supports outside the shear layer, which agrees with the radial feature of the upstream-propagating guided jet mode (Tam & Ahuja Reference Tam and Ahuja1990), while at the latter two wavenumbers, the energy decays rapidly in the radial direction. This implies that the stimulated wave at $k_h-k_{s1}$ is the upstream-propagating guided jet mode, and the waves at $k_h-k_{s2}$ and $k_h-k_{s3}$ would be duct-like. At $M_j=1.28$ and 1.40, the energies associated with $k_h-k_{s2}$ and $k_h-k_{s3}$ are respectively no longer trapped within the jet core and have supports outside the jet shear layer. This indicates that at the screech frequencies of the A2 and A3 modes, the upstream-propagating guided jet modes are respectively energized by the interactions between the K–H wavepacket and the first and second suboptimal shock wavenumber peaks. Thus the present results support the conclusion of Nogueira et al. (Reference Nogueira, Jaunet, Mancinelli, Jordan and Edgington-Mitchell2022a) and indicate that the A3 screech mode of impinging jets is related to the interaction between $k_h$ and the $k_{s3}$. As discussed in previous subsections, $k_{s3}$ is associated with the change of shock cell spacings that is caused by the impinging plate. The external boundaries, such as the impinging plate, can affect the screech mode of jets by changing the axial sizes of shock cells.
In order to generalize the conclusions of figure 9, SPOD is conducted on the schlieren image sequences of the cases in the  $M_j$ range from 1.09 to 1.43. Spatial Fourier transforms are conducted on the first SPOD modes at tonal frequencies of different axisymmetric screech modes. The wavenumber spectrum $Y/D \subseteq [0, 1]$ for each case is shown in figure 10. Overall, the results of figure 9 are further confirmed by the wavenumber spectra that are displayed in figure 10. The acoustic resonances of the A1, A2 and A3 screech modes are respectively attributed to the interactions between the K–H wavepacket and the shock wavenumbers $k_{s1}$, $k_{s2}$ and $k_{s3}$.

Figure 10. Normalized wavenumber spectra of the first SPOD modes at the screech frequencies of (a) the A1 mode, (b) the A2 mode, and (c) the A3 mode. The yellow symbols indicate the wavenumber of  $k_h$. The red, magenta and cyan symbols respectively indicate the wavenumbers of $k_h\pm k_{s1}$, $k_h\pm k_{s2}$ and $k_h\pm k_{s3}$. The green symbols indicate the wavenumber of the upstream-propagating acoustic wave $k_a=-\omega _s/a_\infty$.
Shock cell spacings (Powell Reference Powell1953) and standing wave wavelengths (Panda Reference Panda1999) are both important length scales for predicting screech frequencies. The relationship between these two length scales was discussed in Mercier et al. (Reference Mercier, Castelain and Bailly2017) and Li et al. (Reference Li, Liu, Hao, Zhang and He2021). Here, the connection between these two length scales is analysed via the wavenumber spectra of the normalized amplitude fields of the chosen SPOD modes. As shown in figures 9 and 10, the upstream-propagating guided jet modes with the wavenumbers of  $k_h-k_{s1}$, $k_h-k_{s2}$ and $k_h-k_{s3}$, respectively, close the screech feedback loops of the A1, A2 and A3 modes. Based on the wavenumber relation of the standing wave, the standing wave patterns with the wavenumbers of $k_{s1}$, $k_{s2}$ and $k_{s3}$ should respectively exist in the flow fields of the jets that produce the screech tones in the A1, A2 and A3 modes. Figure 11 shows that the wavenumbers of high-amplitude regions are around $k_{s1}$, $k_{s2}$ and $k_{s3}$ in the radial range $0 \leqslant Y/D \leqslant 0.5$. In the study of Panda (Reference Panda1999), the wavenumber of standing wave $k_{sw}$ is considered as $k_h-k_a$. For the A1, A2 and A3 modes, during the process of getting away from the jet axis, the high-amplitude regions corresponding to $k_{s1}$, $k_{s2}$ and $k_{s3}$ approach $k_h-k_a$, respectively. In different screech modes, the axial wavenumber of the standing wave pattern corresponds to the different wavenumber peaks of averaged shock structures. As shown in figure 8, the corresponding relationships between the shock cell spacings and standing wave wavelengths are different in the A1, A2 and A3 modes. In the axial range of the first three shock cells, there are nearly three anti-nodes of the standing wave pattern for the A1 mode, four anti-nodes for the A2 mode, and five anti-nodes for the A3 mode. The above results will be used to predict the screech frequencies in the following subsections.

Figure 11. Normalized wavenumber spectra for the amplitude fields of the chosen SPOD modes for the jets at (a)  $M_j=1.12$, (b) $M_j=1.28$, and (c) $M_j=1.40$. The spectrum of the averaged schlieren image is also shown at the bottom of each panel as a reference. The dashed vertical green lines indicate the wavenumber of $k_h-k_a$.
3.5. Mode staging process of axisymmetric screech modes
The weakest link theory (Tam & Tanna Reference Tam and Tanna1982; Tam, Seiner & Yu Reference Tam, Seiner and Yu1986) suggested that the interaction between the K–H wavepacket and shock cells leads to a redistribution of energy. The waves with the wavenumbers of the sum and difference of  $k_h$ and $k_s$ will be energized. At screech frequencies, the wavenumbers of upstream-propagating guided jet modes coincide with these interaction wavenumbers, i.e. $k_h-k_{s}$ (Edgington-Mitchell et al. Reference Edgington-Mitchell, Wang, Nogueira, Schmidt, Jaunet, Duke, Jordan and Towne2021a). The weakest link theory can be viewed as a first approximation of the condition for the occurrence of the absolute instability (Nogueira et al. Reference Nogueira, Jaunet, Mancinelli, Jordan and Edgington-Mitchell2022a,Reference Nogueira, Jordan, Jaunet, Cavalieri, Towne and Edgington-Mitchellb). Here, the mode staging process of the axisymmetric screech modes for the impinging jets is analysed by combining the weakest link theory and the dispersion relations of upstream-propagating guided jet modes.
The dispersion relation of the vortex sheet model (Lessen, Fox & Zien Reference Lessen, Fox and Zien1965; Tam & Hu Reference Tam and Hu1989) can be written as
 \begin{equation}
\frac{1}{\left(1-\dfrac{k M_a}{\omega } \right)^2} +
\frac{1}{T}\,
\frac{I_m\left(\dfrac{\gamma_i}{2}\right)\left[\dfrac{\gamma_o}{2}\,K_{m-1}\left(\dfrac{\gamma_o}{2}\right)
+mK_m\left(\dfrac{\gamma_o}{2}\right)\right]}{K_m\left(\dfrac{\gamma_o}{2}\right)
\left[\dfrac{\gamma_i}{2}\,I_{m-1}\left(\dfrac{\gamma_i}{2}\right)
+mI_m\left(\dfrac{\gamma_i}{2}\right)\right]} =
0\end{equation}
\begin{equation}
\frac{1}{\left(1-\dfrac{k M_a}{\omega } \right)^2} +
\frac{1}{T}\,
\frac{I_m\left(\dfrac{\gamma_i}{2}\right)\left[\dfrac{\gamma_o}{2}\,K_{m-1}\left(\dfrac{\gamma_o}{2}\right)
+mK_m\left(\dfrac{\gamma_o}{2}\right)\right]}{K_m\left(\dfrac{\gamma_o}{2}\right)
\left[\dfrac{\gamma_i}{2}\,I_{m-1}\left(\dfrac{\gamma_i}{2}\right)
+mI_m\left(\dfrac{\gamma_i}{2}\right)\right]} =
0\end{equation}
and
 $$\begin{gather} \gamma_i = \sqrt{k^2 - \frac{1}{T} (\omega - M_a k)^2}, \end{gather}$$
 $$\begin{gather}\gamma_o = \sqrt{k^2 - \omega^2}. \end{gather}$$
Here,  $I_m$ and $K_m$ are modified Bessel functions of the first and second kinds, respectively. All quantities have been normalized by the ideally expanded jet diameter $D_j$ and the ambient sound velocity $a_ \infty$. Also, $M_a = U_j / a_\infty$ is the acoustic Mach number, and ${T = T_j /T_\infty}$ is the temperature ratio. The relation between the ideally expanded jet Mach number $M_j$ and the acoustic Mach number $M_a$ is $M_j = M_a /\sqrt {T}$. For given values of wavenumber $k$ and azimuthal wavenumber $m$, the dispersion relation (3.1) has many real roots or eigenvalues. The entire set of eigenvalues can be characterized by $m$ and a radial wavenumber $n$ (Tam & Ahuja Reference Tam and Ahuja1990). For convenience, the jet mode that corresponds to the $m$th azimuthal mode and the $n$th radial mode will be designated by $(m,n)$, where $m = 0, 1, 2, \ldots$ and $n = 1, 2, 3, \ldots$. The pressure eigenfunctions of guided jet modes are given by
 \begin{equation} p_i = I_0(\gamma_i r) (0\leqslant r/D_j \leqslant 0.5) , \quad p_o = A\,K_0(\gamma_o r) (0\leqslant r/D_j \leqslant 0.5). \end{equation}
These two functions are matched at  $r/D_j=0.5$ by the coefficient $A$.
$A$.
The dispersion relations of the guided jet modes  $(0,2)$ for the cases associated with the staging process from the A1 mode to the A2 mode are shown in figure 12. The wavenumbers energized by the interaction between the K–H wavepacket and shock cells, i.e. $k_h-k_{s1}$ (red dashed lines) and $k_h-k_{s2}$ (magenta dashed lines), are also displayed. Here, the K–H waves are assumed to be non-dispersive waves with the phase velocities that are listed in table 2 for different screech modes. As shown in figure 12(a), the red dashed line intersects the dispersion relation of the $(0,2)$ mode, and the frequency of this intersection ( $St_j=0.73$) is just above the screech frequency of the $M_j=1.09$ jet ( $St_j=0.69$). The guided jet mode that is energized by the interaction between the K–H wavepacket and the dominant shock wavenumber of $k_{s1}$ closes the screech feedback loop of the A1 mode (Nogueira et al. Reference Nogueira, Jaunet, Mancinelli, Jordan and Edgington-Mitchell2022a). For this $M_j$, no intersection is found for the magenta dashed line with the upstream-propagating part of the dispersion relation. This implies that at this condition, $k_h-k_{s2}$ does not correspond to an upstream-propagating mode that is supported by the jet. The values of $k_{s1}$ and $k_{s2}$ decrease with the increase of $M_j$. As shown in figure 12(b), the red dashed line intersects the upstream branch of the dispersion relation near the cut-on frequency of the guided jet mode, and the intersection point of the magenta dashed line and the dispersion relation gradually moves to the upstream branch. When $M_j=1.16$, as shown in figure 12(c), there is no intersection between the red dashed line and the dispersion relation of the $(0,2)$ mode, which means that $k_h-k_{s1}$ does not correspond to an upstream-propagating guided jet mode. The dominant screech frequency of the $M_j=1.16$ jet is in the A2 mode and below the frequency of the intersection of the magenta dashed line and the dispersion relation. This result agrees with that of Nogueira et al. (Reference Nogueira, Jaunet, Mancinelli, Jordan and Edgington-Mitchell2022a) and indicates that the A2 mode is closed by the guided jet mode that is stimulated by the interaction between the K–H wavepacket and $k_{s2}$ (Nogueira et al. Reference Nogueira, Jaunet, Mancinelli, Jordan and Edgington-Mitchell2022a).

Figure 12. Dispersion relations of the upstream-propagating guided jet modes  $(0,2)$ (green lines) for the jets at (a) $M_j=1.09$, (b) $M_j=1.12$, and (c) $M_j=1.16$. The red and magenta dashed lines respectively indicate the wavenumbers of $k_h-k_{s1}$ and $k_h-k_{s2}$. The wavenumber of acoustic waves is represented by the grey dashed line. The yellow and orange squares respectively indicate the screech frequencies of the A1 and A2 modes.
We examine the characteristics of the guided jet modes that are energized by the interactions between the K–H wavepacket and  $k_{s2}$ during the mode staging process from the A1 mode to the A2 mode. Here, $k_h-k_{s2}$ intersects the dispersion relation of the $(0,2)$ mode at $(St_j, kD_j)=(0.59, -9.77)$ in figure 12(a). As shown in figure 13(a), the pressure eigenfunction of this guided jet mode is mainly trapped in the jet core. Therefore, for the $M_j=1.09$ jet, a duct-like mode with a positive group velocity but negative phase velocity is energized by the interaction between the K–H wavepacket and $k_{s2}$, and because of the positive group velocity, this jet mode is unable to close the resonance. As shown in figure 12(b), $k_h-k_{s2}$ intersects the dispersion relation near the saddle point of the guided jet mode at $M_j=1.12$, and the eigenfunction shows some amplitudes outside the shear layer in figure 13(b). In figure 12(c), $k_h-k_{s2}$ intersects the upstream branch of the dispersion relation at $M_j=1.16$. Furthermore, as shown in figure 13(c), the eigenfunction of this jet mode has significant support outside the shear layer. With the increase of $M_j$, the jet mode energized by the interaction between the K–H wavepacket and $k_{s2}$ gradually changes from a downstream-propagating duct-like mode to an upstream-propagating mode that has support outside the shear layer, which agrees with the results of the wavenumber spectra shown in figures 9 and 10.

Figure 13. Pressure eigenfunction distributions of guided jet modes at the intersections of the dispersion relations of the  $(0,2)$ mode and $k_h-k_{s2}$: (a) $St_j=0.59$, $kD_j=-9.77$ for the $M_j=1.09$ jet; (b) $St_j=0.75$, $kD_j=-5.02$ for the $M_j=1.12$ jet; and (c) $St_j=0.69$, $kD_j=-4.53$ for the $M_j=1.16$ jet.
The mode staging process between the A2 and A3 modes is shown in figure 14 in a similar manner to figure 12. With the increase of  $M_j$, the line of $k_h-k_{s2}$ gradually has no intersection with the dispersion relation of the upstream-propagating guided jet mode. The screech frequency of the A3 mode is just below the frequency of the intersection of ${k_h-k_{s3}}$ and the upstream branch of the dispersion relation. Meanwhile, as shown in figure 15, the eigenfunctions of the jet modes energized by the interactions of the K–H wavepacket and $k_{s3}$ gradually have more amplitudes outside the jet shear layer. These results imply further that the screech feedback loop of the A3 mode is closed by the guided jet mode that is energized by the interaction between the K–H wavepacket and $k_{s3}$.

Figure 14. Wavenumbers of the upstream-propagating guided modes of the second radial order (green lines) for the jets at (a)  $M_j=1.22$, (b) $M_j=1.28$, and (c) $M_j=1.33$. The red, magenta and cyan dashed lines respectively indicate the wavenumbers of $k_h-k_{s1}$, $k_h-k_{s2}$ and $k_h-k_{s3}$. The wavenumber of acoustic waves is represented by the grey dashed line. The orange and red squares respectively indicate the screech frequencies of the A2 and A3 modes.

Figure 15. Pressure eigenfunction distributions of guided jet modes at the intersections of the dispersion relations of the  $(0,2)$ mode and $k_h-k_{s3}$: (a) $St_j=0.66$, $kD_j=-4.70$ for the $M_j=1.22$ jet; (b) $St_j=0.59$, $kD_j=-4.16$ for the $M_j=1.28$ jet; and (c) $St_j=0.53$, $kD_j=-3.82$ for the $M_j=1.33$ jet.
As shown in figure 2, the screech frequencies of the A1 and A2 modes terminate near the cut-on frequency of the upstream-propagating guided jet mode  $(0,2)$. However, this is not the case for the A3 mode. The acoustic results in figure 2(b) show that the impinging jet at $M_j=1.47$ does not generate a strong tone of the A3 screech mode. As shown in figure 16, the line of $k_h-k_{s3}$ still intersects the upstream branch of the dispersion relation at $M_j=1.47$. This result cannot be explained by the theory of Nogueira et al. (Reference Nogueira, Jaunet, Mancinelli, Jordan and Edgington-Mitchell2022a). The termination of the A3 mode will be discussed in the following subsections.

Figure 16. Wavenumbers of the upstream-propagating guided modes of the second radial order (green lines) for the  $M_j=1.47$ jet. The red, magenta and cyan dashed lines respectively indicate the wavenumbers of ${k_h-k_{s1}}$, $k_h-k_{s2}$ and $k_h-k_{s3}$. The wavenumber of acoustic waves is represented by the grey dashed line.
3.6. Characteristics of upstream- and downstream-propagating waves
The wavenumber spectra of the chosen SPOD modes are shown in figure 9. The sign of the phase velocity ( $\omega _s/k$) is determined by the sign of the axial wavenumber $k$. In the current analyses, in order to reconstruct the upstream- and downstream-propagating waves approximately, bandpass filters in the wavenumber domain are applied to isolate the upstream- and downstream-propagating waves in the screech feedback loop. The negative and positive wavenumber domains are used respectively to reconstruct the upstream-propagating waves and the downstream-propagating waves. The approximatively reconstructed upstream- and downstream-propagating waves at screech frequencies are presented in figure 17. Amplitude fields have been normalized by the maximum amplitude in each case for clarity. The axial locations of the rear edges of shock cells are extracted from averaged schlieren images and shown by the red arrows in figure 17.

Figure 17. Approximately reconstructed upstream (a–c) and downstream (d–f) propagating waves at the screech frequencies for (a,d) the  $M_j=1.12$ jet (A1 mode), (b,e) the $M_j=1.28$ jet (A2 mode), and (c, f) the $M_j=1.40$ jet (A3 mode). The top image of each panel is the normalized amplitude field of waves. The colour scales range from 0 (blue) to 1 (yellow). The bottom image of each panel is the real part of the waves. Blue contours indicate negative values, and yellow contours indicate positive values. Red arrows indicate the axial positions of the shock reflection points at the jet shear layer.
As shown in figure 17, there are high-amplitude regions of the upstream-propagating waves at multiple shock tips for all these three screech modes. These high-amplitude regions should be related to the upstream motions of shock tips that lead to the generation of upstream-propagating acoustic waves (Edgington-Mitchell et al. Reference Edgington-Mitchell, Weightman, Lock, Kirby, Nair, Soria and Honnery2021b). As discussed in the previous subsections, the upstream-propagating guided jet mode that is energized by the interaction of the K–H wavepacket and  $k_{s1}$ closes the screech feedback loop of the A1 mode. As shown in figure 17(a), some high-amplitude regions are near the impinging plate, where the shock cells are with shorter spacings. These are the energy associated mainly with the $k_h - k_{s2}$ interaction, which is also shown in the wavenumber spectrum of figure 9(a). In the $M_j$ range 1.12–1.16, the screech mode transforms from the A1 mode to the A2 mode. Before the mode switch occurs, the energy associated with the interaction of the K–H wavepacket and $k_{s2}$ becomes significant (Edgington-Mitchell et al. Reference Edgington-Mitchell, Li, Liu, He, Wong, Mackenzie and Nogueira2022). As shown in figures 17(b) and 17(c), the higher amplitudes of upstream-propagating waves in the A2 and A3 modes are concentrated mainly at the axial regions downstream of the third shock cell, where the spacings of shock cells exhibit obvious changes in the axial direction. The upstream-propagating guided jet modes that are energized by the interactions of the K–H wavepacket with $k_{s2}$ and $k_{s3}$ close the screech feedback loops of the A2 and A3 modes, respectively. These two shock wavenumber peaks represent the axial variations of shock spacings that occur further downstream. Thus the approximate reconstructions of upstream-propagating waves can be viewed as the spatial representations of the corresponding wavenumber spectra. The screech tones of different modes might be associated with the shock cells at different distances downstream of the jets (Edgington-Mitchell et al. Reference Edgington-Mitchell, Li, Liu, He, Wong, Mackenzie and Nogueira2022). For the A1 mode, the K–H wavepacket interacts with the first several shock cells to energize the upstream-propagating guided jet modes that close the screech feedback loop, and the acoustic resonances of the A2 and A3 modes are associated mainly with the axial regions in which the spacings of shock cells exhibit obvious axial variations. As shown in the amplitude fields of downstream-propagating waves in figure 17, the standing wave patterns along the jet shear layer are removed. However, periodic modulations within the jet core are exhibited for all these jets. The spatial scales of these modulations match the shock cell spacings closely. These spatial modulations may be attributed to the interference between the K–H wavepacket ( $k_h$) and the duct-like mode with the wavenumber of $k_h+k_s$ (Edgington-Mitchell et al. Reference Edgington-Mitchell, Wang, Nogueira, Schmidt, Jaunet, Duke, Jordan and Towne2021a), or the direct modulations of shock cells on the K–H wavepacket (Nogueira et al. Reference Nogueira, Self, Towne and Edgington-Mitchell2022c).
3.7. Phase criteria
In this subsection, the frequencies of acoustic resonances are predicted by combining the phase criterion of an acoustic feedback loop with the results of current experiments. The phase criterion can be written as (Edgington-Mitchell Reference Edgington-Mitchell2019)
 \begin{equation} \frac{N}{f_s} = \frac{h}{U_c} + \frac{h}{U_{-}} + \psi,\end{equation}
where  $U_c$ and $U_{-}$ are respectively the convection velocities of the downstream- and upstream-propagating waves that constitute the feedback loop, $f_s$ is the screech frequency, $h$ is the distance between the nozzle exit plane and the downstream reflection point, $\psi$ accounts for any additional delay associated with different components of the feedback loop, and $N$ is an integer value that can be considered as the number of concurrent disturbances in the acoustic feedback loop at any moment (Edgington-Mitchell Reference Edgington-Mitchell2019). By combining the relation between the wavenumber and the phase velocity of a wave, (3.5) can be written further as
 \begin{equation} (k_h-k_{-})\times h + 2 {\rm \pi}f_s \psi = \Delta k \times h + 2 {\rm \pi}f_s \psi = 2 {\rm \pi}N, \end{equation}
where  $\Delta k$ is the wavenumber difference between the downstream-propagating K–H wavepacket and the upstream-propagating guided jet mode. Here, the downstream-propagating K–H wavepacket is considered to be neutrally stable and $k_h$ is calculated by using $U_c$ listed in table 2 for different screech modes. The wavenumber of the upstream-propagating guided jet mode $k_{-}$ is obtained from the vortex-sheet model (3.1), and $\psi$ is assumed to be $0$, i.e. the in-phase resonance criterion is considered. Using the dispersion relations of the downstream- and upstream-propagating waves, the frequencies at which (3.6) is satisfied are selected as the predicted frequencies.
For impinging jets, the impinging plate is usually viewed as the downstream reflection point, and  $h$ in (3.6) is equal to the impinging distance (Ho & Nosseir Reference Ho and Nosseir1981; Bogey & Gojon Reference Bogey and Gojon2017; Gojon & Bogey Reference Gojon and Bogey2017). In the present study, not only the impinging distance at the jet axis ( $5D$) but also the impinging distances along the upper and lower lip lines ( $5.9D$ and $4.1D$) are used to predict tonal frequencies. As shown in figure 18, based on these three impinging distances, the frequencies and mode staging behaviours of acoustic resonances cannot be predicted. These results imply that the current acoustic resonances of underexpanded jets that impinge on an inclined plate are not due to the feedback loop between the nozzle exit and the plate.

Figure 18. Comparison of acoustic resonance frequencies obtained from the acoustic measurements and the phase criterion (3.6) between the nozzle exit and the impinging plate: (a)  $h=5.9D$, the impinging distance at the upper lip line; (b) $h=5.0D$, the impinging distance at the jet axis; and (c) $h=4.1D$, the impinging distance at the lower lip line. The blue crosses indicate the results of acoustic measurements. The dashed grey lines indicate the frequency ranges in which the upstream-propagating guided jet mode $(0,2)$ is propagable.
The upstream- and downstream-propagating waves in the screech feedback loop are assumed to exchange energy at the nozzle exit and at a shock cell location, and the location of the fourth shock cell is used to predict screech frequencies in axisymmetric A1 and A2 modes (Mancinelli et al. Reference Mancinelli, Jaunet, Jordan and Towne2019, Reference Mancinelli, Jaunet, Jordan and Towne2021). In this subsection, in order to predict tonal frequencies, the location of the downstream reflection point is determined by analysing the movements of upstream- and downstream-propagating waves relative to the averaged shock structures. The upstream- and downstream-propagating waves of the screech feedback loop are reconstructed approximately in § 3.6, and the movements of waves during half of the screech period are displayed in figure 19. In different screech modes, the parts with the same phases of the upstream- and downstream-propagating waves are encountered at the rear edge of the third shock cell. Therefore, the location of the third shock cell is considered as the downstream reflection point for different screech modes. It should be noted that as discussed in previous subsections, the acoustic resonance in different screech modes is associated with the interaction of the K–H wavepacket and shock cells in various axial regions. Thus identifying a specific location of interaction is inconstant and case-related. The location of this downstream reflection point is just used to predict resonance frequencies.

Figure 19. Movements of approximately reconstructed upstream- and downstream-propagating waves at the jet shear layer ( $Y/D=0.5$): (a) $M_j=1.12$ jet ( ${\rm NPR}=2.20$, A1 mode); (b) $M_j=1.28$ jet ( ${\rm NPR}=2.70$, A2 mode); and (c) $M_j=1.40$ jet ( ${\rm NPR}=2.70$, A2 mode). The approximately reconstructed upstream-propagating waves are indicated by the dashed black lines. The approximately reconstructed downstream-propagating waves are indicated by the solid blue lines. The red arrows indicate the axial positions of the shock reflection points at the jet shear layer.
As shown in figure 4, the impinging plate has only slight effects on the first three shock cells. Thus  $h$ in (3.6) is calculated as $3 \times \lambda _s$, and the axial spacing of a shock cell $\lambda _s$ is obtained by the formula of Pack (Reference Pack1950):
 \begin{equation} \frac{\lambda_s}{D} = \frac{{\rm \pi} }{2.4048} \sqrt{M_j^2-1}. \end{equation}
Gojon et al. (Reference Gojon, Bogey and Marsden2016) demonstrated that the number of cells in the standing wave pattern between the nozzle exit plane and the downstream reflection point is the  $N$ of (3.6). As shown in the normalized amplitude fields of figure 8, $N$ is equal to 3, 4 and 5 for the A1, A2 and A3 modes, respectively. The reflection coefficients at the nozzle exit and the downstream reflection point are not accounted for in the present model. Thus this is a simplified version of the model in Mancinelli et al. (Reference Mancinelli, Jaunet, Jordan and Towne2021).
As shown in figure 20, based on the current experimental results, the screech frequencies calculated by (3.6) have good agreement with the results of acoustic measurements. By combining the phase criterion and the right parameters, screech frequencies of different screech modes can be predicted precisely (Nogueira et al. Reference Nogueira, Jaunet, Mancinelli, Jordan and Edgington-Mitchell2022a). As shown in figure 16, the vanishing of the A3 mode cannot be explained by combining the weakest link theory and the dispersion relation of the upstream-propagating guided jet mode. Thus the phase criterion for the A3 screech mode is examined further. At several  $M_j$, the averaged schlieren images and the first SPOD modes at the screech frequencies of the A3 mode are shown in figure 21. There are always five cells in the standing wave pattern between the nozzle exit and the third shock reflection point along the upper lip line of jets. For the axisymmetric mode A3, the same phase criterion needs to be met at all the azimuthal positions. With the increase of $M_j$, the inclined plate gradually invades the third shock cell. In figures 21(a–c), the rear edge of the third shock cell is nearly vertical to the jet axis. The amplitudes of the standing wave patterns along the upper and lower lip lines are similar. As shown in figures 21(d–f), when $M_j$ is larger than 1.40, the rear edge of the third shock cell is obviously inclined. The asymmetry of averaged shock structures and the differences between the $h$ values along the upper and lower lip lines become distinct with the increase of $M_j$. The phase criterion is not satisfied at the lower side of the jet gradually. Thus the intensity of the standing wave pattern at the lower side becomes weaker relative to the upper side of the jets. When $M_j$ is larger than 1.45, the jets would not generate the screech tone of the A3 mode.

Figure 20. Comparison of acoustic resonance frequencies obtained from the acoustic measurements and the phase criterion (3.6) between the nozzle exit and the rear edge of the third shock cell. The blue crosses indicate the results of acoustic measurements. The dashed grey lines indicate the frequency ranges in which the upstream-propagating guided jet mode  $(0,2)$ is propagable. The black solid, dashed and dotted lines indicate the results of the phase criteria of $N=3$, 4 and 5, respectively.

Figure 21. The first SPOD modes at the screech frequencies in A3 mode for the jets at (a)  $M_j=1.33$ ( $St_j=0.51$), (b) $M_j=1.35$ ( $St_j=0.50$), (c) $M_j=1.38$ ( $St_j=0.48$), (d) $M_j=1.40$ ( $St_j=0.47$), (e) $M_j=1.42$ ( $St_j=0.46$), and ( f) $M_j=1.44$ ( $St_j=0.45$). The top image of each panel is the averaged schlieren image. The bottom image of each panel is the normalized amplitude field of the SPOD mode. The colour scales range from 0 (blue) to 1 (yellow). The red arrows indicate the axial positions of the shock reflection points at the jet shear layer.
4. Conclusions
In the present study, acoustic measurements and high-speed schlieren visualizations are conducted to study the acoustic resonance mechanism for different axisymmetric screech modes of the underexpanded jets that impinge on an inclined plate. The nozzle-to-plate distance at the jet axis is set as 5.0 $D$, and the inclined angle of the plate is $30^{\circ }$. The ideally expanded jet Mach number ranges from 1.05 to 1.56. By comparing with the acoustic results of underexpanded free jets, the $M_j$ range for the A2 screech mode of impinging jets is wider, and a new axisymmetric screech mode A3 appears in the acoustic spectra of impinging jets. The effect of the impinging plate on the shock cell structures of jets becomes obvious with the increase of $M_j$. The axial variations of shock cell spacings are more obvious near the impingement location. And the first and second suboptimal peaks are more distinct in the axial wavenumber spectra of averaged schlieren images.
The coherent flow structures that are associated with the acoustic resonances of different screech modes are extracted by SPOD, and the first SPOD modes at tonal frequencies are selected to be analysed. The chosen SPOD modes are further decomposed in the streamwise direction, and the axial wavenumber spectra suggest that the A1, A2 and A3 screech modes are respectively closed by the guided jet modes that are energized by the interactions between the Kelvin–Helmholtz wavepacket and the first three shock wavenumber peaks. The mode staging process for axisymmetric screech modes of impinging jets is analysed by combining the weakest link theory and the dispersion relations of upstream-propagating guided jet modes. The interaction between the K–H wavepacket and the first three peak wavenumbers of averaged shock structures leads to a redistribution of energy. At screech frequencies of the A1, A2 and A3 modes, the interaction wavenumbers of the first three shock wavenumber peaks are respectively located in the frequency ranges where the upstream-propagating guided jet modes are propagable. However, this methodology cannot explain the vanishing of the A3 screech mode.
The upstream- and downstream-propagating waves that constitute the screech feedback loop are reconstructed approximately based on the wavenumber spectra of the chosen SPOD modes. Taking the rear edge of the third shock cell as the downstream reflection point of the screech feedback loop, screech frequencies of different screech modes can be predicted by combining the phase criterion and the right parameters. For the A3 mode, with the increase of  $M_j$, the inclined plate gradually invades the third shock cell, and the phase constraint cannot be satisfied at the lower side of jets for higher $M_j$, which leads to the vanishing of the screech tone in the A3 mode. The present results suggest that external boundaries can modulate the frequency and mode of jet screech by changing the axial wavenumbers of shock cells.
Funding
This work was supported by the National Key R&D Programme of China (grant no. 2022YFC2402600), the National Natural Science Foundation of China (grant nos 12202245, 11972215, 12072174), and the National Basic Research Programme of China (the 973 programme) through grant no. 2012CB720100. X.L. acknowledges financial support from the Shuimu Tsinghua Scholar Programme.
Declaration of interests
The authors report no conflict of interest.


