


Just how unequal were the incomes of different classes of Russians on the eve of Revolution? We provide detailed income estimates for economic and social classes in each of the fifty provinces of European Russia. In 1904, on the eve of military defeat and the 1905 Revolution, Russian income inequality was middling by the standards of that era, and no more severe than inequality has become today in such countries as China, the United States, and Russia itself. The interplay of some distinctive fiscal and factor-endowment features of Imperial Russia shaped the now-revealed level of inequality.
ISSUES AND OVERVIEW
After the emancipation of the serfs in 1861, Tsarist Russia's pace of industrial development, urbanization, and economic growth accelerated. Despite these changes, Russian society was riven by formal social, political, and class divisions, which observers have long tied to the revolutionary events of the early twentieth century. However, for all the debate over class differentiation in Russia before the Bolshevik Revolution, scholars have yet to develop a comprehensive measure of the country's level of inequality. This has not been due to a lack of attempts, as a number of writers have endeavored to describe how income and wealth were allocated in Tsarist society.
Russian and Western scholars have long drawn on simple measures of asset ownership to document inequality through the lens of “class differentiation.” However, their indicators, such as the number of horses, the amount of land, or the number of wage earners cover are only a subset of all assets, are only indirect measures of income, and were typically drawn from limited empirical sources for a specific geographic area. Such measures cannot reliably approximate the true distribution of income or wealth in Tsarist Russia. As a result, although Paul Gregory (Reference Gregory1982), Peter Gatrell (Reference Gatrell1986), and others have identified a fairly high rate of economic growth in the last decades of the Tsarist regime, we know very little about how such gains were distributed among the population. The lack of a clear depiction of the level of Russian inequality not only limits our understanding of the roots of the 1905 and 1917 revolutions, but it also impairs our accounting of the evolution of the Russian economy over the period.Footnote 1
This article helps to fill this gap by drawing on newly compiled provincial and social estate-level data on high income earners (those earning more than 1,000 rubles, which was about 1.6 times the income of an average household of 5.8 persons), on wages in a variety of occupations, and on both communal and private land holdings for a small window around the year 1904. We use this information to derive estimates of income inequality in the late Tsarist period at the provincial level and for European Russia as a whole. We provide both Gini coefficients and income shares to document pre-tax income inequality and polarization for this benchmark year, which we then compare to existing estimates for the Soviet Union, post-Soviet Russia, and other historical economies at various points in the development process.
Our findings—which we subject to a variety of robustness exercises—suggest that just prior to the revolutions of the early twentieth century, Russia's income inequality was not exceptional, either in comparison to contemporary societies or when stacked up against estimates for the post-Soviet period. This was despite the extreme suppression of political rights, the inequality of landownership, and the clear regressivity of the imperial fiscal system. We suggest that this “moderate” income inequality was a net result of the tension between Russia's labor scarcity, or land abundance, and its regressive and repressive institutions. At the same time, inequality was higher in the capital city provinces, the Baltics, and the Black Sea region— i.e., some of the more dynamic and urban parts of the empire. As the revolutions of 1905 and 1917 were urban in origin, the geography of Russian inequality would suggest some support for distributional factors as underlying causes. However, our picture is just a snapshot. Additional research on the dynamics of inequality is necessary before more definitive accounts of the role played by economic processes in the two revolutions can be drawn.
PRE-REVOLUTIONARY INEQUALITY: SOURCES AND INTERPRETATIONS
Inequality in Tsarist Russia has received remarkably little quantitative attention.Footnote 2 This has mainly been due to data constraints. No representative income or wealth surveys were undertaken across different sectors at any point in time. As noted, measures of inequality or differentiation frequently took the narrow form of livestock, land, or other asset distributions across exclusively peasant households, often only in small geographic areas.Footnote 3
After 1861 academics and policymakers were increasingly aware of the limits to their knowledge of the countryside, and of economic conditions in the empire more broadly. As a result, the Central Statistical Committee of the Ministry of the Interior and other ministerial bodies sponsored numerous statistical research projects, culminating in the first national census in 1897. The census not only documented the ethnic, religious, and geographic diversity of the empire, but it also collected detailed data on the occupational structure of the population. This census and other similarly impressive efforts after 1900 (such as the 1905 Land Statistics) provide some of the necessary building blocks for estimating the level of inequality in European Russia around the turn of the century.Footnote 4 But few scholars have endeavored to evaluate just how unequal Russia was by 1900, and those that did so have generally relied on approaches that do not compare well to modern estimates.
Two literatures emerging at the end of the nineteenth century indirectly spoke to the nature of inequality in late Tsarist society. The first was the rise of a school of populist peasant studies that built upon and extended zemstvo research by undertaking detailed budget studies of “representative” peasant households.Footnote 5 Emerging first in the province of Voronezh under the leadership of Feodor Scherbina in the 1880s (e.g., Scherbina 1897), this movement later came to be associated with the work of Alexander Chaianov, especially his influential The Theory of the Peasant Economy (1Reference Chaianov, Thorner, Kerblay and Smith986). According to this line of scholarship, inequality of rural households was driven more by life-cycle events such as aging or household divisions than by broader social forces.
Such budget data and zemstvo studies of rural households also played a key part in a second literature: Soviet interpretations of peasant differentiation, or rassloenie (or “polarization”), into rich kulaki and a poor, increasingly landless, rural proletariat (e.g., Anfimov Reference Anfimov1984; Rashin 1950). Field's (Reference Field1989) fascinating analysis of turn-of-the- century wealth polarization among the peasants of agricultural Poltava and other provinces builds on these two literatures by estimating Gini coefficients (and their change over time) for different agricultural assets.Footnote 6 According to this research, agricultural assets were held relatively unequally, even among the supposedly homogenous peasantry. Similarly to contemporary observers who asserted that “differentiation” was growing over time, Field emphasizes the emergence of “rural capitalism” among the peasant population by 1900. However, he also acknowledges that such zemstvo data make it difficult to accurately estimate true income or wealth inequality, because the asset categories, definitions of a household, and types of peasant economic activity changed over time and differed across surveys.Footnote 7
Two other areas of scholarship also relate to our method of calculating income inequality. The first is the literature on living standards in Tsarist Russia. Soviet scholars such as Iu. I. Kir'ianov (Reference Kir'ianov1979) tended to focus on either rural or urban (i.e., “worker”) living standards by considering work conditions, diets, and some very limited information on wages and salaries. These studies were written through a Marxist filter and, therefore, did not pay much attention to the income generated from asset ownership. In his recent impressive work on living standards from Peter the Great to the Revolution, Boris N. Mironov (Reference Mironov2010, 2Reference Mironov012) quickly sets aside direct calculations of incomes (and their distribution) in favor of an anthropometric approach. His reliance on military and factory data on adult heights opens an important area of research into Russian living standards, especially over time, but it does not directly measure economic inequality.
Second, many Soviet and post-Soviet studies of living standards, peasant stratification, the emergence of a working class, and household budgets have tended to be micro in their use of evidence. Indeed, we argue elsewhere that micro studies of living standards are valuable for understanding the nature of heterogeneity in Russian living standards (Dennison and Nafziger Reference Dennison and Nafziger2013). However, evaluating the level of inequality in a particular society requires taking a more aggregate approach. Paul R. Gregory's (Reference Gregory1982) important revision of Russian national income—which documents a relatively high growth rate from the 1880s to 1913—provides a baseline measure of the size of the economic “pie” that was divided among agents in the economy. In the process of compiling these accounts, Gregory makes a rough calculation that the top 1 percent of earners received about 15 percent of national income around 1904 (Table 1).Footnote 8
Our brief summary of the literature on inequality in pre-Soviet Russia points to a simple fact: there has been little comprehensive work. For the Post-Revolutionary era, more extensive data on earnings do enable broader measures of the distribution of incomes, including 90/10 percentile ratios and Gini coefficients for the entire USSR.Footnote 9 Estimates of pre-1917 inequality focused on small parts of total income and did so for small geographic areas (often limited by the scope of individual zemstvo research efforts). Assignment of households to income strata was generally done by asset ownership, although returns from owning these assets rarely entered into early calculations.Footnote 10 In what follows, we rely on a variety of sources and a new methodology that allow us to estimate overall inequality around 1904 in a way that is comparable to methods used for other societies at different points in time.
PUTTING HOUSEHOLDS INTO SOCIOECONOMIC GROUPS
Choosing Households as the Population Unit
This article focuses on the household as the relevant population unit for income distribution for two reasons, one theoretical and one practical. Simon Kuznets emphasized the theoretical primacy of the household in the 1960s and 1970s. He warned repeatedly that studies of inequality often fail to define the unit of population clearly.Footnote 11 The usual candidates are:
-
• inequality of total income among households
-
• inequality of income per household member (or per adult male equivalent)
-
• inequality of individual incomes per economically active person (e.g., taxpayer, or member of the labor force)
For Kuznets, caring about economic inequality means caring about how unequally people consume resources over their lives. For him, one must measure annual household income per consumer in the household because households share their resources. The income numerator must capture the incomes of all economically active household members, and the population denominator should capture the number of adult-equivalent consumers. He warned against measuring inequality among individual earners.
Kuznets's theoretical argument is reinforced by the constraints inherent to Russian data. Our Imperial Russian sources favored studying households (dvory or khoziaistva) as income recipient units especially for the peasantry.Footnote 12 Throughout European Russia, the peasant commune assigned land and tax obligations to households; inheritance, political authority, and demographic practices were channeled through such units (Worobec Reference Worobec1995). Those who investigate the income structure of other countries in centuries past also focus on households, since they too confront the simple fact that taxable property, such as real estate, tends to be used by, and assigned to, all household members together, even if only one member is the owner and taxpayer.
Estates and Sectors
Imperial Russian law and social inquiries helpfully classified households into groupings useful for our pursuit of income differences. First, across the four centuries leading up to the 1917 Revolution, imperial officials defined classes in a way that differentiated them clearly by legally distinct social estates (soslovia). Our reading (and analysis below) suggests that these categories tended to correspond to income levels, with modifications for urban/rural residence and occupation. This makes it relatively straightforward for us to divide national income along the same class lines that others have considered important. True, the classes overlapped in their income distributions to some extent, but there is considerable evidence that the social tables based on mean incomes for socio-occupational classes come close to approximating size distributions of households' income.Footnote 13
Therefore, we need accurate social tables for late Imperial Russia. Mironov (Reference Mironov2010) has documented membership in estate classes since 1678; his findings are summarized in Table 1. Despite signs of urbanization and churning at the top, with the replacement of old aristocracies with new, changes were slow. The shares of the aristocracy, defined by hereditary or granted title (including attainment via promotions up the famous Table of Ranks), were not high, hovering at less than 2 percent of the population of recognized households.Footnote 14 That was perhaps comparable with the early modern share in France and England. Ancien regime France in 1780 had a similar share of its population distinguished by nobility or clergy: 1.93 percent. For England and Wales, the share distinguished by landowner status was similar, but a bit higher 3.47 percent in 1801–1803.Footnote 15 While these are only rough counts, it is noteworthy that a far more rural Russia had such a small share of its population in the landed elite. As Table 1 indicates, the share of the population in the nobility was small and stable from 1858 to 1913.
Table 1 THE SOCIAL STRUCTURE OF EUROPEAN RUSSIA, 1858–1913

Notes:
The top part of the table indicates the number of people in households headed by individuals in the designated social estate. These data are compiled in Mironov (Reference Mironov and Ben2000, p. 254) and revised in Mironov (Reference Mironov2010, p. 645). The totals in 1913 are reconstructed from church administrative data (1895–1914) and the agricultural census of 1916. The totals for other years are from population and tax-related censuses. The number of “Honored, Titled” (pochetnye grazhdane) households in 1870 are unavailable, while the number in 1913 includes the merchant class. In general, this estate included the higher strata of the urban population, along with upper-level clergy. The “Urban” estate, therefore, included the remaining urban population. Data on the full number of military households are incomplete for 1897 and 1913.
To this stable and skewed social structure, we can attach household counts by economic sector for 1897 (and project forward to match income data for 1904). We attach data on earnings to different parts of the population using the sector that the household head worked in. We count households in the main output sectors by starting with the 1897 census estimates of sectoral occupations (zanyatie) of household heads and inflating the counts to 1904 using population data from the 1904 statistical yearbook of the Ministry of the Interior.Footnote 16 Combining the occupational-sectoral (zanyatie) household counts with the social estate (soslovie) household counts (all by province in European Russia) generates the basic structure underlying the income distribution. Knowing the sector helps to identify the greater earnings of peasants working in industry or local government than those in agriculture or domestic service. And knowing the estate helps to delineate those in “industry and commerce” who were peasants from those in “industry and commerce” who were of the merchant estate. In practice, we began with agriculture and proceeded through the output sectors, ending with industry and commerce as a residual. For each sector, we drew upon the 1897 Census data to allocate households across sectors sequentially, social estate by social estate, for rural and urban areas in each province. We then scaled up the numbers of households according to province-specific population growth between 1897 and 1904.Footnote 17
Table 2 HOUSEHOLD HEADS BY ECONOMIC SECTOR IN EUROPEAN RUSSIA, C. 1904

Note:
These data are from Troinitskii, ed. (Reference Troinitskii1905, vol. 8) and Russia, Tsentral'nyi (1905).
In the end, we construct 2,300 income-earning groups (23 estate-sector combinations by fifty provinces, and by urban versus rural), even before later stratifying by income level on the basis of additional data.
In output sectors as in social classes, Russia's distribution of households was quite skewed: rural agriculture accounted for the lion's share of the population (see Table 2).Footnote 18 By itself, the dominance of agriculture and the peasantry might have obscured our view of overall differences in income. Fortunately, however, we can turn to sources that document high-income earners by sector and social class, the level and inequality of agricultural landownership (and income) by social class, and detailed decompositions of peasant incomes across different sectors. For our study, as for most other quantitative studies dealing with the pre-Revolutionary period, data constraints limit our measures to the fifty provinces of European Russia, omitting Finland, Poland, Transcaucasia, Central Asia, and Siberia.
FOLLOWING THE INCOME CLUES FOR 1890S–1905
Incomes from Landownership
Our best opportunity to take a snapshot of the Russian income structure comes from around the turn of the twentieth century, especially from a combination of large data sets stretching from 1897 to 1905. To work these data sets into a single estimate for “1904,” we start with the generous data on land ownership as of 1905, courtesy of the same Central Statistical Committee that gave us Imperial Russia's 1897 Census.Footnote 19 The 1905 survey measured landownership by the size of area owned, by county and province, and by estate of owner. The estate-of-owner detail is also rich, which is critical given the complexity of Russian land institutions. The data delineate individual household owners by six social estate classes—aristocracy, clergy, merchants and esteemed citizens (kuptsy i pochetnye—the latter was comprised mostly of urban titled elite), townsmen (meshchane), peasants, and miscellaneous estates including foreign individuals. There are separate totals for different types of collective landownership, including peasants' shared allotment (nadel'nye) land stemming from the 1861 emancipation, state lands, corporate lands, and other categories.
The rich detail of the 1905 land survey is subject to two drawbacks for our purposes, drawbacks that we can partly offset with other data. First, the survey consolidated the different holdings of each individual landowner only within each district, without connecting the properties of the same landowner in different districts or provinces. Fortunately, the data impose enough structure to demonstrate that the merging of individual landed properties across provinces cannot have affected income inequality very much. What might seem like a potentially huge understatement of landed inequality cannot be very large, given how certain totals by province and by top income class constrain the possibilities.Footnote 20 In particular, the amount of a district's land, or rental income from owning land, that could, at most, be reallocated to owners from other provinces (remember, all of our estimates are originally undertaken at the provincial level) was actually quite limited and would have only marginal implications for the inequality of landed income. This is because hypothetically “adding” additional land to one large landowner's holdings would entail taking it away from another, likely equally large, owner. We are also aided by our knowledge of the social estate of landownership, which prevents us from misattributing ownership across estates within a province.
A second drawback of the 1905 land survey is that it presents data only on the land areas owned, and not their annual rental value. Fortunately, the Finance Ministry's 1906 study Opyt' priblizitel'novo ischislenia narodnovo dokhoda po raslichnym evo istochnikam i po razmeram v Rossii [hereafter Opyt'] provides average rents in rubles per desiatina (approximately 2.7 acres) per year for each province. We use their provincial rental rates that assumed a 6 percent return on purchase value and that all lands in each province had the same value.Footnote 21 We thus capture only the differences in value per desiatina across provinces, not those within provinces.
The distribution of private landownership, as shown in Table 3, departs from any simple separation of landed from landless social estates. Only one-third of the nobility (dvorianstvo) consisted of landowners, and over a fifth of all merchants and esteemed citizens owned land outside the cities. Of course, of those closest to the land, the peasantry, fewer than 4 percent of household heads had individual privately owned land. This distribution of rural private landownership, by itself, makes Russia look very unequal in international perspective. Table 3's data show that only 4.7 percent of households owned private (non-communal) land other than the plots under urban buildings. This ownership share is smaller than that of other data-supplying countries in the late nineteenth and early twentieth centuries, with the possible exception of Mexico.Footnote 22
This high level of land inequality—and its limited geographic variation—is depicted in Panel A of Figure 1. Not only is the overall Gini coefficient of purely individual holdings high (0.88), but the range is rather narrow across provinces: aside from Archangel' province's Gini of 0.05 (due to the small number of exclusively peasant owners), the next lowest coefficient was 0.55 in the Don Cossack Lands, and the remainder were above 0.63. Significantly, land inequality is lower if we add peasants' communal land holdings per household (Panel B of Figure 1), although the overall Gini remains high at 0.60.Footnote 23 Yet, as we shall see, Russia's high land inequality does not translate into internationally extreme levels of total income inequality.
Table 3 LAND RENTAL INCOMES OF INDIVIDUALS IN EUROPEAN RUSSIA, 1905

Note:
The figures exclude urban realty. In addition to their individual private holdings, the same estates held land as shares in collective private property holdings, amounting to about 12.3 percent of all private land area. These are included in the totals here. Most of this was held by the peasantry. A large share of the peasantry held shares of communal allotment land (nadel'nye zemli), generating an estimated 447,858,172 rubles in rental incomes. Merchants &c = merchants and esteemed citizens (kuptsy i pochetnye).
Sources:
The sources of these data are the owners and land areas from the 1905 Land Census (Russia, Tsentral'nyi, 1906); and rent information from Russia, Ministerstvo (1906). For the derivation of these estimates, see the file, “Ownership of rural lands 1904 (Nafziger-Lindert)” at http://gpih.ucdavis.edu, under Russia in the main data list.
Peasant Incomes
We are fortunate that pre-Revolutionary officials, zemstvo researchers, and scholars took seriously the task of learning not only the averages, but also the distribution, of peasant assets and, very occasionally, incomes in a large number of provinces between the 1880s and the early 1900s. Scholars such as David W. Darrow (Reference Darrow2002) and Igor Khristoforov (Reference Khristoforov2011) have been critical of the methods and perceived lack of objectivity among zemstvo statisticians, but their views generally refer to the researchers' conclusions rather than the raw data. Robert E. Johnson (Reference Johnson, Emmons and Vucinich1982 and 1Reference Johnson997) and Steven Nafziger (Reference Nafziger2010) have pointed out that, in practice, the asset and budget data collected by zemstva and other statistical bodies appear representative.
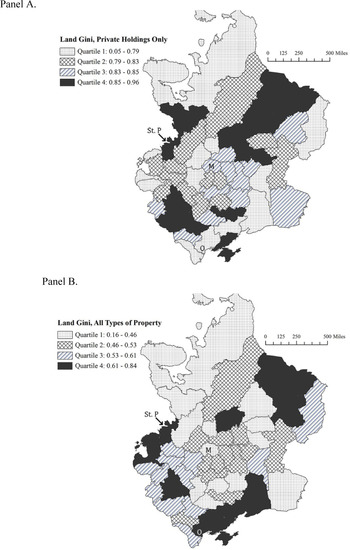
Figure 1 THE GEOGRAPHY OF LANDHOLDING INEQUALITY, C. 1905
Therefore, to more fully document the income distribution of the roughly 80 percent of the population who were peasants, we make use of the results from several zemstvo surveys, supplemented by the 1905 land returns and by independent data on local wage rates.
The heterogeneity of our source materials calls for some elaborate procedures to differentiate peasant income experiences within one province, and then to extrapolate across provinces.Footnote 24 Our starting point is the large budget survey of peasant households in Voronezh in 1897 (published in Shcherbina Reference Shcherbina1900). This provided distributions of incomes by landowning categories that we extrapolated to 1904 ruble values using the aggregate trend in nominal incomes (from Gregory Reference Gregory1982).Footnote 25 Our extrapolation from Voronezh to other provinces then uses other provincial zemstvo studies of peasant incomes, plus relative wage rates in agriculture and industry and the detailed 1905 landownership data for the small share of (private) landowning peasants in each province. The resulting estimates, aggregated to the level of European Russia, appear in Table 4.
A feature of Russia's peasantry that stands in contrast to most other countries' agricultural or rural households before 1914 is that most of the Russian peasantry were effectively “tenant” farm operators and their dependents. Fewer than 5 percent of peasant households were laborers who lacked their own farm, just as fewer than 5 percent owned land only as individual households (i.e., non-nadel'naia, or non-communal, land). What we call “tenants” were those peasants who received agricultural income primarily from the application of labor to production on their share of communal holdings.Footnote 26 This broad group was fairly compressed in its income levels, with the top 5 percent (the “top farmer operators, not private owners” in Table 4) having only a bit more than triple the average incomes among the bottom quarter (“lower farm operators”). Part of the reason, of course, is that collectively owned land, whose value is included in these measures, is believed to have been shared fairly evenly (e. g., Robinson Reference Robinson1972 [1932]).Footnote 27 Thus far we have two opposing tendencies (suggested by comparing Panels A and B of Figure 1): highly unequal ownership of land among individuals, and relatively equal incomes within the peasantry from their access to collective landholdings. To complete the picture of overall inequality, we need to add other types of income and then work out the implications of the gaps between the estate classes' average incomes.
Table 4 ESTIMATED PEASANT HOUSEHOLD INCOMES IN EUROPEAN RUSSIA, C. 1904

Notes:
“Poor farmless peasant laborers” is our estimate of households residing in communal villages but without a share of allotment land. The individual peasant landowners of Table 3 included the private landowners described here and some non-communal but collective land holders. The source for the 1897 population and household counts by sector is Troinitskii, N.A., ed. (Reference Troinitskii1905, vol. 8), with population adjustments according to growth rates calculated with the aid of Russia, Tsentral'nyi (1905, pp. 40–53). Underlying data on wage incomes in the 1890s are from zemstvo budget studies reported in Russia, Departament (1903, p. 199 and pp. 234–37). Zemstvo studies tended to average incomes per peasant household for particular areas. Such studies yielded usable average household incomes for six provinces from the 1890s and start of the twentieth century. See the Online Appendix, plus the derivations in the Excel File, “Peasant incomes 1904 23mar12.xlsx” at http://gpih.ucdavis.edu, under the Russia files.
Top Incomes (The Opyt' Study)
As in many other states in the late nineteenth and early twentieth centuries, officials in Tsarist Russia began to consider the installation of an income tax to generate revenue (Kotsonis Reference Kotsonis2004). Using the census as a springboard, the Ministry of Finance launched an inquiry into the structure of top incomes in order to estimate how much income tax revenue the state could potentially raise, and from whom. One fruit of this endeavor was the Ministry's detailed estimates of high incomes over the period 1900 to 1904—Opyt' (Russia, Ministerstvo 1906). Targeting only the top of society for potential income taxation, the Ministry's estimates covered those annual incomes exceeding 1,000 rubles. The corresponding total household count came to only 2 percent of all households. A follow-up study in 1910 gave further elaboration of the forecasted possible revenues. Yet in the end, the project for a comprehensive income tax was blocked and remained unimplemented before the 1917 Revolution.Footnote 28
To exploit this unique data source, we must confront a large problem shared by all the income data from Imperial Russia: official fiscal authorities never measured total income, unlike the micro-level (e.g., zemstvo) budget surveys of worker and peasant households. What the Opyt' data offer are totals of specific kinds of income in different ranges above 1,000 rubles and the numbers of households receiving income in each source by size category by province cell. While some data in the source offer the distribution of land area or land value, with no attention to other incomes; others are confined to urban real estate rents; other data represent wage and servant income in narrow formal sectors; others cover just industrial or commercial profits; and so forth. The same problem often arises in other countries, e.g., in the separate-schedule income tax data of Victorian Britain, or in early America, where the data on property incomes are completely divorced from the data on a household's own human earnings.
The size of this top group and its different sources of income are summarized in Table 5. Such high incomes were especially concentrated in landownership and commercial enterprises, but they were also evident in state service and from returns to financial investments. To understand the distribution of incomes at the very top, we utilize the fact that Opyt' breaks down these high-income categories by province and into six different ranges, from the 1,000–2,000 range up to incomes above 50,000 rubles. Again, the original data treat each income source as separate, although it is very likely the case that the highest earning households received more than 1,000 rubles from multiple sources. The details in Opyt' illuminate the top of the income structure, once we have made plausible assumptions about how the different sources of income were combined into the same households.
Table 5 OPYT ESTIMATES OF HOUSEHOLDS WITH INCOMES ABOVE 1,000 RUBLES, C. 1904

Notes:
These data were derived from Russia, Ministerstvo (1906). Each row's counts of persons and incomes refer only to its type of income source. As noted in the text, the officials were unable to combine the different types of incomes for any given household. The comments refer to: (a) = 50 provinces of European Russia, (b) = 49 provinces = European Russia minus Arkhangel'sk, and (c) = unclear geographic coverage, probably the fifty European provinces plus the returns from a few reporting provinces in the North Caucuses and Transcaucasia, but excluding Finland, Poland, Central Asia, and Siberia. Russia, Ministerstvo (1906), itself, summarized the overall returns at the broader (c) geographic basis. The totals reported in its Table XXIII were thus larger: 404,703 households, with incomes totaling 1,723,779,477 rubles. For details, see the file, “High incomes c1904, from the Opyt' (1906) study …,” under Russia in the main data list at http://gpih.ucdavis.edu.
In general, these assumptions mimic our work with the 1905 land statistics, in that combining multiple sources of high incomes for one household necessitates taking one or more sources from another household, and bounds on the impact of such reshuffling can be established.Footnote 29
RUSSIAN INCOME INEQUALITY C. 1904: RESULTS
We combine information on the number of households by class and sector, the distribution of land, the sources of peasant incomes, wage data, and top incomes from the Opyt' study to map out the distribution of incomes in European Russia around 1904. The underlying sources provide these data at the provincial level, and we take advantage of this to construct geographically disaggregate estimates. We estimate mean incomes accruing to each class/sector “cell,” order the cells. The cells number about 85 per province, or 3,529 nonzero cells for the fifty provinces. We aggregate up to define the relevant income shares and Gini coefficients (this is done both at the provincial level and for all of European Russia). Below, we focus on our intermediate, “preferred” inequality estimates, which assume that each household in a cell has the same mean income.Footnote 30
Figure 2 reports an intermediate result of this exercise: the estimates of mean incomes across all types of households in each province.Footnote 31 The highest incomes were evident in the Baltic and northwestern provinces (including Petersburg, at 1,317 rubles), in Moscow (1,147 rubles), and in the Black Sea provinces (Kherson, with Odessa, at 829). The Eastern provinces had lower incomes, as did a number of central agricultural provinces. These estimates are consistent with existing studies of Russian living standards (i.e., Mironov Reference Mironov2010, 2Reference Mironov012), especially those that emphasize the heterogeneity of economic development by the early twentieth century (Dennison and Nafziger Reference Dennison and Nafziger2013; Wheatcroft Reference Wheatcroft, Kingston-Mann and Mixter1991). The overall mean income of 612.5 rubles is very close to Gregory's (Reference Gregory1982) aggregate per capita income of 100 rubles, with average household size of around six individuals.

Figure 2 THE GEOGRAPHY OF HOUSEHOLD INCOME LEVELS, C. 1904
We present our preferred estimates of household income inequality in 1904 in Table 6. Our estimate of the top income 1 percent income share (13.5 percent of total income) happens to be close to Gregory's calculation, which relies exclusively on the Opyt' data and his national income data (Appendix Table 1).Footnote 32 The top 20 percent of households received slightly less than 50 percent of total income, and median incomes were 2/3 of the mean level. Based on 3,529 populated class/sector/province cells, we estimate the overall Gini coefficient to be approximately 0.36.
Table 6 PREFERRED INCOME INEQUALITY ESTIMATES FOR EUROPEAN RUSSIA, C. 1904

Notes:
These numbers reflect our preferred estimate as described in the text. Data and further details may be found in the text, the Appendices (published and online), and the 1904 inequality file at http://gpih.ucdavis.edu.
Figure 3 reports the geographic heterogeneity of income inequality within each province. These data rely on the same methods for calculating Gini coefficients as we employ in the aggregate in Table 6 but are executed separately using each province's data from the various sources described earlier. In general, the mean income levels reported in Figure 2 are positively correlated with the level of inequality (coefficient of 0.75). The two capital provinces saw high levels of inequality, as Moscow and Petersburg were the only two provinces with Ginis above 0.5. Other provinces with high inequality included the Baltics, southern Ukrainian and Black Sea provinces, and Orenburg in the Urals. The lowest levels of income inequality were generally found in the northern provinces and the upper Volga region.
We place these findings on the Russian income distribution in 1904 into context in the next section. In the meanwhile, it is important to acknowledge four mechanical ways that these “preferred” estimates may underestimate or overestimate the true level of inequality. In each case, we note the errors that may remain, yet we find that the imperfect source materials do deliver enough information so that the true inequalities of income must have been close to our estimates.

Figure 3 THE GEOGRAPHY OF INCOME INEQUALITY, C. 1904
A first possible bias relates to multiple land holdings. The available land statistics treat owners in each district as distinct, although we know that the largest landowners in Russia held numerous properties scattered across provinces. However, it turns out that the available data have imposed enough constraints so that their failure to merge properties across provinces is unlikely to lead us to underestimate inequality by very much.Footnote 33
A second possible bias may arise from our assumption about the distribution of incomes within the class/sector cells. In our preferred estimates, all of the households in a cell are assigned its mean income, and, by default, we do not assume that incomes overlap across groups. Recent work by J⊘rgen Modalsli (Reference Modalsli2011) suggests that this simplifying assumption may not lead to the underestimation of inequality when within-group dispersion takes particular forms, even in studies with only a few dozen cells. Our use of 85 cells for each of fifty provinces suggests that there is little possible bias from using cell means.Footnote 34
A third possible source of bias may arise from how we assign incomes from other sectors to households whose primary earnings are located in one particular sector. Although peasant, noble, and other types of households tended to cluster in one sector (usually agriculture), these households also earned income from other sources in Russia, as in all other countries. We feel that our preferred estimates make a number of reasonable assumptions regarding this aggregation, especially for the peasantry and other lower income groups.Footnote 35
Finally, we see only a small bias in overall inequality coming out of the information on top incomes reported in Russia, Ministerstvo, Opyt' (1906). One might initially fear that the different kinds of incomes in Table 5, such as rural land or urban real estate or government salaries, all referred to different incomes of the same very rich households, causing an understatement of inequality. Yet here too, as with the land distribution, even flawed data have succeeded in putting bounds on the possible true distribution of income. Common sense and simple algebra confirm that the source materials' separations of different kinds of income do not seriously undermine our results.Footnote 36
RUSSIAN INEQUALITY IN COMPARATIVE PERSPECTIVE
In the degree of its household income inequality in the early twentieth century, Russia was not alone. So says Table 7's comparisons of two kinds of summary measures of inequality: the shares of all incomes received by the top ranks, and the Gini coefficient. Even though one might have expected that a country on the eve of a large Revolution and, subsequently, the first Communist Revolution would have provoked its fate with some of the world's widest gaps in income, Table 7 offers no confirmation of this hunch. The clearest contrast consists of a set of experiences where inequality was more severe than it was in Imperial Russia. One such bastion of inequality was Victorian England, as represented by Dudley Baxter's estimates for 1867 (two others were Peru and South Africa, as Table 7 suggests). The gaps were wider in England, both between top incomes and middle incomes and between middle incomes and the bottom.
Table 7 INCOME INEQUALITY IN IMPERIAL RUSSIA AND SELECT OTHER SETTINGS
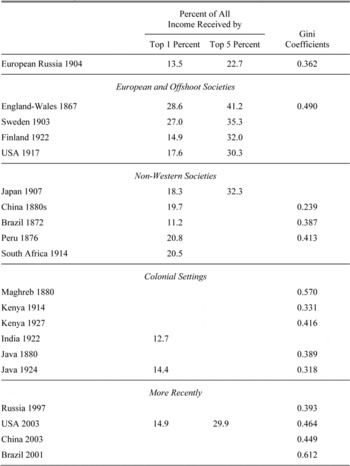
Notes:
The Russian estimates are the preferred estimates from Table 6. The main tertiary sources are Atkinson, Piketty, and Saez (Reference Atkinson, Piketty and Saez2011); Milanovic, Lindert, and Williamson (Reference Milanovic, Lindert and Williamson2011); files available at the Global Price and Income History Group (http://gpih.ucdavis.edu, “early income distributions”); and the World Bank's Deininger-Squire inequality database at http://www.wider.unu.edu/research/Database/en_GB/wiid/.
Another intriguing comparison is with inequality in Russia today.Footnote 37 Some very rough conclusions are possible, once one considers two data limitations. The first limitation involves differences in geography: the Russian Federation has lost the imperial provinces that have become Belarus, Ukraine, and Moldova, but now includes the Siberian and northern Caucasian parts of the Federation. The other is that the post-Soviet measures of income distribution tell inconsistent stories because of changing definitions of income and population. The most comparable with our estimates for Imperial Russia are the 1995–1998 measures of the distribution of households' gross (pre-tax and pre-transfer) money income by Goskomstat, the predecessor of today's RosStat. Taking the estimates at face value, gross income inequality was already a bit higher in 1997 than in 1904. We suspect that these numbers understate the rise in inequality in the Yeltsin decade by underreporting top incomes.Footnote 38
Clues about movements in Russia's gross income inequality since the mid-1990s can be gathered from other series, ones that are less directly comparable with our 1904 measure. These other measures suggest a rise in inequality to around the year 2000, followed by equalization since then, not only in Russia but also in Ukraine and Moldova. In Belarus, inequality had already peaked back in 1993, and has drifted down since then.Footnote 39 Combining Table 7's direct comparison of 1904 and 1997 with the post-Soviet movements in other series suggests that relative to European Imperial Russia before the Revolutions, the income distribution in the Russian Federation started out less unequal at the time of the collapse of the Soviet Union, then became more unequal by the mid-1990s, reaching one of the highest levels of inequality in all of post-1861 Russian history.Footnote 40
The other settings of high inequality, in which Gini coefficients exceed 0.42, mostly consist of countries in the late twentieth and early twenty-first centuries. Among the many countries where incomes are clearly more unequal today than they were at the sunset of Imperial Russia are Brazil, China, the United States—and possibly Russia itself. All four of these countries have experienced a rise in inequality, the United States since the eighteenth century and the other three during the twentieth. Yet for many other countries, such as Britain and Sweden, the gaps are now narrower—households are more equal—than they were in the nineteenth century and early twentieth.Footnote 41
Such conventional comparisons of inequalities in nominal income need to take in account the redistributive role of the state in inequality. The possibility of redistribution from poor to rich, alias “fiscal regressivity,” lurks in the background here. It is hidden by the fact that for Tsarist Russia, as for other countries at the time, the data offer more information on “pre-fisc” income inequality than on the “post-fisc” distribution after taxes and transfers. Relative to other European countries, Russia showed more signs of fiscal regressivity in declining to redistribute from rich to poor. One sign of regressivity in the government's policies is the fact that the net rental values on state and church lands could have been worth as much as 8.1 percent of national income.Footnote 42 If one views these as incomes that an elite withheld from the people who worked those lands, then top-income shares should be raised by this amount. Another sign of regressivity was that failure to pass an income tax when other governments were doing so in the early twentieth century. This was compounded by the central government's growing reliance on revenues from the indirect taxation of basic consumption goods. By the early twentieth century, central government indirect taxes—generally on goods important to all classes such as salt, sugar, etc.—were more than three times direct property and corporate incomes taxes, and the budgetary numbers on the former did not include the state's control of the alcohol monopoly.Footnote 43 On the expenditure side, the central government failure to finance education left primary schooling at the mercy of political debates within zemstva and other impoverished local governments until limited state-sponsored efforts after 1905.Footnote 44 The failure to redistribute to any significant degree through investments in broad public goods distinguishes the Russian experience from the late nineteenth—early twentieth century emergence of substantial social spending in the more developed economies of Europe and elsewhere (Lindert Reference Lindert2004).
CONCLUSION
Russia's distribution of incomes thus contrasted sharply with the distribution of political voice on the eve of the 1905 Revolution. Russia's inequality of political voice was extreme: Of the 53 sovereign states in 1904, Russia was one of the bottom four having a Polity rating of zero democracy and complete autocracy.Footnote 45
Yet in terms of income inequality, Russia seems to have been relatively egalitarian among data-supplying countries. This income result might be viewed as the net result of two fundamental influences on Russian economic fortunes prior to the Revolutions. The fundamental egalitarian force was geographic: Russia has always stood out as abundant in productive land and staple grains. The land/labor logic that other scholars have used to link the Black Death to the freedom and wellbeing of the English yeoman should theoretically have compressed the income structure—and likely continued to do so, other things equal, even on the eve of Revolution. Contemporary accounts of land “scarcity” were not reflected in the statistical evidence and were almost entirely limited to a declining region to the south of Moscow, where agriculture was simply not as productive as the southern and Ukrainian provinces (Wheatcroft Reference Wheatcroft, Kingston-Mann and Mixter1991). Although the peasantry was not the homogenous group that is often assumed, the predominance of communal property among such a large part of the population likely held down inequality (even if only by providing a security net with which peasants could pursue nonagricultural pursuits).Footnote 46
Yet political inequality also dominated the country's pre-Revolutionary history. The demise of serfdom did not necessarily end restrictions on peasant labor mobility, nor did it eliminate the economic and political power of the landed elite in the countryside. The imperial autocracy's dependency on elites for its power continued to be reflected in the property, income, and political inequality among estates and classes. Even if extraordinary political inequality did not manage to create extraordinary income inequality by global standards, it did leave those signs of limited, or even regressive, redistribution we have already noted. Furthermore, income inequality in contemporary Russia likely matches or exceeds the pre-Revolutionary level, and the fiscal structure is perhaps equally skewed towards politically connected elite at the expense of those lower on the income distribution (Gelbach 2008).
The limited, albeit geographically varied, inequality we find is consistent with economic growth and a positive trend in living standards, especially in rural areas. Even if peasants were increasingly “differentiated,” slowly rising agricultural productivity and growing opportunities for nonagricultural earnings were likely improving conditions at the lower end of the income distribution. This process may have been accelerated by the subsequent Stolypin land reforms, which eased constraints on peasant mobility and may have led to improvements in agricultural productivity (Chernina, Dower, and Markevich forthcoming). However, the fact that inequality appears to have been particularly concentrated in the booming capital cities hints at a possible tenuous link to the Revolutions of 1905 and 1917, which both began in these urban settings. Whether the level of income inequality was related to the amount and distribution of subsequent rural unrest in the two revolutions is a topic worth further exploration.Footnote 47
The research task that now dominates our agenda is to trace and explain the earlier path to the inequality of the early twentieth century. Was it always that way? Or did the classes' relative fortunes change across the Emancipation Era (between the benchmarks of 1858 and 1877) or the post-Emancipation era, say from 1877 to 1913? What earlier movements were likely? Mironov and others have led the way with important new work on real wages and other indicators of the level of living standards, but significant empirical materials remain relatively untapped throughout the long nineteenth century to further explore the distribution of economic outcomes. The task is not an easy one for the pre-Emancipation era, mainly because it is hard to capture the income effects of the ownership of serfs.Footnote 48 Further archival and original source research will hopefully allow us to make progress in identifying the dynamics of Russian income inequality, both before and after 1904.


