


Why did the United States subsidize American multinationals' entry into countries treated as informal colonies? We study a classic case of American imperialism, the 1903 U.S. support of Panama's secession from Colombia and subsequent U.S. payment of the 1921 reparations that opened Colombia's oil fields to Standard Oil. We test Noel Maurer's (Reference Maurer2013) empire trap hypothesis quantitatively. Archival and econometric evidence documents Colombia's threat to Standard Oil's sunk investment, which induced the multinational to build a supermajority coalition in the U.S. Senate to back a reparations treaty. Results support the empire trap hypothesis but point out important qualifications.
Why did the United States subsidize American multinationals to enter into countries treated as informal colonies? Classic cases of American commercial imperialism, including covert Central Intelligence Agency (CIA) actions in Iran (1951), Guatemala (1954), and Chile (1973), suggest that imperial interventions protected U.S. multinationals' property, led to increasing stock share prices for the multinationals, and supported U.S. exports to these countries (Dube, Kaplan, and Naidu Reference Dube, Kaplan and Naidu2011; Berger et al. Reference Berger, Easterly, Nunn and Satyanath2013). It is not clear, however, if the rationale for these imperial interventions was to improve U.S. welfare or if it was the result of special interest group influence on the government to capture rents, or both. Nor it is clear how the redistributive political struggles these interventions originated at the empire were resolved.
This article contributes to our understanding of United States' subsidy of American multinationals in informal colonies by examining a paradigmatic case of American imperialism: The U.S. support for Panama's secession from Colombia in 1903 and the subsequent payment of $25 million in reparations to Colombia that opened the oil fields in the Andean country to the Standard Oil Company of New Jersey (hereafter SONJ). The case represents a rare window to observe, within an empire, social decision making over an imperial action. The American government preferred to pay reparations to Colombia and indirectly subsidize SONJ rather than embarking on an opaque military intervention to destabilize Colombia's government. Thus, we can examine the 1921 Urrutia-Thomson Treaty senatorial voting patterns and infer the role played by ideology, constituency interests, and special interest groups.
We document key events of the case study using archival material that draws on primary sources on SONJ and its subsidiaries, available at Baker Library (Boston, MA), Glenbow Museum (Calgary, Canada), Biblioteca Luis Angel Arango (Bogota, Colombia), and United States and Colombia congressional and government documents. Econometric analysis of the treaty vote helps us to better understand the U.S. Senate's decision to ratify the treaty.
The events we examine start in 1903, when the United States supported Panama's secession. Colombian-American relations soured. A decade of disinterest in Colombia followed until 1914 when the U.S. Cabinet agreed to pay reparations and thus facilitate the opening of Colombia's oil fields to SONJ. However, when the U.S. Senate failed to vote on the reparations after SONJ had made the investment to produce crude oil, Colombia's government blocked the multinational's request for a 300-mile pipeline from the oil fields to the Colombian port of Cartagena. The archival evidence explicitly connect Colombian government officials, SONJ directors, and some influential American congressmen, suggesting the multinational was then induced to lobby the U.S. Senate in favor of reparations and build a coalition to ratify the treaty.
To examine if the hypothesis that SONJ influenced senators to build a coalition to pass the Colombia treaty is consistent with senatorial voting patterns, we estimate a senator's voting decision model. The treaty was ratified with 78 percent votes. Our econometric analysis identifies three groups of senators that supported ratification: senators from states with substantial oil production and refining, including those where SONJ was influential; senators who were indifferent to government intervention on social issues and faced low political competition (and whose votes were plausibly bought); and senators who leaned consistently to prefer government intervention on social issues. Opposition came from senators representing states that were net federal tax contributors and from senators who consistently opposed government intervention on social issues and were associated with President Theodore Roosevelt. Having pushed for Panama's secession, the former president objected to reparations.
The findings contribute to several literatures. First, empirical trade and economic history literature suggest two rationales for imperial subsidies to its multinationals: the empire effect and the empire trap.
In the empire effect rationale, an empire may offer subsidies in the form of common law, language, currency, or lower trade barriers to promote a positive externality and increase welfare (Mitchener and Weidenmier Reference Mitchener and Weidenmier2005, Reference Mitchener and Weidenmier2008; Ferguson and Schularick Reference Ferguson and Schularick2006).
In the empire trap argument, that is more closely connected to our study, a multinational entering a formal or informal colony faces opportunistic behavior and resistance from the colony, and in an informal colony it also faces a risk of expropriation. An empire's multinational exposed to these risks has incentives to lobby the imperial government for a subsidy that reduces the firm's exposure. The subsidy may be a direct payment to the multinational, but more frequently has been aid to the colony in exchange for protection for the multinational assets, or a threat of military action (Hopkins Reference Hopkins1973; Frankema Reference Frankema2010; Maurer Reference Maurer2011). Extending the logic of this argument, Noel Maurer (Reference Maurer2013) has suggested that an empire is likely to undertake the requested intervention even if the capital exposed to risk is small and no positive externality for the empire exists. Failure of political collective action a la Mancur Olson (Reference Olson1965) may exist if the multinational is well-organized and expects to concentrate the benefits of intervention, while costs are expected by decentralized and unorganized groups of individuals who each face a small loss. Thus, a multinational is likely to gain subsidies even if it is not in the interest of the empire as a whole—the empire trap. A series of American imperial interventions to protect the property of their multinationals has been documented and implicit subsidies increased the benefited firms' capital market value (Dube, Kaplan, and Naidu Reference Dube, Kaplan and Naidu2011; Maurer Reference Maurer2013).Footnote 1
As far as we are aware, we provide the first quantitative test of the empire trap hypothesis. The test reveals that collective action failure in the political market does play a role. Oil special interests influenced some senators and plausibly bought the votes of others to ratify the Colombian reparations treaty. But senators generally favoring government intervention in social issues also played an important role. Ideology, as much as economics, is an important driver of the political process of the empire trap in the United States. The importance of the redistributive conflict is also qualified. Although total benefits for the United States were higher than the reparation paid to Colombia, the refiners captured most of these benefits, while the American oil derivatives consumers and individuals and non-oil firms taxpayers ended up less well-off than before the treaty ratification.
Second, economic and business history and the international business literature have qualified the idea that a multinational will be supported by its home empire and that the empire may exercise unchallenged power over an informal colony and so determine outcomes in these countries. Particularly in informal empires, the governments of colonies can hold up multinational companies and leverage negotiated outcomes (Kobrin Reference Kobrin1980; Maurer Reference Maurer2011, Reference Maurer2013). Our results qualify further the idea of unchallenged exercise of imperial power and the role of multinationals in the empire-colony government relationship. We find that a special interest group can influence its own empire's policy in favor of an informal colony, induced by the colony's government via hold up pressure on the special interest group's multinational local operations. As far as we are aware, neither the point that an informal colony's government may influence an empire's policy nor the multinational as a mechanism to do so has been identified before in the literature.
Third, rather than studying either negative imperial interventions like military interventions or coups (Dube, Kaplan, and Naidu Reference Dube, Kaplan and Naidu2011; Berger et al. Reference Berger, Easterly, Nunn and Satyanath2013) or positive ones like aid or reparations (Ball and Johnson Reference Ball and Johnson1996; Alesina and Dollar Reference Alesina and Dollar2000), we show that these two types of imperial interventions are frequently connected and should be studied as part of a wider and more dynamic bargaining process between the informal colony and empire governments.
PANAMA, OIL, SONJ AND THE UNITED STATES REPARATION TO COLOMBIA
On 20 April 1921, the U.S. Senate ratified the Urrutia-Thomson Treaty (UTT). The UTT was a foreign treaty that committed the United States to pay $25 million in reparations to Colombia in compensation for American support of Panama's secession from Colombia in 1903. In this section we examine the events leading to ratification of the treaty and document the role played by Colombia's government and SONJ. The historical interpretation we present qualifies the existing historiography. Taylor Parks (Reference Parks1935), Fred Rippy (Reference Rippy1976), René de la Pedraja (Reference de la Pedraja Tomán1985), and Richard Lael (Reference Lael1987) all acknowledge that oil interests did play a role in ratification, but none provides as complete an account as we provide and all overlook the active role the Colombian government played in holding up SONJ and influencing the U.S. ratification of the UTT.
The American Empire and Panama's Secession from Colombia
As the nineteenth century advanced and the United States expanded to the west, acquiring California, Philippines, and Guam, and founding its empire, and China and Japan opened to trade, commercial exchange between America and the Pacific area grew rapidly. The Panama Isthmus was the preferred route for a canal to facilitate Atlantic and Pacific exchange (Maurer Reference Maurer and Yu2010, pp. 26–38).
Initially, the United States tried to acquire the necessary land through diplomatic means. The 1903 Herrán-Hay Treaty offered Colombia a $10 million one-off payment for the right to build and operate the Panama Canal and, once the canal was operating, an annual payment of $250,000 for 14 years. The treaty was rejected by Colombia's congress, and in November 1903 the U.S. government supported the secession of Panama and subsequently negotiated construction of the canal with Panama's new government. The canal was finished by 1914 (Maurer and Yu Reference Maurer and Yu2010, pp. 39–68).
After Panama's secession the relationship between Colombia and America soured. Between 1903 and 1913 the only attempt to normalize Colombian-American relations was the 1909 Root-Cortez agreement that offered Colombia $2.5 million in reparation to U.S. support to Panama's secession. The small amount the treaty involved caused fury in Colombia's congress. Rafael Reyes, Colombia's president, who had negotiated the agreement, was accused of treason, and under mounting pressure, resigned and left the country in exile (Bushnell Reference Bushnell2007, pp. 234–35).
Global Oil and the Urrutia-Thomson Treaty
The rise of the American empire coincides chronologically with that nation's consolidation as a global major oil producer and exporter. By 1910 the United States produced 64 percent of world crude oil, American entrepreneurs produced 3 percent abroad, and Russia another 21 percent. The United States consumed about 90 percent of its domestic production (Fanning Reference Fanning1945, pp. 14–16).
In 1911 the U.S. Supreme Court decided to break up the Standard Oil Holding Company, the world's largest crude oil producer and refiner. SONJ became an independent firm and was allocated a quarter of worldwide refining capacity but only a small crude oil production capacity. SONJ had to stealthily look for new oil fields abroad because anti-trust provisions at state level and federal level inhibited expansion in the domestic market, and European imperial powers blocked access to their colonies' oil reserves (Gibb and Knowlton Reference Gibb and Knowlton1956, pp. 77–78, 87, 106; Pratt Reference Pratt1980). SONJ's entry into the global oil industry took place as oil became strategic for both American and British governments in the build-up to the Great War and competition intensified (Yergin Reference Yergin1991).
One of the first contests for oil took place in Colombia. In 1913, Pearson and Son, a large British oil firm, proposed a concession contract to explore for oil. The project passed the first round in the Colombian Congress, and the country's Supreme Court did not object. The contract was ready for the second and final round in the congress. Noticing Pearson's interest in Colombia's oil, SONJ decided to compete for the concession by sending an agent to Colombia to start a press campaign against Pearson's project. On 24 September 1913, presumably under SONJ's influence, the U.S. Department of State offered $20 million in reparations to Colombia. A few days later Pearson withdrew its bid. On 6 April 1914 the United States and Colombian Cabinets signed the UTT for $25 million in reparation for the loss of Panama (3.5 percent of the U.S. federal expenditure and 9 percent of Colombia's gross national production (GNP) in 1913; an equivalent share of 1913 U.S. gross domestic production (GDP) is $11 billion in 2015). Colombia ratified the treaty on 9 June 1914 and expected the U.S. Senate to ratify it rapidly (Bucheli Reference Bucheli2008).
Archival research has revealed that during the next five years SONJ intermediaries legalized the oil concession contract, created the Tropical Oil Company (TROCO) to manage oil production in Colombia, and invested about $39 million to produce oil. At the same time SONJ directly verified the great potential of Colombian oil fields. The intermediaries transferred TROCO's ownership to the International Petroleum Company, an affiliate of SONJ, in August 1920. The conglomerate was now ready to pump Colombian oil.Footnote 2
But SONJ faced another hurdle. Colombia's oil field was located in the center of the country, 300 miles from the Caribbean coast where crude could be loaded onto tankers and sent to SONJ refineries in New Jersey or Canada. Thus, SONJ asked the Colombian government for a concession to build a 300-mile oil pipeline.
The U.S. Senate Ratification of the Urrutia-Thomson Treaty
The situation surrounding the pipeline negotiations was complex. On the one hand, the United States faced inducements to ratify the treaty. By the time SONJ requested the pipeline contract, the global oil market had been growing fast. World War I made it clear that oil was a key input mobilizing armies. American domestic production was growing, but consumption was growing even faster. The Coolidge Conservation Commission was still almost a decade away, but the United States was already developing policies to gain control over oil reserves abroad, preparing for an eventual war (Denny Reference Denny1928, pp. 16–18).
On the other hand, the United States also faced important disincentives to ratify the treaty. First, the post-WWI economic boom ended in an acute recession precisely at the same time SONJ requested the pipeline contract, 1920–1921 (Bordo and Landon-Lane Reference Bordo and Landon-Lane2010, pp. 5–7). American senators had good reasons to think the Colombia reparations could be better spent domestically.
Second, political opposition to the treaty had a long and strong history. Between 1903 and 1913, under Republican leadership, the United States had shown little interest in normalizing relations with Colombia. The Great War did not prevent President Woodrow Wilson administration's multi-year federally funded military interventions in Cuba, Haiti, Veracruz in Mexico, Nicaragua, and indirect actions to oust General José Bordas in the Dominican Republic, but consideration of the Colombian treaty in the Senate Foreign Relations Committee was blocked by Henry Cabot Lodge and the Republicans until 1917. The committee now sought to reduce the reparation from $25 to $15 million and to exclude an apology by the United States, but this did not satisfy Republicans. In 1919, Colombia softened its position and dropped its demand for a formal apology, expedited SONJ's acquisition of TROCO's concession contract and even enacted legislation favorable to foreign direct investment in oil, all to appease the opposing Republicans. It was not enough. The Republicans considered $25 million an extremely high sum. Colombia's executive reacted with a decree making subsoil minerals the property of the State. Colombia's Constitutional Court quickly declared this unconstitutional and a decree guaranteeing security to foreign direct investment was introduced, but the U.S. Senate used this incident to delay ratification even longer and to impose further conditions. By the beginning of 1921 the Foreign Relations Committee had not proposed a UTT roll call vote to the Senate plenary, and Colombia was increasingly frustrated precisely at the time SONJ was negotiating the pipeline concession.Footnote 3
Important evidence unearthed during our archival research is a cable that reveals the decision by Colombia's government to use the pipeline contract to hold up SONJ and press the U.S. Senate to ratify the treaty. On 25 January 1921, knowing that SONJ could not exploit the existing TROCO concession without the pipeline, Laureano García Ortiz, Colombia's minister of foreign affairs, indicated via a cable Carlos Urueta, the Colombian minister to the United States that the “[The United States] … wants approval of [the Urrutia-Thomson] Treaty to depend on other matters not connected to the original agreement. Unfair, irregular, is to hold ratification of previously recognized right to subsequent demands of different interests. Colombia agreed to adapt its legislation to such oil interests, until they were satisfied in solemn declaration by the [U.S.] Senate. Today it pretends to defer and further amend the treaty. My Government does not threat, it just suspends resolutions on oil concessions, because public opinion does not allow its approval anymore. Country tired in their expectation…. These considerations should be communicated to whom you consider appropriate, especially [SONJ's negotiator James] Flanagan.”Footnote 4
Colombia's calculation that Flanagan and SONJ could exert some influence in the U.S. Senate proved correct. Flanagan had shown willingness to lobby the U.S. Senate when early in 1920 he organized a meeting between Colombia's minister to the United States and Senators Albert Fall (R-NM), Henry C. Lodge (R-MA), and Warren Harding (R-OH), all members of the Foreign Relations Committee. In late 1920, with $39 million of sunk investments in Colombia, Flanagan again lobbied for the ratification of the UTT, this time with Senators Fall, Lodge, Gilbert Hitchcock (D-NE), Oscar Underwood (D-AL), and now President-elect Warren Harding (Gibb and Knowlton Reference Gibb and Knowlton1956, p. 379).
After his first cabinet meeting President Harding asked the Senate to consider ratification of the UTT. Discussion in the Senate indicates that SONJ's efforts to influence the senators were successful. On 19 April 1921, Senator James Reed, D-MO, clearly stated the case put forward by the oil interests by observing that “… an attorney for these oil companies … came to Washington and stated that if the treaty was not ratified it would involve the entire oil situation; that the present administration [in Colombia] might be overthrown and that the oil interests of these [American] people lost. The substance of the talk was that the treaty must be ratified in order to protect the [American] oil interests” (Congressional Record, 67th Congress, 1st Session, p. 314). With the death of former President Theodore Roosevelt, some Old Guard Republicans decided to change their position. Senator Lodge, a member of the Foreign Relations Committee since 1911 and consistently opposed to ratification of the treaty, now indicated that “the ratification of this Treaty will lead to a prompt additional treaty of amity and commerce with Colombia [presumably the oil pipeline concession] which will improve our opportunities there making secure the concessions we now have.” He read a letter sent by Secretary of the Interior Fall, a former senator and member of the Foreign Relations Committee and consistently opposed to the treaty, now writing “I have every assurance … short of actual written agreement that the present Colombian government and prominent Colombians, favoring this policy, will immediately, upon ratification of the present treaty, … enter into a supplemental treaty [presumably the pipeline concession] ….” (Congressional Record, 67th Congress, 1st Session, pp. 116, 163). And Senator Porter McCumber, R-ND, another former opponent of the treaty now stated, “I am voting to stake $25m on the effort of the president to secure without an additional donation a supplemental agreement that will be worth to this country many times that sum” (Congressional Record, 67th Congress, 1st Session, p. 116).
Progressive Republican senators opposed the UTT. Senator Hiram Johnson from California, who had been running mate of Theodore Roosevelt for the Progressives during the 1912 election, asked in his congressional speech “Why do we have $25,000,000 to squander in the first act that a Republican administration does” and denounced Republicans who had changed their mind asking “tell me when the blackmail demand shed its awful outer garment and became a rosy-hued request” (Murphy Reference Murphy2013, p. 569). Senator William Kenyon from Iowa characterized Colombia's pressure as blackmail and observed the political and economic opportunity cost the treaty implied when he indicated, “I wonder what these gentlemen who have raised their voice so loudly about the [advantages of the UTT for the United States] economy are going to say when the soldier bonus bill comes here, and they have the record of voting away $25 million in a blackmail proposition” (Congressional Record, 67th Congress, 1st Session, p. 472). Senator George Norris from Nebraska, accepted that Roosevelt and the American government were at fault during the secession of Panama, but thought, “let the oil, rather than the Treasury of the United States, pay for the smiles we are trying to get” (Murphy Reference Murphy2013, p. 569). Senator William Borah from Idaho, after confessing to Arthur H. Vandenberg, editor of the Grand Rapids Herald, that “We must strike fast and strike hard for the lobbying behind this thing is simply stupendous,” prepared a roll call vote amending the treaty by absolving the United States for aiding Panama's secession, but this was defeated (Murphy Reference Murphy2013, p. 569). On 20 April 1921 the UTT was ratified.
Following ratification, Colombia awarded the pipeline concession to the Andian Corporation in 1923.Footnote 5 Andian's ownership was transferred to SONJ's subsidiary International Petroleum Company in 1925, centralizing production and transportation operations. The pipeline was completed in March 1926 and the first tanker set off to the United States on 3 July 1926. By 1928, Colombia was the world's eighth largest oil producer.Footnote 6 Between then and the end of SONJ's concession in 1951, the multinational controlled almost the totality of Colombian oil exports and production (Bucheli Reference Bucheli2008, p. 80). Colombia could not change the terms of the contract with SONJ after the UTT ratification. The $25 million was paid between 1923 and 1926, most of it after the 1923 Andian concession contract was awarded.Footnote 7 This assured that the deal the U.S. Senate voted for was completed before most money was paid.
THE URRUTIA-THOMSON TREATY VOTE AND THE OIL INTERESTS
The archival evidence suggests that SONJ formed a coalition of oil interests and influenced ratification of the UTT. We examine if this view is consistent with the quantitative evidence on the treaty roll call vote.
The President of the United States has the power to ratify an international treaty only after the Senate has advised and consented to do so. A treaty is considered by the Senate after the President or a senator request. In both cases, the request is channeled to the Senate's Foreign Relations Committee, which examines the proposal and decides whether to take a plenary vote. One round of plenary debate, a roll call vote, and two-thirds positive votes are required to pass the proposal (U.S. Senate Committee of Foreign Relations 2000, p. 20).
The 20 April 1921 UTT roll call was voted on by 88 senators, which required at least 59 senators to vote positively to pass the treaty, and in fact 69 voted to ratify it. Democrats, the Senate minority, supported ratification by 88 percent, while Republican majority by 72 percent.
Was this bipartisan majority influenced by SONJ and the oil interests? Senators most likely to be influenced were from states where SONJ had operations. SONJ operated in ten states, and all but two of those senators (who abstained) supported the treaty, 18 of the 59 votes necessary to pass the treaty.Footnote 8
The interest of other oil refiners was aligned with that of SONJ. Colombia's entry into the U.S. crude oil market was expected to make the supply more elastic, pressing equilibrium prices down. Since crude oil represented about 70 percent of the average unit cost of refined products and the industry was composed by regional oligopolies, oil refiners would reap substantial gains from crude oil price reductions and would not pass these to final consumer. (Olmstead and Rhode Reference Olmstead and Rhode1985; Hopkins Reference Hopkins1927; U.S. Census 1921, Vol. Manufactures, p. 762).
In principle, the cost structure and pricing behavior of refiners imply they would benefit from the treaty, while crude oil producers would lose via a drop in the output price. However, if there is a larger absolute level of profit to be made in refining, compared to the loss incurred in production, and if the firms producing crude oil and oil derivatives are integrated, it is possible that the conflict between crude oil producers and oil refiners may in fact be internalized to a large extent within firms. In this case the entire industry would support the treaty.
Although we are not aware of contemporary systematic data on vertical integration in the oil industry across states, significant examples do abound. For instance, most of the “baby standards” companies the Supreme Court of the United States created in the 1911 break-up of Standard Oil Holding Company are important and relevant examples of vertical integration (Hidy and Hidy Reference Hidy and Hidy1955). The major oil companies integrated production and refining. In 1941 majors integrated about 52 percent of U.S. production and 85 percent of refined products (U.S. Congress Reference Congress1941, p. 51).
The U.S. Census (1921, Vol. Mines, 28, Vol. Manufactures, p. 758) reports that 20 states produced crude oil, 25 refined oil, and a total of 29 produced or refined oil. Assuming the oil companies were successful in convincing their own senators to vote for ratification yields a total of 58 votes, one fewer than the minimum two-thirds necessary to ratify the treaty. In fact, 45 of the 53 senators from these states who participated in the UTT roll call did vote to support the treaty. A vertically integrated oil interest influenced many senators, but this is still not enough to explain ratification.
WHAT ELSE INFLUENCED SENATORS TO RATIFY THE TREATY?
We now examine the Senate vote in a more exhaustive manner and identify other influences on senators who ratified the UTT and develop an econometric approach.
Consider the 88 senators in the 67th U.S. Congress who voted on the UTT, i=1, … 88.Footnote 9 Each senator i decides to either support (vis =1) or to oppose it (vis =0). Senator i preferences are based on his ideology and the probability of reelection. In turn, the probability of reelection depends on his ability to convince his constituency that his votes follow their interests and special interest contributions to fund his political activities (Snyder Reference Snyder1991).
Assuming a senator's preferences follow a random utility model and a simple linear functional form, it is possible to use a linear probability model to estimate the following senatorial choice equation (Heckman and Snyder Reference Heckman and Snyder1997):

where ID is the ideology of senator i, CI is the state s constituency interest, SIP is the contribution to senator i made by the crude oil producer special interest in state s, and SIR is the contribution of the oil refiner special interest group.
Senator choice, vis , is measured with the UTT ratification vote data collected by ICSPR U.S. Congressional Historical Statistics. Senator ideology is complex and difficult to measure. We use the W-Nominate scores estimated by Keith Poole and Howard Rosenthal Reference Poole and Rosenthal1997) (updated on voteview.com) as a rough proxy to senator ideology. The W-Nominate score estimates the typical position of each senator on two dimensions of preference over government intervention using senators' votes during a given Congress. The first dimension score, W1i , measures the typical position of senator i on government intervention in economic issues. The second dimension score, W2i , measures the typical position of senator i on government intervention in social issues. Each dimension is defined between –1 and 1. The lower scores indicate preference for no intervention, while higher values indicate preference for intervention. Lower and higher score levels reflect senatorial consistent choice against or for government intervention, while score levels close to 0 may reflect ideological and non-ideological influences on voting patterns. We expect senators supporting government intervention to favor the UTT and therefore a positive coefficient associated to W1and W2.
Constituency interests, CIs, are measured by the contribution a single state s makes to financing the federal government. States that pay more federal taxes than they receive in federal expenditure should be more likely to oppose the use of federal taxes to pay reparation to a third and unrelated party like Colombia. Data on federal taxes and expenditure by state is available after 1922. The ranking of the state ratio of federal taxes over federal expenditure in 1922 is used to proxy constituency interests, CIs. We assume that the ranking of net federal taxes remained stable between 1920 and 1922.Footnote 10
The contribution of special interest groups to senator i is determined by the potential gains or losses of the group under the policy intervention considered. How much the oil interests expected to lose or gain once the UTT was passed determines the maximum contribution the oil interests were willing to make to senator i. For instance, crude oil producers should have expected to lose. The expected losses for crude oil producers are measured by the expected producer surplus and subsequent price drop with the entry of Colombia's crude oil onto the U.S. market. We cannot measure the expected producer surplus loss accurately, but it must have been roughly proportional to the value of crude of oil production in state s. Presumably, the larger the oil production in state s, the greater the expected loss and the higher the special interest investment to influence state s senators to oppose to the treaty. From the perspective of senator i, all other things being equal, the higher the share of crude oil production in the state s economy, the greater the likely contributions from oil producers relative to other special interests in the state and the more influence oil producers have on his vote, relative to his ideology and constituency interests. Thus, the share of crude oil production in the value of overall production in state s can be a proxy for the oil producers' special interests contributions, SIP.
Refiners expected to gain from the UTT since the price of their key input was expected to fall. Following a logic analogous to that approximating SIP, refiners' special interest contributions, SIR, use the share of crude oil consumption in refining in state s as a proxy. Data for crude oil producer and refiner special interests was drawn from the U.S. 1920 census. The definition and sources of all variables used in the econometric analysis and its descriptive statistics are included in Appendix Tables 1 and Appendix Tables 2.
The Influence of Oil Interests on Voting Patterns
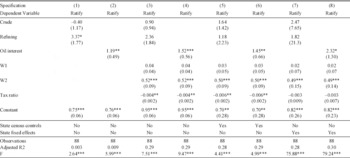
The baseline results of the econometric exercise are presented in Table 1. Model specifications in columns 1, 3, 5, and 7 are estimates of the influence of oil producers and refiners interests, separately, on voting patterns. Specifications in columns 2, 4, 6, and 8 are estimates of the influence of vertically integrated oil producers and refiners. Producers' and refiners' interests are summed up into one variable to proxy for vertically integrated oil interests. If the coefficients for the disintegrated value chain segments are statistically significant while that of the integrated oil interest is not, this is interpreted as evidence that vertical integration did not play a major role in explaining voting patterns. If a contrary pattern is observed, it is interpreted as evidence that vertical integration did play an important role in influencing senators' decisions.
Table 1 Influence of Oil Interests on UTT Voting Patterns
Significant at the 10 percent level.
Significant at the 5 percent level.
Significant at the 1 percent level.
Note:
See text and Online Appendix.Senators ratification decision regressed on interest group variables (Crude, Refining, Oil interest), ideology proxies (W1 and W2), and constituency interests (tax ratio). See Appendix Table 1 and Appendix Table 2 for variable definitions. State census controls include income per capita, illiteracy of ten years and older, share of rural population and share of black population. Linear probability model estimates, clustered robust errors are in parentheses.
Specification in column 1 presents the estimates for producers' and refiners' influence on voting patterns. The estimates for producers have the expected negative sign and for refiners the expected positive sign, but only the estimate for refiners is significant. Specification in column 2 presents the estimate for the influence of an integrated oil interest within each state. The estimate has the expected positive sign and is statistically significant at the 1 percent level. An estimate of 1.19 implies that a one standard deviation (0.0493) increase in the share of crude oil production and refining crude oil consumption in a state's economic activity leads to a 5.8 percent increase in the likelihood that a given senator voted to ratify the UTT.
Specifications in columns 3 and 4 include the influence of senators' position on government economic and social intervention and constituency interests on voting patterns. The estimates for the oil interest in these two models confirm the intuition that vertical integration may have helped to align the interests of oil producers and refiners. The estimate of a vertically integrated oil interest influence in specification 4 is positive and statistically significant, while the estimates for the vertically disintegrated oil value chain in specification in column 3 are not significant. The estimate of the influence of senators' position on government economic intervention (W1) on voting patterns is not significant, while the estimate for the influence of his position on government social intervention (W2) is positive, highly statistically significant and increases the adjusted R2 substantially. The estimate of the influence of constituency interests (tax ratio) is, as expected, negative and significant at 5 percent.
In specification in column 4, after inclusion of the senators' position on government economic and social intervention and constituency interests, the estimate of vertically integrated oil interest influence increases from 1.19 to 1.52. A one standard deviation increase in vertically integrated oil interests leads to an increase of 7.4 percent in the likelihood a given senator voted to ratify the treaty, while a one standard deviation increase favoring government intervention in social issues leads to a 22.7 percent increase in the likelihood the senator ratified the treaty. An increase in the tax ratio so that a state moves from being the 22nd net contributor to being the 10th highest net contributor (equivalent to a one standard deviation increase) leads to a 10 percent decline in the likelihood a given senator ratified the treaty.
Finally, specifications in columns 5–8 include state controls. The models confirm that producers and refiners did not exert opposing influence on the senators; more likely vertically integrated oil interests within each state influenced the senators' votes. The effect of the influence of the vertically integrated oil interest is robust to inclusion of state census controls and state fixed effects. The effect of the influence of senators' position on government social intervention on voting patterns is also robust to inclusion of state controls. The influence of constituency interests is robust to state census controls but not to state fixed effects, possibly a consequence of collinearity.Footnote 11
Vote Buying and the Urrutia-Thomson Treaty Vote Outcome
The baseline specification in Table 1 represents a simple model. An important influence on senatorial voting patterns that also deserves attention is plausible vote buying. James Snyder (Reference Snyder1991) suggests that a special interest group will focus on buying the votes of legislators who are slightly opposed to the proposed law, rather than the votes of legislators who strongly support or oppose the law.
Recall that for the W-Nominate score the lower and higher score levels reflect senatorial consistent choice against or for government intervention. The range of scores close to 0, the center point on each dimension, indicate a senator vote is against and for government intervention roughly as frequently. Senators may behave this way for different reasons. For instance, legislators may be truly indifferent to government intervention and decide on a case by case basis; or senators may prioritize their re-election probability in their utility function, and sell their vote and follow different special interest groups and different positions on different votes. However, even if a W-Nominate score close to 0 does not allow inferring directly the ideological or non-ideological influences over a senator's voting pattern, the score does help to identify senators who swing from one position in one roll call vote to another position in another vote. Following Snyder's conclusion, senators with W score close to 0 represent targets for special interest groups to induce them to sell their vote.
We use the typical position of a senator on government intervention in social issues and construct a dummy variable to identify senators who showed no consistent voting patterns. Since the W2 score ranges from –1 to 1, the dummy variable identifies senators whose absolute value of the W2i score is within the top 50th percentile closest to 0 (Indifferent), the central point of the W2 dimension, indicating senator i choice was not consistent, was against and for government intervention roughly as frequently. Senators with W2i score defined as indifferent presumably face lower utility losses from changing their position, signal their willingness to change their position more frequently, and their votes will be in high demand by special interest groups.
Additionally, we use electoral competition data to construct an alternative indicator of plausible vote buying that does not rely on voting behavior during the 67th Congress. The vote percentage margin between the elected senator and the second runner up is measured by the variable Margin. Senators facing a higher margin and lower electoral competition find it less costly to deviate from their constituency interests, their votes are cheaper to buy and will be in high demand.
In Table 2 the baseline model in Table 1 specification in column 4 is expanded to include the effects of vote buying. The first result to highlight is that across the three first specifications in Table 2 the baseline model estimates for oil interests, senators' position on government intervention in social issues, and tax ratio remain qualitatively identical and robust to model specification changes associated with plausible vote buying.
Table 2 Influence of Plausible Vote Buying on UTT Voting Patterns

Significant at the 10 percent level.
Significant at the 5 percent level.
Significant at the 1 percent level.
Note:
Senators ratification decision regressed on interest group variables (Crude, Refining, Oil interest), ideology proxies (W1, W2), constituency interests (tax ratio) and plausible vote buying variables (Indifferent, Margin). See Appendix Table 1 and Appendix Table 2 for variable definitions. Linear probability model estimates, clustered robust errors are in parentheses.
Now focusing on vote buying, in specification in column 1 the baseline model includes the dummy variable for indifferent senators. The estimate for the Indifferent variable is statistically significant at the 5 percent level and positive, with an indifferent senator 17 percent more likely to ratify the treaty. The estimate is statistically significant even if the definition of Indifferent is narrowed down to those senators with absolute value W2i scores within the top 33th percentile closest to 0.
In column 2 the baseline model now includes the electoral competition measure. The Margin variable is not statistically significant and is negative, against prior expectation. To explore further this counterintuitive result, in column 3 we also include the Indifferent variable and the interaction term Indifferent Margin. We find a differential effect between indifferent and non-indifferent senators.
The estimate of Margin now captures the effect of electoral competition for non-indifferent senators. It is negative and statistically significant. The average non-indifferent senator won his last election with a 29 percent margin and was (0.33*0.29) 9.5 percent more likely to vote against. This result is in line with the intuition that incumbents tend to face lower electoral competition, and non-indifferent senators like progressive incumbents, strongly opposed the UTT. An unreported regression using tenure instead of Margin confirms this intuition.
The estimates of Indifferent and Indifferent*Margin capture the effect of electoral competition for indifferent senators. The average indifferent senator won his last election by a 26 percent margin, a similar margin to the average non-indifferent senator. The effect is the estimate on Indifferent (0.04) plus the estimate for Indifferent*Margin (0.44*0.26=0.11). The average indifferent senator faced relatively low electoral competition and was 15 percent more likely to ratify the treaty. Additionally, the joint F test for Indifferent and Indifferent*Margin indicates we cannot reject that the two estimates are different than 0 and an alternative regression using Indifferent*(Margin-0.26) instead of Indifferent and Indifferent*Margin indicates the estimate on this new variable is statistically significant at 1 percent and positive.
Low electoral competition “freed” senators to vote following different influences. For senators who were willing switch their position from one roll call to another, as electoral competition declined, it was less costly for them to plausibly sell their vote. For senators who voted consistently from one roll call to another, as competition declined, it was less costly for them to follow their views on government intervention in social issues.
Table 2 also includes two robustness tests. First, Senate also voted and rejected an alternative text for the Treaty. The only difference with the text finally ratified was that the value of reparation went down from $25 to $15 million. We expect this vote tested the strength of the coalition to ratify the Treaty. Certainly this bill should have been preferable to all American parties: the same effects in the crude oil market would be obtained at a lower fiscal cost. Only Colombia would lose if this alternative text was ratified. In column 4 the estimates of the influence of Oil interests and W2 are statistically significant and change sign to negative; the F test indicates the joint hypothesis that Oil interests, W2, and Indifferent are equal to 0 can be rejected. Thus, the coalition that ratified the Treaty was a strong one, not easy to break-up, and acted to oppose the alternative Treaty text. It preferred to favor Colombia than American taxpayers.
Second, in a placebo test, when we use the same set of independent variables that explain the UTT vote to explain an entirely different Senate vote, the estimates of these variables should not be significant. Variables not significant in the baseline model may be significant and contribute importantly to explanatory power. This test can help to rule out the possibility that the coalition that ratified the UTT was in fact an extension of a broader coalition based over a larger set of issues and roll call votes during the 67th Congress. Less than 10 percent of all roll calls voted during the 67th Congress were performed by at least the same 88 senators and six of these were foreign treaties. Column 5 presents results for the roll call vote to sign peace with Germany. The individual estimates of oil interest, W2, and Indifferent are not significant and the F tests for whether these three estimates are different from 0 is also not significant. The three variables representing the coalition that passed the UTT treaty were unlikely to influence the vote on peace with Germany. Similar results are observed for the other five foreign treaties. Thus, it is unlikely the coalition that passed the UTT represented a broad coalition over the 67th Congress.
Table 3 summarizes the econometric evidence on the oil coalition. Lines 1 and 2 indicate that 88 senators participated in the roll call vote and 69 voted to ratify the UTT. The figures in lines 3 to 7 of the table are the number of predicted votes supporting ratification, assuming that when the probability that senator i votes yes is 0.5 or higher he should have voted to ratify—the standard assumption in constructing classification tables for binary data models. Line 3 indicates the model in Table 2 specification in column 1 predicts that 70 senators should have voted to ratify the UTT, on the basis of their position in W1 and W2 alone—the estimated coefficient on W1 times the score of senator i on W1 plus the estimated coefficient on W2 times the score of senator i on W2 is higher than 0.5 for 70 senators. For specification in column 2 it is 73 senators. Thus, if the UTT decision had been based solely on the senators positions in W1 and W2, the models suggest it should have been ratified because the predicted positive votes were higher than 59.
Table 3 Number of Senators That Voted and Predicted to Ratify UTT

Note:
Model specification 1 and 2 correspond to model specification 1 and 3 in Table 2, respectively. Models were re-estimated using re-scaled variable values to fit 0-1 interval and produce predicted values in 0-1 interval. W1 + W2 predicts yes is the number of senators for which the sum of predicted probability (coefficient estimate W1*W1i + coefficient estimate W2*W2i ) is higher than 0.5. W1 + W2 + Tax ratio predicts yes is the number of senators for which the sum of the predicted probability (coefficient estimate W1*W1i + coefficient estimate W2*W2i + coefficient estimate tax ratio*tax ratioi + coefficient estimate margin*Margini ) is higher than 0.5. W1 + W2 + Tax + Oil influence is the number of senators for which the sum of predicted probability of the full model (excluding constant) is higher than 0.5. Oil influence is the sum of predicted probability by estimates of oil interest and vote buying, either indifferent or indifferent plus indifferent*margin. A senator was assumed to vote yes if predicted probability was 0.5 or higher, as it is customary to develop classification tables for binary outcome econometric models.
Sources: See Appendix Table 1.
Line 4 indicates the simultaneous influence of W1 and W2, and tax considerations on voting patterns. Model specification in column 1 predicts that 55 senators should have voted to ratify, while column 2, also including the negative effect of the Margin estimate, predicts 58. Once the negative influence of a state's federal taxes contributions and Roosevelt's legacy on a senators' voting preference is considered, W1 and W2 should not have been enough to pass the UTT.
Line 5 includes the simultaneous effects on voting patterns of W1 and W2, tax considerations, and the oil interest. Model specification in column 1 predicts that 68 senators should have voted positively, while specifications in column 2 69.Footnote 12 The predictions suggest the oil special interest influenced between 13 and 11 senators to take the coalition from 55 to 68 in column 1 and from 58 to 69 in column 2.
Another way to see the importance of the oil lobby on the final result of the UTT roll call is to examine how many senators should have opposed it on ideological grounds and how many of these senators are predicted to have changed their position once the oil special interest is considered. Line 6 indicates the number of senators predicted to have opposed the UTT exclusively on their position against government intervention on social issues should have been between 18 and 15. However, line 7 suggests that once the effect of the oil lobby is considered, about three of these senators should have voted positively.Footnote 13
Overall, Table 2 models suggest that although ideology on its own certainly mobilized a large group of senators, it was unlikely to have been sufficient to ratify the UTT once we account for the influence of fiscal cost and Roosevelt's legacy on senatorial voting patterns. The oil special interest and its plausible vote buying strategy mobilized a substantial group of senators that likely took the coalition to a size over the minimum size to pass the UTT. Ideology and the oil coalition were necessary and sufficient complements to ratify the UTT.
WELFARE EFFECTS OF THE URRUTIA-THOMSON TREATY
The archival and econometric evidence examined in the preceding sections documents robust evidence of the influence of oil interests on the treaty's ratification. Now we document the effects the treaty had on the American economy.
SONJ Profits
SONJ's benefits from the UTT ratification may be measured by the additional profits attributed to the exploitation of Colombian oil. These profits, all other things being equal, are derived from extracting, transporting, and refining Colombian oil and from lower prices on all non-Colombian barrels of oil produced and refined. To establish the magnitude of additional profits it is necessary to know the cost structure and prices within the vertical supply chain, all indirectly owned by SONJ, but this information is not available. An alternative is to identify a lower bound of additional profits and assume that TROCO's and Andian's profits reflect SONJ's additional profit. In order to estimate these benefits, we calculate the net present value (NPV) of TROCO's and Andian's operations.
Ideally one would like to know the flows of capital investments and net income for both TROCO and Andian to calculate the NPV. Conventional sources for this information are the annual financial reports of each company. These reports are available only for 1936–1938.
The information in these reports indicates that average capital stock in 1936–1938 was $42.1 million for TROCO and $19.3 million for Andian.Footnote 14 Given the short period covered by the financial reports, we also examined print media, which reported that capital subscribed by TROCO in 1920 was $39 million, presumably to invest in building production equipment and a refining plant. Andian issued $15 million in bond debt to finance pipeline construction in 1924–1926, while its subscribed capital was $1 million. Thus, capital stock in the annual reports and the press seem to be roughly in line.Footnote 15
The available annual financial reports indicate average annual net earnings of $2 million for TROCO, $7.3 million for Andian.Footnote 16 Operational net income flows are constructed by using production statistics and a fixed dollar profit per barrel produced or transported. TROCO's operational net earnings are estimated as barrels produced per year times the dollar amount of profit per barrel produced. The quantity of barrels produced and transported is calculated with production and export statistics published by the Colombian government. The profit per barrel produced is 10 cents, calculated as the average profit per year, 1936–1938, divided by the average number of barrels produced. Andian's operational net earnings are estimated as barrels exported per year times dollar amount of profits per barrel exported. The profit per barrel transported is 43 cents, the average net profit per year, 1936–1938, divided by the average number of barrels transported.
TROCO's operational net earnings are probably slightly underestimated. Since more than 90 percent of its production was exported, assuming that extraction costs are stable over time, net earnings depend on the international price. The international prices were $1.13 per barrel in 1936–1938, slightly below the 1921–1951 period's average of $1.25. Andian's net earnings are roughly accurate as transportation services experienced stable costs during the period.Footnote 17
Using the capital investment in annual reports as an initial fixed capital cost, the estimated net earnings flows, and a Dow Jones average annual return of 5.6 percent to proxy the discount rate, the NPV for TROCO is –$25.1 million, for Andian it is $78.2 million, and for SONJ it is $53.1 million. Even if the project had been perceived to be 40 percent more risky than investment in stocks (increasing the discount rate from 5.6 to 8 percent) the project would still have been expected to be profitable.
SONJ's NPV indicates that ratification of the UTT resulted in an implicit subsidy that was smaller than SONJ's accrued profits. The U.S. Senate could have requested that SONJ pay voluntary taxes to compensate for the reparations paid by the United States in 1921.
Winners and Losers
The ratification of the UTT, all other things being equal, facilitated SONJ crude oil production in Colombia and led to an increase in supply and a reduction in the equilibrium price for crude oil. In turn, the price decline should have allowed American refiners to save on crude oil input costs.
To calculate how much American refiners saved, we follow a conventional social savings approach. The intuition is that had Colombia not exported crude petroleum to the United States, the crude price should have been higher. How much higher depends on the price elasticity of demand. We use a range of plausible price elasticities of demand to estimate the expenditure saved by refiners, comparing a scenario where the United States imported Colombia's oil with another where it did not.
The social savings approach is a conventional tool used by economic historians to estimate the partial equilibrium welfare effects derived from the introduction of a product into a market (Fogel Reference Fogel1964; Fishlow Reference Fishlow1965). The main advantage of this approach is its simplicity and small data requirements. However, the approach focuses on demand and assumes an inelastic supply with few, if any, alternative producers entering the market had Colombia's crude oil not been imported into the United States. In this case, the use of the social savings approach is appropriate only after some simple but important institutional considerations are included in the set-up of the exercise.
First, the U.S. crude oil market was segmented between the Pacific and the eastern and central markets. Crude oil production was located in large quantities in only a few states (Pennsylvania and West Virginia in the east; Louisiana, Texas, Oklahoma, Indiana, and Illinois in the central region; and California in the west) and this created regionally separate markets. By 1920, railroads and pipelines provided the necessary transport infrastructure to facilitate intermediation between regional market segments in the east and the central United States. And once the Panama Canal was fully open in 1920, crude oil trade between the Pacific coast and the eastern and central United States became easier. Price convergence was achieved in the 1930s (Bain Reference Bain1945; Maurer and Yu Reference Maurer and Yu2010, pp. 179–83; Libecap Reference Libecap1989, p. 835). Thus, we can think of the American crude oil market as a segmented market for most of the period of analysis, with Colombian oil flowing into the eastern and central segment of the market.
Second, in the 1920s, when the UTT was ratified, the eastern and central crude oil market was not only integrated but production operated in a highly competitive manner. Independently of whether a producer was part of a major oil company or an independent, both extracted oil from a specific oil field as fast as possible to reduce the negative effects of competition when exploiting a common pool resource. This market structure dominated the crude oil market until 1933, when it became a cartel (Libecap Reference Libecap1989). Once the crude oil cartel began effective operation, import controls were set up in the United States. In turn, the share of Colombian crude oil exports to the United States declined from an average of 72 percent in 1926–1933 to 26 percent in 1934 and never recovered. Thus, we focus our analysis on the social savings up to 1933.
The calculation of social savings assumes a range of price elasticity of demand between relatively inelastic 0.5 and relatively elastic 5. The U.S. mean imports of Colombia's crude oil over 1926–1933 were 11.9 million barrels per annum (see Table 4 line 1). The eastern and central U.S. mean crude oil consumption was 699 million barrels per annum. Colombia's oil mean market share was 1.72 percent. The Oklahoma crude oil price was used by the U.S. Bureau of Mines as the reference for the eastern and central U.S. market segment (U.S. Bureau of Mines, various years). The mean real Oklahoma price was $1.52 per barrel. The mean price increase had Colombia's oil not reached the eastern and central U.S. market segment ranges from 0.055 to 0.006 dollars per barrel, which implies that crude oil consumers in this market saved an annual mean expense ranging from $37 million per annum to $3.7 million. The NPV of total social savings, 1926–1933, ranges from $243 million if the price elasticity of demand was 0.5, to $24 million if the price elasticity was 5.0 (see line 8). If the price elasticity of demand was lower than 4.9, the social savings should have been higher than the $25 million in reparation the United States paid Colombia after ratification of the UTT.
Table 4 Social Savings for the United States Resulting From UTT

Note:
Lines (1) to (6) are average value 1926–1933.
Sources: (1) 1926–1928 from U.S. Department of Commerce (1930), 1928–1933 from U.S. Bureau of Statistics (various years), and U.S. Bureau of Mines (various years). (2) U.S. total crude oil runs to stills minus California 1926–1930 from American Petroleum Institute (various years), 1931–1933 from U.S. Bureau of Mines (various years). (3) = (1)/(2). (4) Oklahoma crude petroleum real price from U.S. Bureau of Mines (various years) and PPI; Annual social savings: ∆P*CC with ∆P the East and central U.S. crude oil price change due to Colombia's oil exclusion and CC the east and central U.S. crude oil consumption. (5) = (1/price elasticity of demand)*(CM/CC) = (1/ price elasticity of demand)*(3). (6) = ∆P = (1/elasticity of demand)*(CM/CC)*P: (5)*(4). (7) ∆P*CC = (6)*(2). (8) = Net Present Value of flow of social savings (7) 1926–1933. (9) Net Present Value of flow of social savings (7) 1926–1933 using West Texas crude price instead of Oklahoma price.
To examine how sensitive this result is, the West Texas price, that was about one-third lower, is used instead. A lower crude price renders smaller social savings, ranging from $149 to $14 million (see line 9). If the elasticity was lower than 2.9, reparations should have been smaller than social savings. In sum, as long as the price elasticity of demand was lower than about 3, the total social savings of eastern and central U.S. refiners from the flow of Colombian oil should have been higher than the reparations the United States paid to Colombia after ratification of the UTT.
Finally, the distribution of social savings within America is an important issue. We compare crude oil and oil derivatives prices and provide a rough indication of the distribution of the gains to the United States derived from the effects of the treaty.
The oil refining industry was a concentrated oligopoly operated by the oil majors. Thus, it is not possible to use only the market price of crude oil, fuel oil, and gasoline to estimate the precise distribution of benefits. Cost, productivity series, and behavioural assumptions, in addition to price series, are required. This information is not available.
However, we can develop a refining derivatives aggregate price index that we can compare to the Oklahoma crude price index and John Kendrick's sectoral productivity statistics and infer a preliminary view on the distribution of social savings. Figure 1 presents an output weighted price index (1926=100) for refining derivatives composed of gasoline, fuel oil, and kerosene and an index for the Oklahoma crude oil price. Three main trends are worth highlighting. First, the figure indicates that crude oil price plunged between 1926 and 1928. Colombia's petroleum contributed to this decline, with a market share of more than 2 percent in the eastern and central U.S. crude oil market segment. The price stabilized at about 50 percent of the 1926 value. The derivatives price index during the same period also declined, but only to 80 percent of the 1926 level. The refining industry captured most of the benefits the United States derived from the price decline induced by Colombia's crude oil.
Second, for the relevant social savings period, 1926–1933, the average crude oil price index was 56 and derivatives price index was 98. Thus, oil refiners saved approximately one-half of their crude oil expenses and did not pass along any of these savings to oil derivatives consumers, maintaining the consumer surplus unchanged.
Third, the figure shows that after 1933 prices tend to decline slowly for both crude oil and refining derivatives. At first glimpse, one may infer that final consumers benefited from declining prices for crude oil and refined products. But productivity was growing faster than output prices were declining. Between 1929 and 1937 crude oil production experienced an 85 percent total factor productivity growth, while the refining industry experienced a 25 percent total factor productivity growth (Kendrick Reference Kendrick1961, pp. 400, 448). Productivity data suggests that the producer surplus of refiners grew because crude oil prices dropped and productivity grew, while for crude oil suppliers the producer surplus grew because productivity was growing faster than the crude oil price declining.
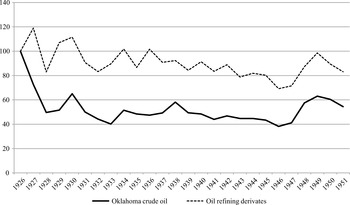
Figure 1 Index Numbers for Crude Oil and Oil Refining Derivatives Prices (1926=100)
In sum, the oil derivative consumer lost due to the introduction of the treaty. The consumer's surplus did not increase, but she/he paid the taxes used to pay for Colombia's reparation. Indirectly, the oil derivative consumer subsidized the oil refiners. Oil derivative consumers were individuals and also firms; and both also paid the taxes. In fact, by 1921, about 70 percent of federal taxes came from firms' income and profits. Refiners, including SONJ, captured important savings in crude oil input expenses; the producer surplus increase was larger than the reparations paid to Colombia. Crude oil producers compensated their losses with fast productivity growth. Overall, the United States won; but the refiners captured most gains while individuals and non-oil firms were most likely less well off.
CONCLUSION
The use of power in the allocation of international trade is an important issue. In this article we examine an event that provides a rare window to explore the influence of special interests on an empire's power and informal colonial policy in the context of informal commercial imperialism under democratic rule.
The relations between Colombia and the United States strained for a decade after the former supported the secession of Panama in 1903. A confluence of events that included the discovery of oil in Colombia, the global competition for oil by economic empires, and SONJ's need to find sources of crude abroad brought new issues to the negotiations for reparations and created a new bargaining setting. In 1913 SONJ used the potential for reparations to win a concession on Colombian oil over competing British investors. In 1921 Colombia used the $39 million of SONJ's sunk investments in its territory and future access to Colombia's oil reserves to hold up SONJ and induce the firm to represent Colombian interests in the empire. This led SONJ to lobby the U.S. Senate and organize a supermajority coalition. A large group of senators representing oil producing and refining states, senators who were indifferent to the treaty vote or faced little political competition, and senators favoring government intervention in social issues, all joined SONJ to ratify the treaty. As a result, Colombia reduced by $25 million the net transfer of resources to the empire resulting from the loss of Panama, SONJ and other refiners gained substantial profits (even higher than the $25 million implicit American subsidy), and the United States won on aggregate. However, the average American refining derivative consumer and taxpayer individual and non-oil firm was probably less well-off after the UTT.
Our results contribute to the literature on commercial imperialism. First, we develop a methodology to provide the first quantitative evidence for Maurer's (2013) empire trap hypothesis. Clearly, we find that an Olson (Reference Olson1965) type of mechanism that sorted out distributional struggles over the benefits and costs of imperial actions was in place and the outcome was unequal distribution—the refiners gained at the expense of the final consumers and the tax payers. However, we also find that an Olson type mechanism may need the support of ideology to coordinate collective action and that the empire trap politics may not necessarily imply a net welfare loss for the empire. We hope our methodology can serve as a model for other studies testing or advancing the empire trap hypothesis for other countries or industries.
Second, the case shows that an informal colony can hold up a special interest's multinational and induce the special interest to take action within the empire's political process to represent the informal colony interests. By following this strategy, a country victim of an imperialist action managed to reduce the losses. This finding highlights that informal colonies may have more leverage in their relation with the empire than previously acknowledged and that special interests have a choice when their multinational faces informal colony hold-up. Sometimes the special interest might prefer to ask the imperial government to repress or control the colonial government through the exercise of political or military power, while at other times, as in the present case, the special interest might prefer to push for the colony's interests within the empire. The determinants and analysis of the special interest's decision to either side with the colony or ask the empire to repress it is an important topic for future further research.
Third, the case also highlights that negative and positive imperial actions are frequently connected. Imperial invasions, coups, and threats should be studied in connection with previous and future reparations and aid. In Colombia the threat of military action leading to Panama's secession was followed, after almost two decades, by $25 million in reparations, while in the case of Iran, American economic aid increased from $11 million to almost $600 million after the 1951 coup. In Guatemala, American economic aid increased from $1.4 million to more than $70 million after the 1954 coup, and American economic aid to Chile increased from $3.8 million to more than $95 million after the 1973 coup (USAID 2015). These decisions represent different possible imperial behaviors and are influenced by previous colonial government and imperial actions, relationship outcomes, and the global context. The process can be thought of as a dynamic bargaining process between the empire and the informal colony. The determinants of the magnitude, timing, and combination of imperial military and reparation/aid actions are another important topic for future further research.
Appendix
Appendix Table 1 Data Definitions and Sources

Appendix Table 2 Descriptive Statistics


