
INTRODUCTION
Are Taiwanese voters polarized? Since the island began democratizing in 1987, concerns about the political polarization of its voters have loomed over the first democracy in East Asia (e.g. Fu and Chu Reference Fu and Yun-Han1996).When voters are highly polarized along a single ideological dimension, politicians and political elites will find it harder to compromise and are motivated to take extreme positions, which will hinder democracy over the long run.
However, these analyses have not produced consensus on whether Taiwanese voters are polarized. On the one hand, studies tracing feeling thermometer scores for parties (Hsiao Reference Hsiao2014), 0–10 unification–independence scale scores (Sheng and Liao Reference Sheng, Liao, Achen and Wang2017), feelings toward candidates (Lin and Chu Reference Lin and Chu2008), perceived economic performance (Huang Reference Huang2011), and national identity (Fu and Chu Reference Fu and Yun-Han1996) suggest that pan-blue and pan-green voters are polarized. Hsiao (Reference Hsiao2014) analyzes surveys conducted as part of Taiwan's Election and Democratization Study from 1996 to 2012 and finds that Taiwanese partisans exhibit increasingly negative correlations in their feelings toward the two major parties. Specifically, both Hsiao (Reference Hsiao2014) and Sheng and Liao (Reference Sheng, Liao, Achen and Wang2017) find that the level of polarization has increased since the first presidential turnover in 2000.
These analyses suffer from “polarized choice sets, not voters,” a problem identified by Fiorina and Abrams (Reference Fiorina and Abrams2008). Debating with Abramowitz (Reference Abramowitz2010) over whether the American voters are polarized, Fiorina and Abrams insist that researchers should focus on the (change in the) overall distribution of voters’ ideological stances, not just on partisans and politicians. When Taiwanese respondents are given more options, such as conditional independence (Hsieh and Niou Reference Hsieh and Niou2005), dual identity (Chang and Wang Reference Chang and Wang2005) or maintaining the status quo (Rigger Reference Rigger1999), public opinion converges. Unfortunately, these studies were completed over 10 years ago, long before the second presidential turnover in 2008.
By analyzing data from the Taiwan National Security Survey (TNSS) from 2002 to 2017, I show that the ideological distribution of Taiwanese voters is very stable and is described by an inverted U shape—that is, that preferences with respect to cross-Strait relations, a defining issue in Taiwan politics, are normally distributed. Partisan polarization shows a different pattern, changing over time with movements into and out of the two camps. This article exploits 11 items on cross-strait issues that were asked in all TNSS waves over 16 years to create a cross-year ideological distribution. The main cross-strait factor extracted from the 11 items provides enough variation to capture differences and changes among Taiwanese partisans and nonpartisans over time: when many ideologically moderate voters joined the pan-blue camp during the period from 2004 to 2012, the level of polarization between pan-blue and pan-green supporters decreased. However, when these moderate voters left the pan-blue camp after 2012, the level of polarization between the partisans increased. When the number of nonpartisans in Taiwan reached a record high of 51 percent in 2017, the level of polarization between partisans also reached its highest point in history.
This article makes several contributions to our understanding of political behavior and Taiwanese politics. First, this article highlights the importance of taking the number of nonpartisans into account when analyzing polarization. Even in the US, the proportion of nonpartisans has increased sharply, and people are motivated to self-identify as nonpartisan (Klar and Krupnikov Reference Klar and Krupnikov2016). A change in self-reported party identification would influence our understanding of political polarization over time.
Second, the theory and evidence presented in this article reconciles contradictory claims of previous studies of political polarization among Taiwanese voters. While there is little evidence of polarization among all voters when non-partisans are included, I also show how polarization among partisans does change over time. This article not only replicates earlier findings that polarization increased between 2002 and 2005 but also updates the existing literature on decreasing polarization between 2005 and 2012 and reemerging polarization between 2012 and 2017.
Third, this article provides four clear and informative visualizations of 16 years of TNSS data, which may help researchers and readers better understand the structure of and changes in Taiwanese politics.
DEFINING POLARIZATION
One key factor in the debate of political polarization is the definition of polarization itself. Fiorina and Abrams (Reference Fiorina and Abrams2008) argue that a bimodal distribution on a single issue dimension should be at least a necessary condition for defining polarization; there should be two modes. Researchers may find it hard to define the level of polarization by the closeness of the two modes; however, if the distance between the two modes are increasing, we should have much more confidence to claim that the overall distribution is polarizing. Following these theoretical debates, the argument that “Taiwan voters are polarized” can be measured in several ways, each of which is explored here.
First, if Taiwanese voters are becoming polarized in general, we should also observe a bimodal distribution along with at least one issue dimension. Moreover, we should see the two modes exhibiting greater distance from one another over time. In contrast, if the overall distribution of Taiwanese voters is still a stable inverted U-shape, we can hardly argue that all Taiwanese voters are becoming polarized.
Second, it could be that it is partisans, rather than all voters, that are becoming more polarized over time. If the overlap between the distributions of pan-green and pan-blue supporters on issues is getting smaller, then we can argue that the two political camps find it harder to agree with one another on anything. In such a scenario, we could argue that the Taiwanese voters with party identifications are polarized, while the non-partisans are not.
Third, the two parts above could co-exist and even speak to each other in the context of unstable partisanship. When partisans are polarized, moderate partisans may leave either or both parties, which in return will make the distribution of partisans much more polarized. Meanwhile, if the moderate non-partisans find one of the two major camps attractive and join it, then the distribution of the partisans will move toward the center. In the following section, evidence shows that this is what happened in Taiwan.
DATA
The TNSS was designed and sponsored by the Program in Asian Security Studies at Duke University.Footnote 1 The survey has been conducted 10 times, in 2002, 2004, 2005, 2008, 2011, 2012, 2014, 2015, 2016, and 2017. All waves were conducted by National Chengchi University in Taiwan through telephone survey with post-stratification weighting.
Eleven items have been asked in all survey waves; these are shown in Table 1. Q1 and Q2 concern the economic relationship between Taiwan and China; Q3, Q4, Q5, and Q6 concern conditional preferences; Q7, Q8, and Q9 concern war attitudes and perceptions; and Q10 and Q11 capture overall unification–independence attitude and self-reported national identity. These 11 items include questions that have been used in previous studies of political polarization in Taiwan (e.g., Chang and Wang Reference Chang and Wang2005; Hsieh and Niou Reference Hsieh and Niou2005; Rigger Reference Rigger1999). The coding method is shown on the second column of Table 1. All non-responses are coded as zero.Footnote 2
TABLE 1 Cross-strait-related items in the TNSS used for factor analysis (n = 11660)

The issue of unification–independence is deemed an important—perhaps the most important—issue cleavage on Taiwan, and the 11 items can capture this major cleavage and examine the level of polarization in Taiwan's political context. Besides, since the distribution of Taiwanese/Chinese identity has changed dramatically in Taiwan, Chang and Wang (2005) and Wang (Reference Wang2017) suggest that self-reported national identity in Taiwan should be treated as an attitude but not an (assumed) long-term psychological attachment. The responses to these 11 items recorded across 16 years should provide enough variation for researchers to detect polarization or the disappearing center among Taiwanese voters, as suggested by Fiorina and Abrams (Reference Fiorina and Abrams2008) and Abramowitz (Reference Abramowitz2010).
Taiwanese Voters’ Positions on The Cross-Strait Relationship
All 10 waves of the TNSS were pooled, and factor analysis was used to extract the main factor from the 11 items by means of the principal function in the psych package in R. The number of factors is set to one since all previous studies suggest that there is only one salient ideological dimension—unification–independence—in Taiwanese politics (Achen and Wang Reference Achen and Wang2017; Hsiao Reference Hsiao2014; Lin and Chu Reference Lin and Chu2008). A second dimension exists statistically, but it may not be predictive of votes. Although issues of social justice and left–right orientation were part of the campaign agenda of the Democratic Progressive Party (DPP) in 2012, Achen and Wang (Reference Wang2017, Chapter 12) show that Taiwanese voters’ attitudes toward social justice were dominated by partisanship and cross-strait position.
The loading of each item on the primary factor is shown in column 3 of Table 1. All items except Q1 play an essential role in the primary factor. The result suggests that Taiwanese voters’ attitudes toward cross-strait issues are highly constructed; people consider all aspects of China–Taiwan interactions (except for personal economic affairs) in evaluating the future of the cross-strait relationship. Overall, the primary factor explains about 30 percent of the variance, and the test shows that one factor is sufficient. (The second factor explains only 5 percent more of the total variance.)
All respondents across the 10 TNSS waves are assigned a score calculated by the primary factor that ranges from -4 to + 4. Respondents with higher scores have attitudes closer to full independence, and negative scores indicate support for unification with China. Since the 10 items are asked in all survey waves, the respondents’ scores can be compared across waves. Therefore, we can not only investigate whether the position distribution in each year is U shaped but also trace changes in the distribution over 16 years. Moreover, we can estimate the polarization of pan-green and pan-blue supporters over time.
Party Support/Identification
At the end of each TNSS wave, all respondents are asked, “Which of the following parties do you prefer?” Respondents who answered Kuomintang (KMT), People First Party (PFP), or New Party (NP) are coded as pan-blue supporters. Respondents who answered DPP, Taiwan Solidarity Union (TSU), or New Power Party (NPP) are coded as pan-green supporters. All other respondents are coded as nonpartisans.
RESULT
Partisan Gap Widens but The Level Changes Over Time
All respondents are categorized as pan-green supporters, pan-blue supporters, or nonpartisans. Figure 1 shows the cross-strait scores of these three groups over 16 years. The points indicate the mean value of each group, and the error bars indicate the 95 percent confidence intervals of the mean values.
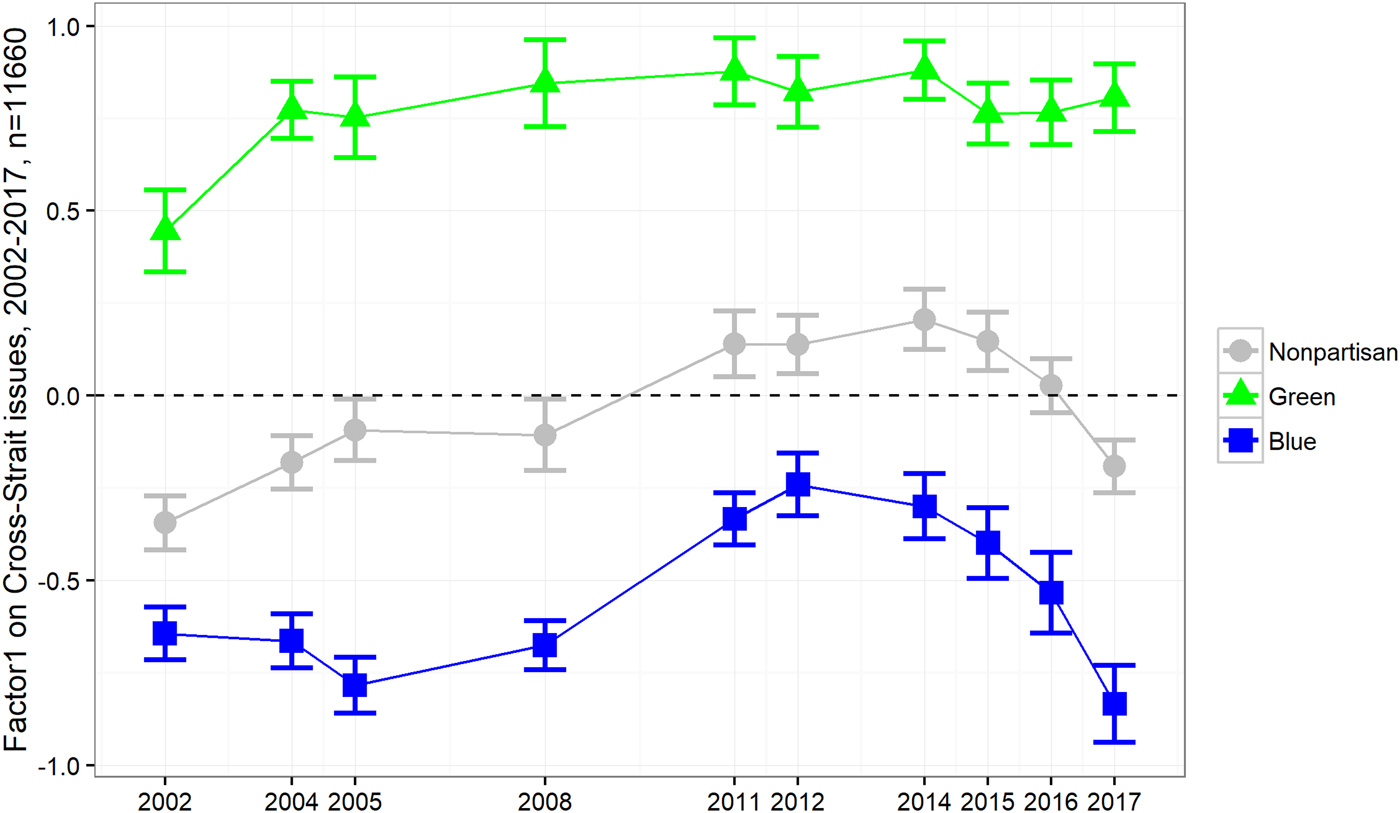
FIGURE 1 Cross-strait scores of pan-blue supporters, pan-green supporters, and nonpartisans, 2002–2017
There are three important findings in Figure 1. First, the level of polarization increased during the Chen Shui-bian era (2000–2008) but decreased during Ma Ying-jeou's first term (2008–2014). Previous studies focusing on this period have also observed this trend using other more straightforward measures (Huang Reference Huang2011; Hsiao Reference Hsiao2014; Sheng and Liao Reference Sheng, Liao, Achen and Wang2017). The consistent pattern supports the factor analysis conducted in this article.
Second, Figure 1 provides the first academic evidence of an increase in polarization in Taiwanese politics after 2014. Both pan-blue and pan-green supporters became more extreme in their positions, with the pan-blue supporters contributing most of the increase in polarization. In 2017, the mean values of pan-green and pan-blue supporters were 0.806 and -0.834, respectively (a 1.640 difference). By comparison, the respective pan-green and pan-blue mean values were 0.821 and -0.241 in 2012 (a 1.062 difference) and 0.446 and -0.643 in 2002 (a 1.089 difference).
Third, while the views of nonpartisans cluster between the two parties, there are changes among Taiwanese nonpartisans over time; as we will see, these matter for the overall distribution of voters’ views. The mean value of nonpartisans was closer to unification before 2005 (-0.344 in 2002), but it moved toward independence after 2008 (0.206 in 2014) and back toward unification in 2017 (-0.192 in 2017).
Polarized Partisans, or Quitting Moderates?
Two assumptions are needed if we want to use Figure 1 as evidence of worsening polarization in Taiwanese politics. First, party identification needs to be stable so that we can attribute these changes in attitudes to the same group of people. Second, as argued by Fiorina and Abrams (Reference Fiorina and Abrams2008) and Abramowitz (Reference Abramowitz2010), moderate Taiwanese voters should constitute a relatively small share of the total electorate.
These assumptions are not valid. Figure 2 shows the distribution of partisanship in Taiwan over the same 16 years. This figure clearly indicates that partisanship is not stable in Taiwan: KMT support ranges from 21 percent in 2002 to 42 percent in 2008, and the share of nonpartisans increased from 25 percent in 2012 to 51 percent in 2017.
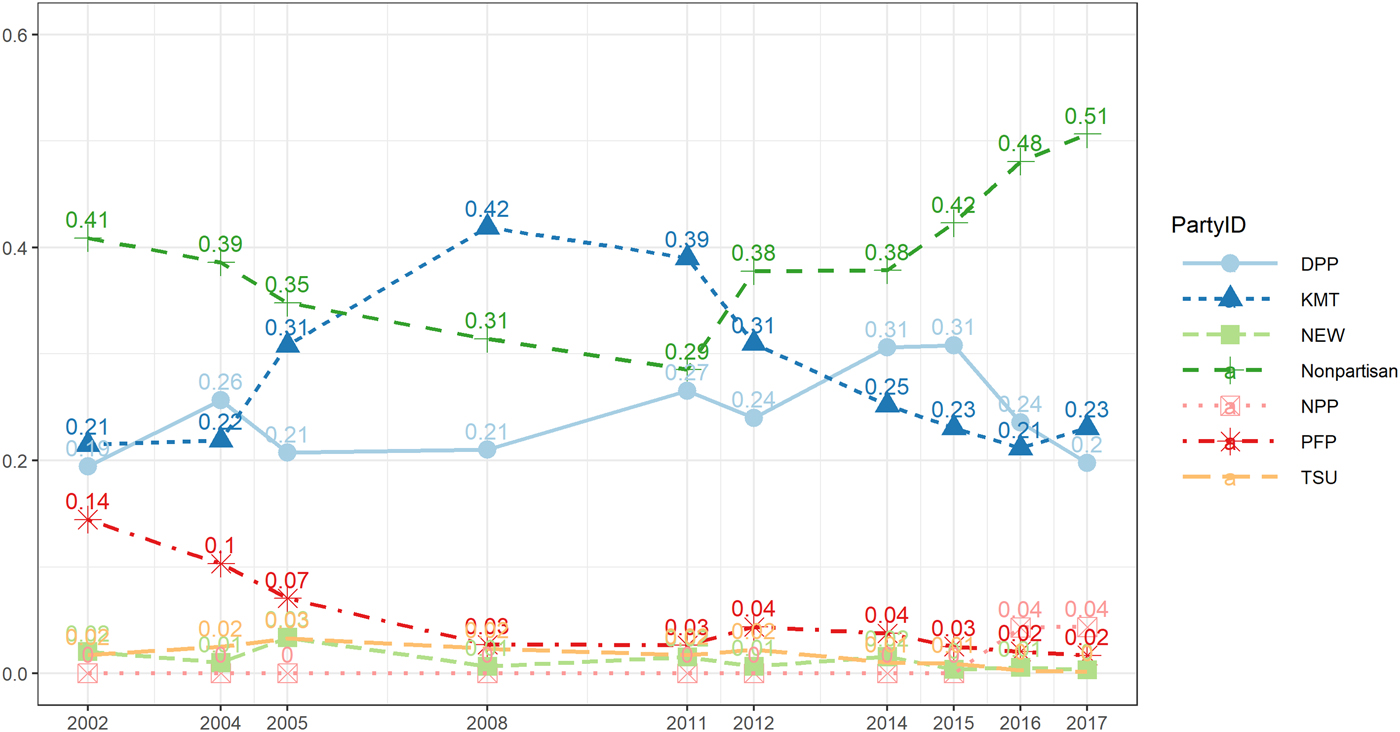
FIGURE 2 Percentage of partisans and nonpartisans, 2002–2017
Figure 3 presents the distributions of all respondents’ cross-strait positions generated by the factor analysis. The distributions were created using the geom_density function in ggplot2 in R. geom_density function relies on the histogram of the original data, and computes and draws a kernel density estimate. If there are two modes in the distribution, we should observe the pattern in the plot.

FIGURE 3 Distribution of cross-strait scores of all respondents by year
Among Taiwanese voters, a U shape indicating polarization has not appeared. Even when the difference between pan-blue and pan-green supporters reached a maximum in 2017, the overall 2017 distribution is indistinguishable from the 2004, 2005, and 2008 distributions (p > 0.05 using a Tukey honestly significant differences test).
Therefore, it is much more likely that the increased polarization among Taiwanese partisans shown in Figure 1 should be attributed to moderate voters who left the pan-blue camp. Without these moderates (in Figure 2), the average score of the remaining pan-blue supporters became much more extreme (in Figure 1). Unfortunately, this plausible explanation cannot be represented by a traditional issue position plot, such as Figure 1, or a D-nominate score (Poole and Rosenthal Reference Poole and Rosenthal2001).
Visualizing The Polarization of Taiwanese Voters over time
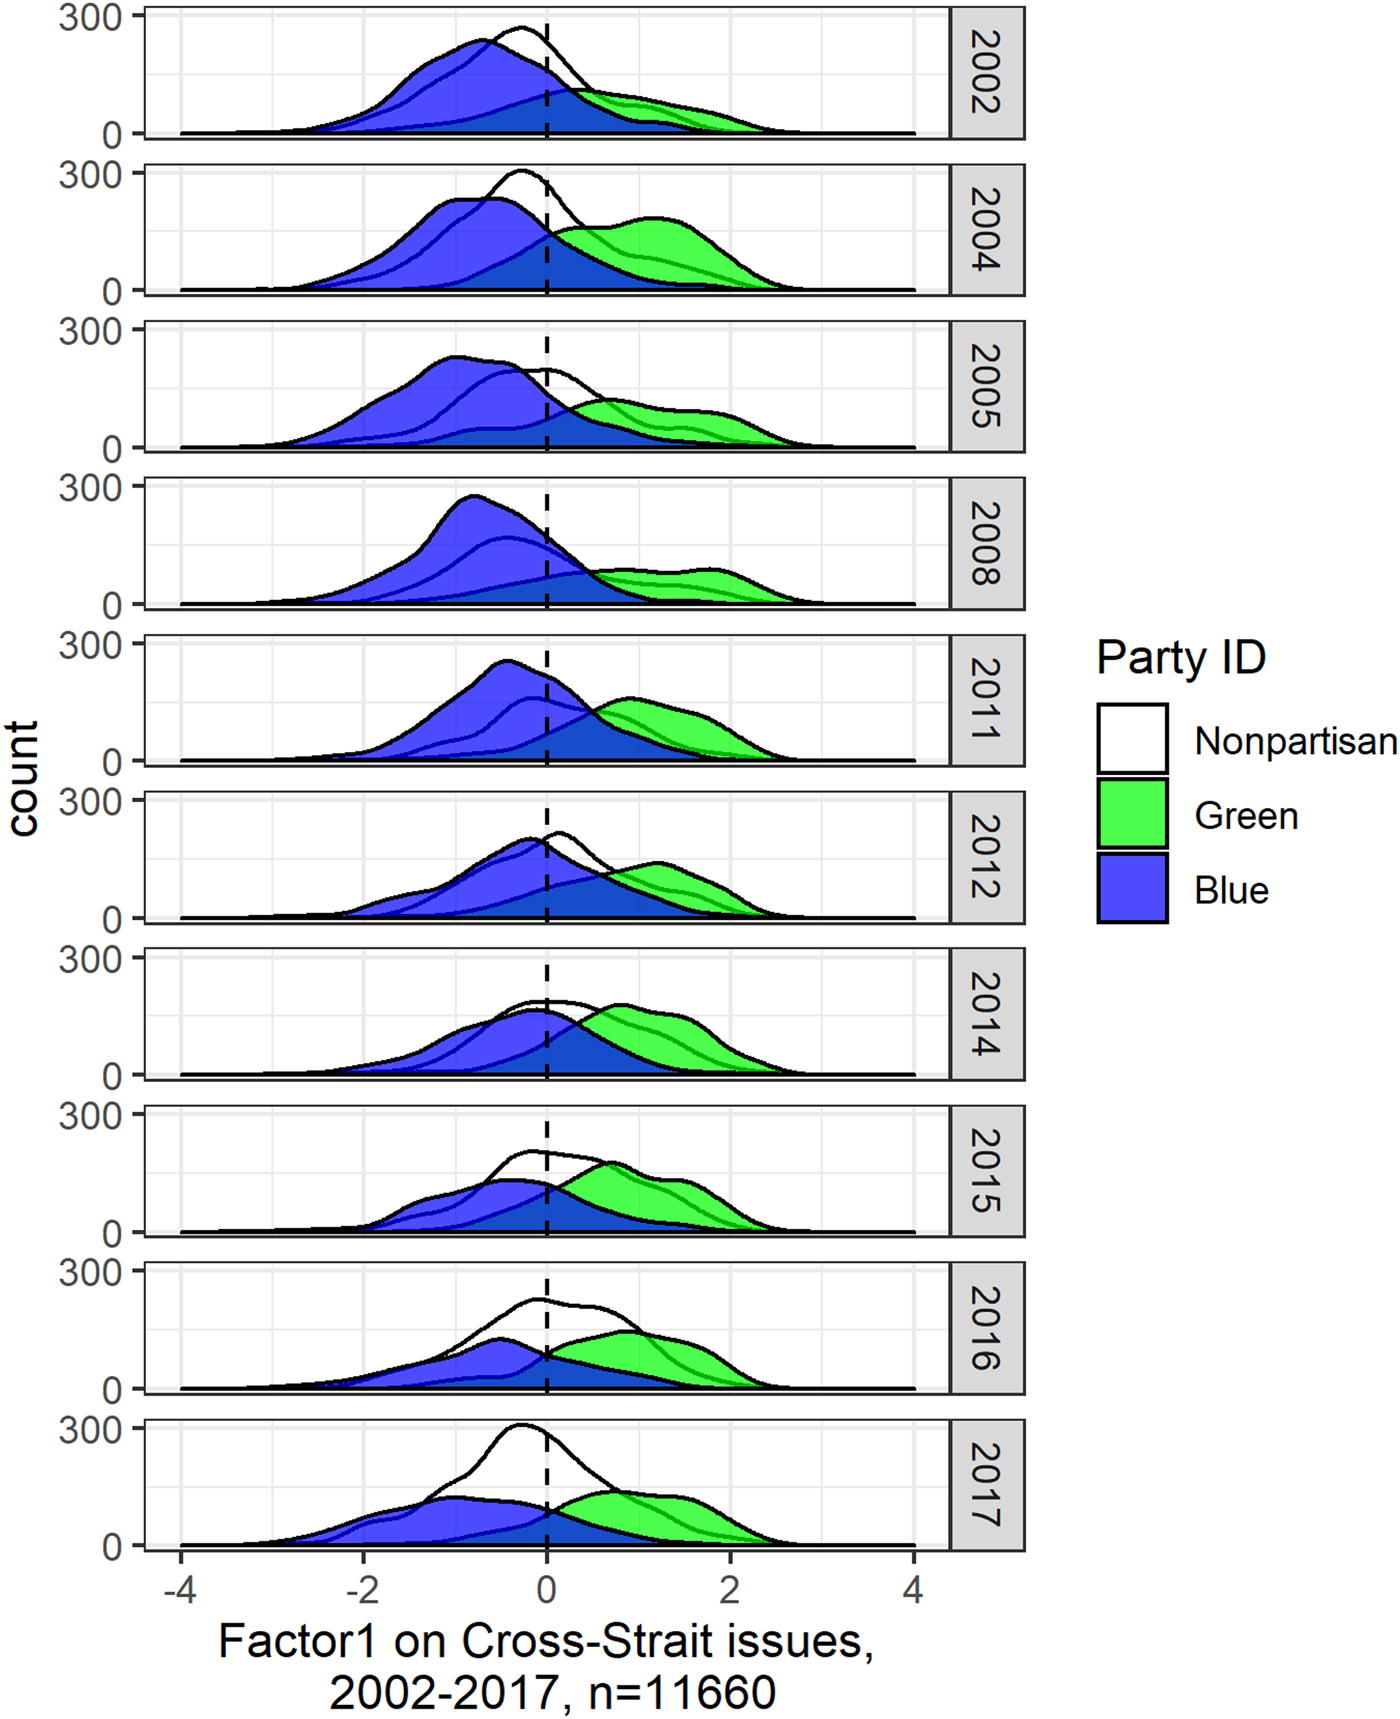
Good data visualizations should reduce the cognitive effort. Figure 4 combines all of the information presented in Figure 1, 2, and 3. This figure presents the distributions of cross-strait scores of pan-blues, pan-greens, and nonpartisans by year. The blue-shaded area is the distribution for pan-blue supporters, the green-shaded area for pan-green supporters, and the white zone for nonpartisans.

FIGURE 4 Distribution of cross-strait scores by partisanship and year
Four critical findings emerge from Figure 4. First, the growth of moderate nonpartisans since 2015 is a new phenomenon that had not been previously observed. More than half of respondents self-identified as nonpartisans in 2017. Although many Taiwanese voters are slightly pro-independence or pro-unification, these ideologically moderate voters no longer support any party in Taiwan. Specifically, the dramatic shift among pan-blue voters can be attributed to the moderate pro-unification supporters who left.
Second, the gap between pan-blue and pan-green supporters is the widest in 2017, but it comes from a diminishing base on both sides. Figure 1 suggests similar levels of polarization in 2017 and 2005. However, Figure 4 clearly shows that the political structures in 2005 and 2017 are entirely different because of the numbers and distributions of nonpartisans in these two years: in 2005, both pan-blue and pan-green camp attract several moderate supporters, but in 2017 neither of the two was attractive enough to Taiwanese voters. The comparison between 2005 and 2017 indicates the power and importance of visualization on studying political polarization.
Third, the decreasing polarization observed between 2008 and 2014 can be explained by both moderate voters joining the pan-blue camp and pan-blue supporters becoming less extreme. During this period, almost all pan-blue voters had cross-strait scores higher than -1, which was not the case before 2005 or after 2017. Meanwhile, more than half of the slightly pro-unification voters self-identified as pan-blue partisans, which shifted the distribution of pan-blue supporters toward the center during the 2008–2014 period.
Fourth, there is considerable overlap among pan-blues, pan-greens, and nonpartisans. Even in the most polarized year (2017), 4.9 percent of respondents identified as pan-blue partisans with positive cross-strait scores, and 3.5 percent of respondents identified as pan-green partisans with negative cross-strait scores. In every year, nonpartisans may hold either extremely pro-unification or extremely pro-independence positions, but most of them are moderates. These overlaps are usually neglected in the traditional visualization of political polarization.
DISCUSSION
Are Taiwanese voters polarized? The four plots presented in this article reveal a more complete story of structural change in Taiwanese politics. Overall, the cross-strait position among Taiwanese voters has been stable and is described by an inverted U shape over time, with no signs of becoming U shaped (see Figure 3). Before 2008, increasing polarization among partisans can be attributed to pan-green voters favoring independence. Since the number of pan-green supporters remained the same and the non-partisans did not increase during this period, it is very likely that the change is owing to the move of pan-green supporters. Between 2008 and 2014, decreasing polarization stems from moderates who self-identify as pan-blue supporters. After 2014, the record-breaking number of moderates leaving parties and the radicalized remaining pan-blue voters lead to increasing (re)polarization in Taiwanese politics.
Taking nonpartisans into account is not only crucial for understanding changes in Taiwanese politics but also speaks to the study of polarization. Since the Pew Research Center published the first visualization of political polarization in 2014, the (increasing) difference between Republicans and Democrats has drawn considerable attention.Footnote 3 Based on a plot of Taiwanese politics like the one Pew presented, as shown in Figure 5, we might also conclude that Taiwanese politics is increasingly polarized between KMT and DPP supporters. However, Figure 4 (accompanied by Figures 2 and 3) indicates that polarization among partisans is not the full story.
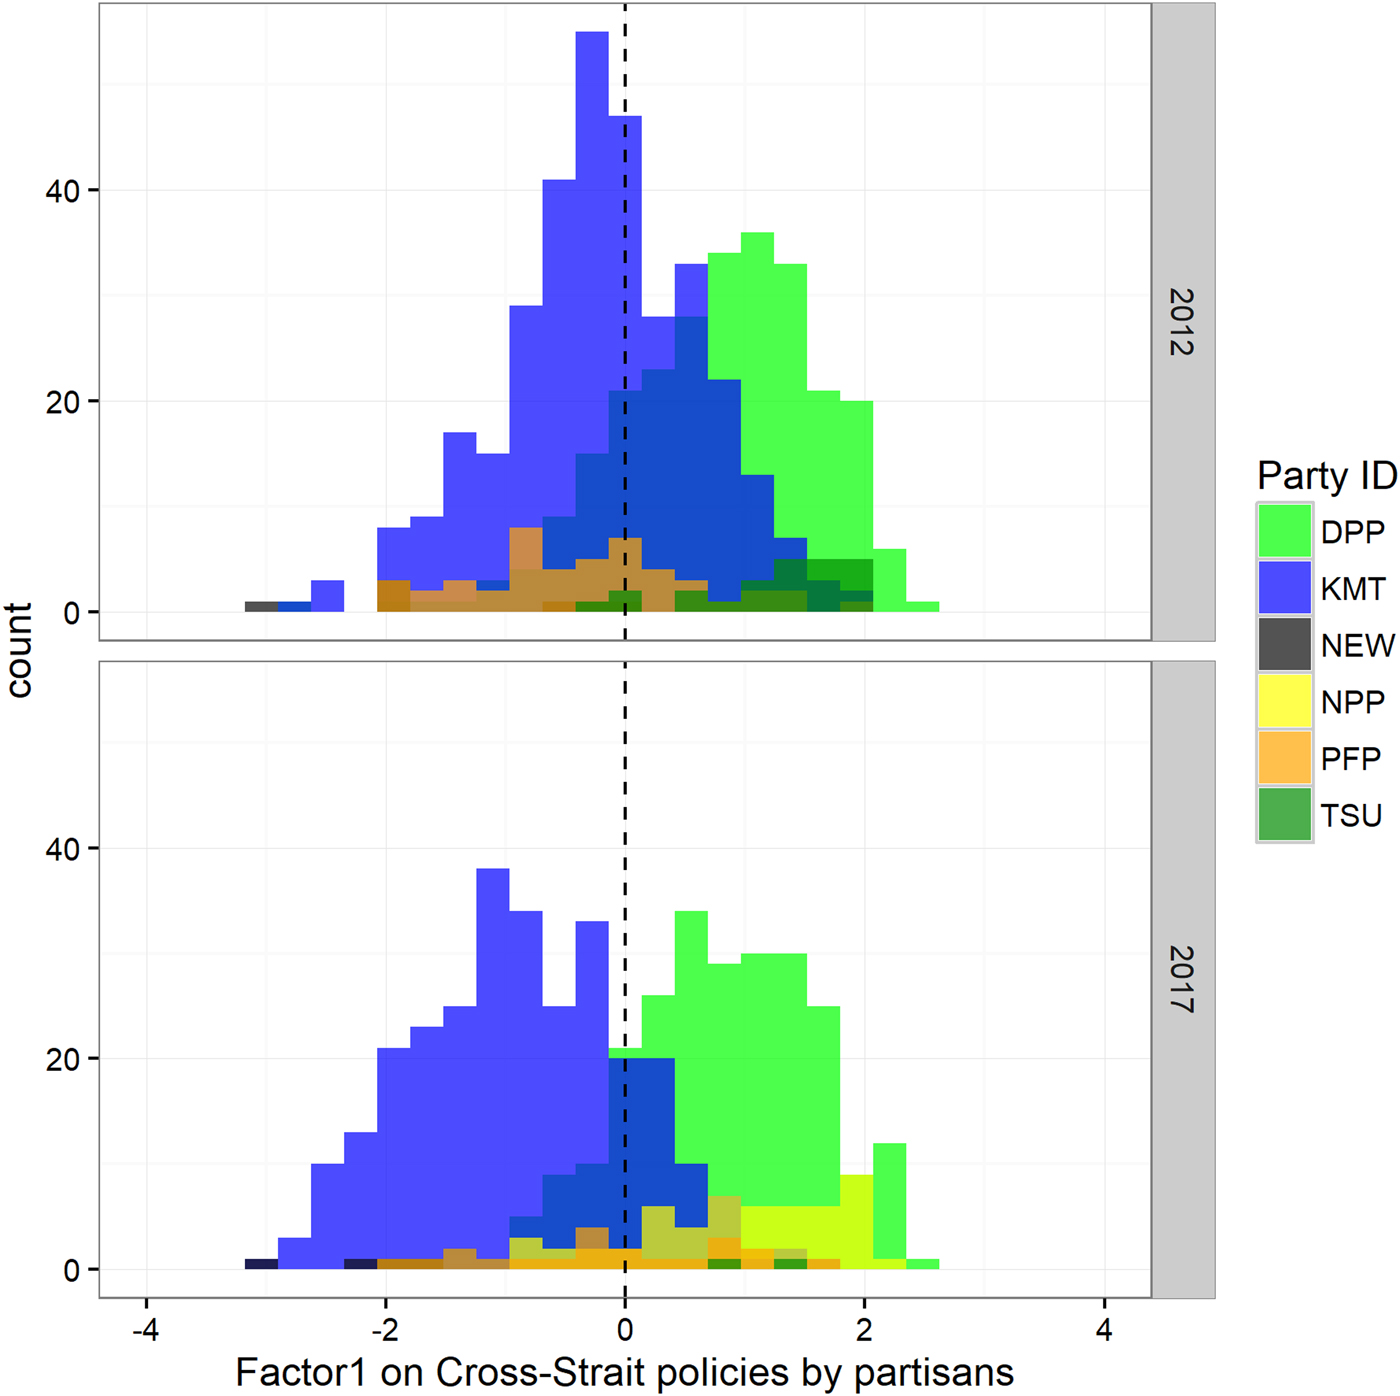
FIGURE 5 Histograms of cross-strait scores by partisanship in 2012 and 2017
An emphasis on nonpartisans in the era of partisan polarization is also crucial to improving democracy. Even though there is less overlap between the two parties’ supporters in the US and in Taiwan, ballot-seeking candidates cannot win elections by merely appeasing their respective bases. Therefore, the extent to which polarized partisans impact final election results and policy outcomes is worth investigating (e.g. Layman et al. Reference Layman, Carsey, Green, Herrera and Cooperman2010). Moreover, the increasing number of moderate nonpartisans may also motivate the emergence of new moderate parties or candidates. For example, Dr. Ko Wen-je, a Taiwanese surgeon, won the Taipei City mayoral election as an independent candidate with 57.6 percent of votes. One of the main reasons for his popularity is his moderate position on cross-strait issues. Before the 2018 Taipei City mayoral election, which included both KMT and DPP candidates, the incumbent Ko received more than half the support in several polls, and eventually won the reelection in late November.
However, this record-breaking number of nonpartisans may foreshadow the rise of anti-establishment. In Figure 4, it is clear that many slightly pro-unification and pro-independence voters no longer show support the major parties that hold their positions. When voters do not believe that the existing politicians or elites represent them, they are much likely to vote for new populist candidates who call for replacing the establishment and pursuing policies with immediate outcomes. For example, in a 2018 news interview, Taipei City Mayor Ko said, “There is no blue nor green, but right or wrong,” and “I will defeat both the blue and green candidates.”Footnote 4 NPP, the party formed by members of the 2014 Sunflower Movement, used the campaign slogan “Come on! New Generation! New Generation will Change the World” on the party website.Footnote 5 NPP also pushed for all forms of direct democracy and referendums in 2018. All of these campaign discourses are signs of rising populist discourse (Aslanidis Reference Aslanidis2016, Reference Aslanidis2017; Guiso, Herrera, and Morelli Reference Guiso, Herrera and Morelli2017). If Taiwanese voters lose their confidence in all political parties in Taiwan, what should they expect for democracy?
The results presented in this article suggest several directions for the future work. First, surveys alone cannot explain whether polarization drove or was driven by elites in Taiwanese politics (e.g., Abramowitz Reference Abramowitz2010). What is the motivation for parties under a presidential system to drive their supporters toward the extremes? Second, why did the two major parties in Taiwan fail to attract slightly pro-unification and pro-independence voters after 2017? One hypothesis is that Taiwanese voters do not see the promises of either party as credible. KMT won both the presidency and a majority in Congress in 2008, and DPP did so in 2016. However, both parties failed to realize some important policy goals even though voters had given them full control of the government. Third, for whom will these nonpartisans vote? Lee et al. (Reference Lee, Chen, Yen, Tsai and Cheng2017) show that implicit party preference among Taiwanese voters played a vital role in the vote choice in the 2016 presidential election. Will this still be the case when nonpartisans outnumber partisans and a third populist option, like Dr. Ko, becomes available?
Last but not least, the distribution of Taiwanese public opinion is decided mainly by US–China interactions, especially regarding military action. In Table 1, some of the most critical components—Q3, Q4, Q7, and Q8—are strongly influenced by the claims and commitments made by the US and Chinese governments. Thus, how increasing tension between the US and China since 2018 will impact the distribution and polarization of Taiwanese voters is worthy of attention.
SUPPLEMENTARY MATERIAL
To view supplementary material for this article, please visit https://doi.org/10.1017/jea.2019.25
CONFLICTS OF INTEREST AND FUNDING
Austin Horng-En Wang declares none.