


INTRODUCTION
Reducing nitrogen (N) excretion by dairy cattle is desirable due to global concerns about the agricultural contribution to environmental pollution by N, particularly as ammonia volatilization into the atmosphere and nitrate leaching into surface and groundwater (Draaijers et al. Reference Draaijers, Ivens, Bos and Bleuten1989; Howarth et al. Reference Howarth, Billen, Swaney, Townsend, Jaworski, Lajtha, Downing, Elmgren, Caraco, Jordan, Berendse, Freney, Kudeyarov, Murdoch and Zhao-Liang1996). The primary source of ammonia-N from manure is urinary urea N (UUN; g N/day), which is hydrolysed to ammonia and carbon dioxide (CO2) by the activity of microbial urease present in faeces. Urea is formed mainly in the liver as a means of detoxification of ammonia present in the systemic circulation, is transported in blood plasma (plasma urea N, PUN; mg N/l) and subsequently diffuses or is transported to other fluid pools in the body such as milk in the udder and liquid in the rumen. Urea is excreted with the urine and most urea is eliminated from blood with urine excretion. Urea accounts for 0·50–0·90 of the N in cattle urine (Bristow et al. Reference Bristow, Whitehead and Cockburn1992). An increase in N intake leads to a more pronounced increase in urinary total N (UN) excretion (g N/day) than in faecal N excretion (Jonker et al. Reference Jonker, Kohn and Erdman1998; Kebreab et al. Reference Kebreab, France, Mills, Allison and Dijkstra2002) and generally results in an elevated concentration of milk urea N (MUN; mg N/l).
Hence, clear positive correlations have been shown between MUN and UN (Ciszuk & Gebregziabher Reference Ciszuk and Gebregziabher1994) and between MUN and UUN (Burgos et al. Reference Burgos, Fadel and DePeters2007) and significant relationships have also been shown between ammonia emission and UUN (Burgos et al. Reference Burgos, Embertson, Zhao, Mitloehner, DePeters and Fadel2010) and between ammonia emission and MUN (Van Duinkerken et al. Reference Van Duinkerken, André, Smits, Monteny and Sebek2005). This has led to the development of several models predicting UN from MUN alone (Jonker et al. Reference Jonker, Kohn and Erdman1998; Broderick Reference Broderick2003), from MUN and daily milk production (Bannink & Hindle Reference Bannink and Hindle2003; Nousiainen et al. Reference Nousiainen, Shingfield and Huhtanen2004), from MUN and body weight (BW) (Kauffman & St-Pierre Reference Kauffman and St-Pierre2001; Kohn et al. Reference Kohn, Kalscheur and Russek-Cohen2002) or from MUN, daily milk production and milk protein yield (Bannink & Hindle Reference Bannink and Hindle2003).
Although correlation coefficients appear reasonably high, estimates of UN excretion using various equations based on MUN differ considerably (Fig. 1). For example, using the regression equations from the studies of Broderick (Reference Broderick2003) and Bannink & Hindle (Reference Bannink and Hindle2003), a MUN value of 100 mg/l results in a predicted UN of 223 and 128 g/day, respectively. Clearly, there is considerable between-experiment variation. The data from Dutch N balance trials (Bannink & Hindle Reference Bannink and Hindle2003) show that a significant proportion of variation (c. 0·72) of UN is explained by MUN (MUN ranged from 50 to 300 mg/l). However, on using a subsample of this dataset in a limited MUN range of 50–150 mg/l, often observed in practice, the prediction accuracy of UN by MUN was low (R 2=0·23). Apparently, some key factors are not accounted for in these equations, leading to substantial differences in predicted UN.

Fig. 1. Effect of MUN concentration (mg N/l) on predicted daily UN excretion (g/day) of a cow having a BW (kg) of 650 kg and producing 30 kg of milk/day (DMP) based on equations of Kohn et al. (Reference Kohn, Kalscheur and Russek-Cohen2002); UN=1·51×MUN+27·8, Kauffman & St-Pierre (Reference Kauffman and St-Pierre2001); UN=0·00259×BW×MUN, Broderick (Reference Broderick2003); UN=1·12×MUN+111·6, Bannink & Hindle (Reference Bannink and Hindle2003); UN=1·45×MUN – 4·79×DMP+126·3 and Nousiainen et al. (Reference Nousiainen, Shingfield and Huhtanen2004); UN=1·31×MUN+6·00×DMP. The MUN range of the model prediction curves correspond with the range of observed MUN values of the datasets on which the model equations are based on.
Under a wide range of conditions, dietary protein concentration explains most variation in MUN (Broderick & Clayton Reference Broderick and Clayton1997; Nousiainen et al. Reference Nousiainen, Shingfield and Huhtanen2004) and UN (Nousiainen et al. Reference Nousiainen, Shingfield and Huhtanen2004) and the effect of the amount and type of dietary protein on MUN and N excretion has been studied frequently (e.g. Oltner et al. Reference Oltner, Emanuelson and Wiktorsson1985; Broderick & Clayton Reference Broderick and Clayton1997; Broderick Reference Broderick2003; Nousiainen et al. Reference Nousiainen, Shingfield and Huhtanen2004). However, besides dietary protein, several factors affect MUN and possibly the relationship between MUN and UN or UUN (Table 1). Taking these factors into account may improve the accuracy of prediction of UN or UUN from MUN in combination with these factors.
Table 1. Overview of differences in ratios between urine nitrogen excretion (g N/day) and MUN ( mg/l), between UUN excretion ( g N/day) and MUN, between UN and PUN (mg/l), and between UUN and PUN in bovines at treatment contrasts from various studies
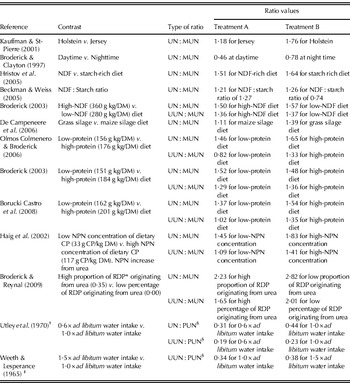
* Rumen degradable protein.
† Experiment was carried out with Aberdeen Angus steers (c. 250 kg live weight).
‡ Experiment was carried out with yearling Hereford heifers (live weight unknown).
§ Owing to the close relationship between PUN and MUN, observed differences in UN : PUN and UUN : PUN ratios are expected to yield similar differences in UN : MUN and UUN : MUN ratios as well.
In the current review, the effect of a number of factors is summarized and evaluated for their possible impact on the relationship between MUN and UUN. More literature is available with respect to the relationship between MUN and UN than between MUN and UUN. As the concentration of urea-N and N in urine are closely associated (Burgos et al. Reference Burgos, Robinson, Fadel and DePeters2005) and because of the strong relationship between UN and UUN that was established in the current study (Fig. 2), research evidence on the relationship between MUN and UN was also taken into consideration.

Fig. 2. Simple regression of UN excretion (g N/day) on UUN excretion (g N/day). UN=51·9±4·42+0·95±0·026×UUN, R 2=0·94. The model was derived from 84 observations collected in 20 experiments (references available on request).
Figure 3 provides a simplified representation of flows that affect PUN, MUN, UN, UUN and the relationship between MUN and UUN or UN. These relationships can be expressed as UUN : MUN and UN : MUN ratios, respectively. The N flows presented in Fig. 3 are dynamic flows that depend on a combination of factors such as management, nutrition and cow factors. The first section describes some physiological factors that are likely to affect the relationship between MUN and UUN. Making use of the physiological principles described in the first section, the following sections of the current review focus on factors related to management, differences between cows and nutrition.

Fig. 3. Overview of nitrogen flows in the lactating ruminants that influence levels of urea in blood plasma and milk, and possibly affect the relationship between urea concentration in the milk and the quantity of nitrogen excreted in the urine. Arrows represent fluxes and boxes enclosed by solid lines represent pools. NPN is defined as non-protein-N with the exception of urea.
PHYSIOLOGICAL FACTORS
Diurnal variation in PUN and MUN
The distribution of feed intake during a day affects diurnal variation in concentrations of rumen ammonia, PUN and MUN and differences between PUN and MUN (Gustafsson & Palmquist Reference Gustafsson and Palmquist1993). After a meal, microbial degradation of dietary protein is likely to cause an increase in the concentration of rumen ammonia which, due to the transport of rumen ammonia to the blood and the subsequent conversion of blood ammonia into urea by the liver, is followed by a rise in PUN and, due to diffusion between milk and blood, in MUN. However, diets with a high rapidly degradable carbohydrate fraction may result in a decrease of rumen ammonia immediately after feeding, because degraded protein and rumen ammonia are utilized for microbial protein synthesis. The diurnal variation in MUN is of interest when MUN is used as an estimator of UUN, in particular because UUN is expressed on a daily basis, whereas in practice, milk samples for MUN are obtained during milking only. Gustafsson & Palmquist (Reference Gustafsson and Palmquist1993) observed that peak values of PUN may be up to 80% higher than the lowest values and that MUN equilibrated with PUN with a lag time of 1–2 h, possibly caused by diffusion from blood to milk. Likewise, Carlsson & Bergström (Reference Carlsson and Bergström1994) observed diurnal differences in MUN of up to 60%. Thus, the UUN : MUN ratio may differ depending on factors such as time of sampling milk and the feed intake pattern that is discussed in a following section on management factors.
Broderick & Clayton (Reference Broderick and Clayton1997) compared MUN and UUN during daytime (04·00–16·00 h) and night time (16·00–04·00 h). Average MUN during daytime (160 mg/l) was 33% higher than during night time (120 mg/l), whereas UUN was even larger in the night time period. These differences between day and night resulted in UUN : MUN ratios of 0·46 and 0·77 for the daytime period and night time period, respectively. These differences in the UUN : MUN ratios show that the relationship between MUN and UUN is not constant. The fact that cows consume most of their diet during the daytime (Tolkamp et al. Reference Tolkamp, Friggens, Emmans, Kyriazakis and Oldham2002; De Vries et al. Reference De Vries, von Keyserlingk and Beauchemin2003; Taweel et al. Reference Taweel, Tas, Dijkstra and Tamminga2004) might explain the diurnal variation in the MUN and the UUN : MUN ratios.
In conclusion, a large diurnal variation in the MUN and UUN : MUN ratios observed in some studies shows that the UUN : MUN ratio is probably affected by the moment of sampling milk.
Labile N reserves
According to Munro (Reference Munro, Munro and Allison1964) it was Carl Voit in 1866–67 who established the theory of labile N reserves. He found that if N intake was altered from a high to a low level, a net loss from the body N pool occurred before a new equilibrium was established. This net loss of N was called the labile N pool. This labile N pool, as influenced by feeding management and between meal periods, may affect MUN and the expected UUN : MUN ratio as well. Approximately 0·05 of the total body protein in Holstein dairy cows is considered to be highly labile, whereas the total protein reserves may be as large as 0·50 of the total body protein (Botts et al. Reference Botts, Hemken and Bull1979). Biddle et al. (Reference Biddle, Evans and Trout1975) reported a labile body protein reserve in growing Jersey steers of 0·056 of the total body protein. The highly labile N is found mainly as urea in blood plasma and as protein in visceral organs such as the liver, kidney and intestinal epithelia, characterized by the highest protein turnover rates in the whole body (Bannink et al. Reference Bannink, Dijkstra, Koopmans and Mroz2006). Some of these pools serve as protein donors to the body during pre-prandial periods.
This buffering effect of the liver and possibly the intestinal cell wall probably reduces peaks in PUN and MUN that would otherwise be expected after a meal due to postprandial deamination and oxidation of absorbed protein and diffusion of rumen ammonia to the blood. Peaks of PUN after a meal are mainly caused by diffusion of ammonia from the rumen to the blood, whereas part of the postprandial protein absorbed by the small intestine is probably stored as protein in liver and gut tissues.
There are some data available with respect to short-time (24–48 h) oscillation in dietary protein intake and PUN. Ludden et al. (Reference Ludden, Wechter and Hess2002b) observed that wether sheep receiving an oscillating protein diet that was switched over every 48 h from 130 to 170 g crude protein (CP)/kg dry matter (DM) and vice versa had lower serum urea N concentration (blood samples taken every 4 h during 4 days) than wethers receiving a constant daily 150 g CP/kg DM ration (serum urea of 121 v. 134 mg/l, respectively), despite a similar average N intake and dietary CP digestibility for the two treatments. In other experiments with lambs, however, Cole (Reference Cole1999) found no clear differences in PUN between a control diet (125 g CP/kg DM) and oscillating diets that were switched every 24 or 48 h between high- (150 g CP/kg DM) and low- (100 g CP/kg DM) protein diets (based on blood samples taken before the morning feeding). Archibeque et al. (Reference Archibeque, Freetly and Ferrell2007) also found no significant differences in PUN between an oscillating diet (dietary CP content oscillated every 48 h between 99 and 142 g CP/kg DM) and a daily 125 g CP/kg DM diet in an experiment with growing wethers, although the dietary N intake was 14·4% higher (25·4 g N/day) for wethers receiving the oscillating protein diet than for the wethers receiving the daily 125 g CP/kg DM diet (22·2 g N/day).
The results described above indicate that there is no clear relationship between PUN (and subsequently MUN) and oscillation of dietary protein intake, which might be caused by the buffering capacity of the body in fixating absorbed protein and gradually releasing this fixated protein later on. This theory is further strengthened by results of Ludden et al. (Reference Ludden, Wechter and Hess2002a), who found that wether lambs receiving a diet that oscillated in CP from 130 to 170 g CP/kg DM every 48 h had organ masses that were 5·4, 17·3 and 6·2% higher for the liver, small intestine and reticulorumen, respectively, than lambs receiving a daily 150 g CP/kg DM diet, despite a similar average daily N intake. Kiran & Mutsvangwa (Reference Kiran and Mutsvangwa2009) observed an increased N retention in growing lambs fed oscillating protein diets over 24 days, which was probably due to an increase in organ mass of the gastro intestinal tract (GIT) and liver. Adaptation (by enlarging labile protein tissue) to periods of protein deficiency may explain the observed increase in organ mass of liver and GIT in lambs receiving oscillating protein diets.
In conclusion, although it is not possible to quantify the effect of the buffering capacity of the labile protein pool on diurnal changes in the PUN, MUN and UUN : MUN ratio, it is likely that the fluctuations in PUN and MUN before and after a meal are different from the values expected from the postprandial absorption of protein and ammonia from the GIT.
Renal urea reabsorption
A number of studies consider a linear relationship between PUN (or MUN) and UN (Jonker et al. Reference Jonker, Kohn and Erdman1998; Kauffman & St-Pierre Reference Kauffman and St-Pierre2001; Kohn et al. Reference Kohn, Kalscheur and Russek-Cohen2002). However, there are indications that renal urea reabsorption may be actively regulated by means of urea transporters (UT), depending on certain conditions such as protein intake or dehydration status. This active regulation of renal urea absorption is likely to affect the UUN : MUN ratio. Two groups of UT have been identified in mammals, UT-A and UT-B (Bagnasco et al. Reference Bagnasco, Peng, Nakayama and Sands2000), that offer the possibility of a rapid transfer of urea across cell membranes. In lambs, UT-B is present in tissues of the rumen, liver, kidney, small intestine and caecum, whereas UT-A is present in tissues of the kidney, liver and duodenum (Marini et al. Reference Marini, Klein, Sands and Van Amburgh2004). Inoue et al. (Reference Inoue, Kozlowski, Klein, Bailey, Sands and Bagnasco2005) showed that the presence of UT-B in the inner and outer medulla of kidneys from rats decreased significantly when offered a diet with high- instead of low protein content. A larger quantity of UT-B in the outer and inner renal medulla of rats fed with a low-protein diet can explain the often reported increase of urea recycling in rats (Smith et al. Reference Smith, Lee, Martial, Knepper, You, Sands and Hediger1995; Sands et al. Reference Sands, Martial and Isozaki1996; Kato & Sands Reference Kato and Sands1999). Tsukaguchi et al. (Reference Tsukaguchi, Shayakul, Berger and Hediger1998) showed the existence of three UTs in the rat kidney and concluded that one of these UTs was responsible for the bulk of urea reabsorption in the terminal inner medullary collecting duct.
The possibility of active urea transport has been shown by Isozaki et al. (Reference Isozaki, Verlander and Sands1993) and Sands et al. (Reference Sands, Martial and Isozaki1996). Sands and co-workers found that active urea transport took place in the inner medullary collecting duct of rats fed with a low-protein diet for 3 weeks. This transport of urea was blocked in the absence of sodium (Na), showing that a secondary active Na transporter was coupled with the transport of urea. Schmidt-Nielsen et al. (Reference Schmidt-Nielsen, Schmidt-Nielsen, Houpt and Jarnum1957) found that the PUN level in a young camel during a period of water deprivation was significantly higher than that in an older camel and explained this difference in PUN by assuming that the young, still growing camel saved and stored the urea for growing purposes. This would mean that urea excretion by the kidney is not only controlled by PUN alone, as assumed in a number of studies, but also by the physiological status or hormonal state of the animal. If the (active) renal reabsorption of urea in low-protein diets observed in rats occurs as well, then this will probably result in a distortion of the general linear relationship between PUN and UUN and as a result the UUN : MUN ratio (as MUN is a reflection of PUN) is likely to change at low PUN values. More information on the effect of dietary protein on the UUN : MUN ratio is presented in a following section on nutritional factors. Besides an increase in renal reabsorption of urea in order to minimize excretion of N, Eriksson & Valtonen (Reference Eriksson and Valtonen1982) observed in experiments with goats fed high- (140 g/kg DM) or low- (<20 g/kg DM) CP diets that UN in the low-CP diet was minimized by means of a combination of a lowered PUN, an increased fractional renal reabsorption rate of urea and a decreased glomerular filtration rate as compared with the high-CP diet. The UUN : PUN ratio in the study of Eriksson & Valtonen (Reference Eriksson and Valtonen1982) was 0·057 and 0·004 for the high- and low-CP diet, respectively.
Renal urea recycling is also influenced by the hydration status of the animal. Bagnasco et al. (Reference Bagnasco, Peng, Nakayama and Sands2000) found that expression of UT-A mRNA was especially increased in the inner medulla of water deprived rats compared with control rats. Urea is an important osmolite in the renal reabsorption of water. An increase in UT-A transporters during dehydration may indicate an increase in urea reabsorption in order to increase renal osmotic pressure, resulting not only in increased water absorption from the filtrate, but also in an increase in PUN (and subsequently MUN due to diffusion of urea between blood and milk). It has been shown in a number of studies that dehydration results in increased levels of PUN and/or MUN (Weeth et al. Reference Weeth, Sawhney and Lesperance1967; Utley et al. Reference Utley, Bradley and Boling1970; Steiger Burgos et al. Reference Steiger Burgos, Senn, Sutter, Kreuzer and Langhans2001). More quantitative information on the effect of water intake on the UUN : MUN ratio is given in a following section on nutritional factors.
In conclusion, renal urea filtration is a regulated process that depends on, among others, the hydration status of the animal and the protein supply to the animal. Hence, the level of protein and water supply and their interaction, may affect the relationship between MUN and UUN.
Biological rhythm
Daily rhythmicity is a well-known feature of mammalian species and daily rhythmicity may affect the level of the PUN, MUN and UUN : MUN ratios. The suprachiasmatic nucleus in the hypothalamus is the dominant regulator of circadian rhythmicity, influenced by light. It has been shown in rats during restricted feeding conditions that, besides the suprachiasmatic nucleus, other food-entrainable circadian oscillators are present in the digestive organs (Davidson et al. Reference Davidson, Poole, Yamazaki and Menaker2003). Takata et al. (Reference Takata, Burioka, Ohdo, Takane, Terazono, Miyata, Sako, Suyama, Fukuoka, Tomita and Shimizu2002) showed that mRNA levels of mPer2, a clock gene, in mice liver had a significant diurnal variation suggesting that liver activity is time-regulated, although not necessarily independent of feeding time.
It was suggested by Piccione et al. (Reference Piccione, Caola and Refinetti2003) that the rhythm of PUN concentration in goats was driven by digestive processes and not by time of feeding. This contrasts, however, with the studies of Lefcourt et al. (Reference Lefcourt, Huntington, Akers, Wood and Bitman1999) and Piccione et al. (Reference Piccione, Grasso, Fazio, Assenza and Caola2007) in dairy cattle in which PUN increased prior to feeding, which was probably not caused by feed intake and day and night rhythm alone. Piccione et al. (Reference Piccione, Grasso, Fazio, Assenza and Caola2007) conducted an experiment with Italian Brown cows with access to feed at either 08.00 or 16.00 h for 2 h. In both treatments, PUN concentrations increased prior to feeding to c. 28 mg/l. This increase was independent of day and night periods because it occurred in both groups. The increase in PUN prior to feeding observed by both Piccione et al. (Reference Piccione, Grasso, Fazio, Assenza and Caola2007) and Lefcourt et al. (Reference Lefcourt, Huntington, Akers, Wood and Bitman1999) may be explained by an increase in urea formation by the liver from the labile protein reserve, a reduction of urea excretion by the kidneys, a reduction in blood plasma volume due to the excretion of liquids into the digestive tract, an increase in water excretion into the urine or other processes.
With respect to hydration status, Buemi et al. (Reference Buemi, Campo, Sturiale, Aloisi, Romeo, Nostro, Crasci, Ruello, Manfredini, Floccari, Cosentini and Frisina2007) found that body water content of humans showed a circadian rhythm being highest between 09.00 and 23.00 h. There is a possibility that a comparable circadian rhythm of glomerular filtration rate and body fluid content exists in dairy cows that affects PUN and that the circadian rhythms of PUN observed in the experiment of Piccione et al. (Reference Piccione, Grasso, Fazio, Assenza and Caola2007) increased PUN prior to feeding.
The existence of feed intake independent diurnal variation in PUN was shown by Piccione et al. (Reference Piccione, Caola and Refinetti2003). In an experiment with feed-deprived goats, diurnal variation appeared to remain during two consecutive days after the last feeding. During another experiment from Piccione et al. (Reference Piccione, Caola and Refinetti2003) with the same goats, the animals were deprived of feed during 3 days under a continuous lighting scheme in which diurnal variation of PUN was less compared with the situation of feed deprivation with alternating dark and light phases. These results indicate that circadian rhythms influenced by both day and night rhythm and feeding time, influence PUN.
In conclusion, circadian patterns most probably influence diurnal PUN and as a result MUN. The circadian pattern of MUN may result in different UUN : MUN ratios depending on the time of milking. However, information with regard to the effect of clock genes on diurnal variation in PUN and MUN, as influenced by the time and frequency of milking and feeding and dark and light periods, seems lacking for dairy cows.
MANAGEMENT FACTORS
Feeding frequency and milking interval
Shabi et al. (Reference Shabi, Arieli, Bruckental, Aharoni, Zamwel, Bor and Tagari1998) found that a feeding frequency of twice v. four times a day resulted in 44 mg/l lower PUN at the time of milking. The cows were fed twice a day at the time of milking for the ‘twice feeding per day treatment’, whereas for the ‘four feedings per day treatment’ the cows were fed during milking and in between two milkings. However, the levels of PUN at 2 and 4 h after feeding were lower for the cows fed four times a day. Owing to the strong positive correlation between PUN and MUN (Broderick & Clayton Reference Broderick and Clayton1997) and the rapid (within 1 h) equilibration between PUN and MUN (Gustafsson & Palmquist Reference Gustafsson and Palmquist1993), it appears that MUN and subsequently the UUN : MUN ratio may be manipulated substantially by changing the feeding frequency, assuming an unaltered feed intake and N-metabolism.
It was shown by Nielsen et al. (Reference Nielsen, Larsen, Bjerring and Ingvartsen2005) that the cows milked at 6 h intervals had higher MUN values than the cows milked at 12-h intervals (113 and 99 mg/l, respectively). Average fat concentration from the cows milked at the 6-h interval was also higher compared with the cows milked at the 12-h interval, whereas the protein content did not change substantially. The increase in milk fat content for the 6-h treatment, however, could decrease MUN only slightly, c. 0·9 mg/l, due to a reduced volume of urea space per volume unit of milk. Increased MUN values at shorter milk intervals were also observed by Friggens & Rasmussen (Reference Friggens and Rasmussen2001), who found a decrease in MUN of 1·8 mg/l for every extra hour the milking interval was increased compared with the average milking interval. Hale et al. (Reference Hale, Capuco and Erdman2003), however, found no differences in MUN at 6- or 12-h milking intervals during the first 3 weeks of lactation.
The explanations for higher MUN at shorter milking intervals are speculative. Nielsen et al. (Reference Nielsen, Larsen, Bjerring and Ingvartsen2005) suggested that the time of feed intake, relative to the moment of milking and milk sampling, could explain this trend of higher MUN values at shorter milking intervals. For example, it was shown in the research from De Vries et al. (Reference De Vries, von Keyserlingk and Beauchemin2003) that there were clear peaks of feed alley attendance just after milking. Based on the results of Gustafsson & Palmquist (Reference Gustafsson and Palmquist1993) and Ikuta et al. (Reference Ikuta, Sasakura, Nishimori, Hankanga, Okada and Yasuda2005), MUN peaks c. 4 h after a meal. Therefore, the explanation of Nielsen in the case of a 6-h milking interval seems reasonable. However, the feed intake pattern was not recorded in the aforementioned studies on milking intervals. Another explanation might be that an increase in the milking frequency is probably accompanied with an increase in milk production and dry matter intake (DMI), resulting in an increased dietary N intake and an increase in the level of PUN and subsequently MUN.
In conclusion, assuming an unaltered dietary intake of N and excretion of UUN, the UUN∶MUN ratio is affected by the frequency of milking and feeding.
Within-day synchronization of protein and energy
Although feeding total mixed rations (TMR) to dairy cows is quite common, a large number of farmers still offer roughage and concentrates separately to cows (as is the case when cows are allowed to graze). This influences the instantaneous amount of feed protein degraded in the rumen and subsequently the height and duration of rumen ammonia concentration and of PUN. As a result, the separation of dietary energy and protein consumption in time might affect the MUN and the UUN : MUN ratios, depending on the time of milking.
Ikuta et al. (Reference Ikuta, Sasakura, Nishimori, Hankanga, Okada and Yasuda2005) supplemented half of the concentrates 30 min after feeding the basal diet, whereas the other half of the concentrates was supplemented 1·5 h after feeding the basal diet. The concentrates were separated into grain-rich and protein-rich parts. The rations were isonitrogenous and isocaloric and DMI and milk production between treatments were similar. Lower concentrations of rumen ammonia, PUN and MUN were measured during the day in the cows receiving the grain supplement before the protein-rich supplement compared with cows receiving the protein-rich supplement first, or cows receiving the protein-rich and energy-rich supplement combined. The values of PUN and MUN of the group receiving the grain supplement first were c. 20 mg N/l lower than for the group receiving the protein supplement first. It is unclear, however, whether this decrease in MUN also caused a different UUN : MUN ratio because UUN was not measured.
For an identical grass/maize silage diet, Geerts et al. (Reference Geerts, De Brabander, Vanacker, De Boever and Botterman2004) tested whether feeding this diet as a mixed grass/maize silage diet or feeding the maize silage in the morning and the grass silage in the evening (after the evening milking) would affect MUN. As expected, MUN in the evening milk was 20 mg N/l higher for the TMR group compared with separate feeding, whereas it was 20 mg N/l lower in the morning milk. Combining the morning and evening milk resulted in a similar MUN for both groups.
Kim et al. (Reference Kim, Choung and Chamberlain1999) tested the effect of intraruminally infusing 2·0 kg of maltodextrin in three time intervals: (1) continuous infusion, (2) two infusion intervals of 6 h each starting at 10.00 and 22.00 h and (3) two infusion intervals of 6 h each starting at 16.00 and 04.00 h. The basal diet (196 g CP/kg DM) was supplied in two equal portions at 10.00 and 22.00 h. In comparing the three infusion time intervals, it appeared that time interval 2, consisting of two infusion intervals of 6 h each starting at 10.00 and 22.00 h, resulted in a 10 mg/l higher MUN (MUN=174) compared with the other 2 infusion intervals and a slightly lower UN : MUN ratio (UN : MUN=0·76) compared with the UN : MUN ratios for time interval 1 and 3 (UN : MUN ratios of 0·79 and 0·83, respectively).
In conclusion, the results indicate a small effect of within-day dynamics of N metabolism on diurnal changes in PUN, MUN and on the UN : MUN ratio. However, solid evidence is lacking and more information is required on the effect of (within day) synchronization of rumen fermented protein and energy on the levels of PUN and MUN and the ratio of UUN : MUN.
COW FACTORS
BW
BW is positively correlated with excretion of the UN and the UN : MUN ratio (Kauffman & St-Pierre Reference Kauffman and St-Pierre2001). This makes sense because at a similar PUN a large animal has a larger pool of blood urea than a small animal, due to the larger urea space volume. Therefore, a reduction in PUN in a large animal requires the excretion of more urea into urine compared with a smaller animal. Kauffman & St-Pierre (Reference Kauffman and St-Pierre2001) found linear relationships between MUN and UN that were different for Jersey and Holstein cows. Per mg N/l of MUN, 1·76 g/day of UN was excreted for Holstein cows compared with 1·18 g/day for Jersey cows. When BW was included in the model, the effect of breed on the UN : MUN ratio was not significant. Furthermore, a within-breed effect of BW on the UN : MUN ratio was shown by Kohn et al. (Reference Kohn, Kalscheur and Russek-Cohen2002). The addition of BW next to MUN in the model resulted in a reduced root mean square prediction error of 33%. Likewise, Zhai et al. (Reference Zhai, Liu, Wu and Ye2007) found in an experiment with lactating Chinese Holstein cows an increased model fit (R 2 increased from 0·82 to 0·99) when, next to MUN, BW was included in the UN prediction model.
Reported regression coefficients of BW×MUN interaction on UN vary slightly: 0·00259 (Kauffman & St-Pierre Reference Kauffman and St-Pierre2001; Kohn et al. Reference Kohn, Kalscheur and Russek-Cohen2002), 0·00283 (Wattiaux & Karg Reference Wattiaux and Karg2004) and 0·00247 (Zhai et al. Reference Zhai, Liu, Wu and Ye2007). It has been suggested that these differences in regression coefficients were caused by differences between studies in the analytical method of MUN determination and/or UN ranges on which the regression coefficient is based (Wattiaux & Karg Reference Wattiaux and Karg2004) or by differences in breeds (Zhai et al. Reference Zhai, Liu, Wu and Ye2007).
In conclusion, the factor BW affects the relationship between UN and MUN.
Genetics
A number of studies report heritability estimates for MUN varying from 0·13 to 0·14 (Stoop et al. Reference Stoop, Bovenhuis and van Arendonk2007; Konig et al. Reference Konig, Chang, von Borstel, Gianola and Simianer2008; Bastin et al. Reference Bastin, Laloux, Gillon, Miglior, Soyeurt, Hammami, Bertozzi and Gengler2009), 0·15 to 0·22 (Mitchell et al. Reference Mitchell, Rogers, Dechow, Vallimont, Cooper, Sander-Nielsen and Clay2005) and 0·44 to 0·59 (Wood et al. Reference Wood, Boettcher, Jamrozik, Jansen and Kelton2003). However, information about the correlation between the breeding value for MUN and the efficiency of N utilization or UN is scarce. Sebek et al. (Reference Sebek, van Riel and de Jong2007) examined the relationship between breeding value for MUN and efficiency of N utilization, using a dataset of 15 720 animal week records, originating from 723 cows from 26 experiments. The model used to calculate the breeding values was corrected for factors including parity, days in milk, location, diet and season. Breeding values for MUN ranged from −23 to 28 mg/l but no significant relationship could be established between the breeding value of MUN and the observed efficiency of N utilization. The range in breeding values for MUN and the absence of a relationship between the breeding value of MUN and the observed N efficiency may be explained by physiological differences between cows with respect to the dynamics of N intake, N digestion, efficiency of N utilization, renal functioning or urea diffusion rates. Excretion of UUN was not measured in the study of Sebek et al. (Reference Sebek, van Riel and de Jong2007), which makes it impossible to draw a conclusion about the effect of genetics on the relationship between UUN and MUN in this study. Vallimont et al. (Reference Vallimont, Dechow, Daubert, Dekleva, Blum, Barlieb, Liu, Varga, Heinrichs and Baumrucker2011) estimated a heritability of 0·57 for MUN. The genetic correlation with the efficiency of N utilization was −0·10 and was not significantly different from zero. On the assumption that a reduced efficiency of N utilization is largely associated with increased excretion of N in urine (Kebreab et al. Reference Kebreab, France, Mills, Allison and Dijkstra2002), this absence of genetic relationship indicates that high breeding values for MUN do not affect the efficiency of N utilization. Together, the results of Sebek et al. (Reference Sebek, van Riel and de Jong2007) and Vallimont et al. (Reference Vallimont, Dechow, Daubert, Dekleva, Blum, Barlieb, Liu, Varga, Heinrichs and Baumrucker2011) suggest that genetic differences in breeding values for MUN are not related to the efficiency of N utilization and do affect the ratio between UUN and MUN, however, more research on this relationship is required.
In conclusion, MUN is moderately heritable but the breeding value of MUN is unrelated to the efficiency of N utilization and probably to UUN as well.
NUTRITIONAL FACTORS
Water intake
The intake level of water affects PUN and subsequently MUN (Weeth & Haverland Reference Weeth and Haverland1961; Weeth & Lesperance Reference Weeth and Lesperance1965; Steiger Burgos et al. Reference Steiger Burgos, Senn, Sutter, Kreuzer and Langhans2001), even when N excretion in urine and faeces did not change (Utley et al. Reference Utley, Bradley and Boling1970). With respect to a restriction in water intake, Schmidt-Nielsen et al. (Reference Schmidt-Nielsen, Schmidt-Nielsen, Houpt and Jarnum1957) observed a four-fold increase of PUN in camels during a water restricted period, whereas the amount of urea excreted in urine remained unchanged. From these results it was concluded that urea excretion via urine is a regulated process, which depends on the need of the animal to preserve urea. In a study from Steiger Burgos et al. (Reference Steiger Burgos, Senn, Sutter, Kreuzer and Langhans2001), dairy cows receiving 0·50 of voluntary water intake had a 1·58 higher MUN than the control group receiving water ad libitum. Unfortunately, no information was given with respect to N intake and N excretion in the study of Steiger Burgos et al. (Reference Steiger Burgos, Senn, Sutter, Kreuzer and Langhans2001), although it is reasonable to assume that a restriction in water intake will not increase N intake (Little et al. Reference Little, Sansom, Manston and Allen1976; Silanikove Reference Silanikove1985; Maloiy et al. Reference Maloiy, Kanui, Towett, Wambugu, Miaron and Wanyoike2008) and that the increase in MUN could not be explained by an increase in dietary N intake.
An increase in water intake due to an increase in salt intake has the opposite effect on PUN as compared with water restriction. In growing Hereford heifers, Weeth & Haverland (Reference Weeth and Haverland1961) observed a decrease in PUN of 27% when water intake was increased (by means of saline water) by 48% from 29 to 43 litres. Likewise, Weeth & Lesperance (Reference Weeth and Lesperance1965) found in a study with Hereford heifers that an increase in water consumption of 52% reduced PUN concentration by 14% at a low dietary protein ration (120 g CP/kg DM) and at a high dietary CP ration (210 g CP/kg DM) PUN was reduced by 4% when water intake was increased by 34%. In a study on sheep, Godwin & Williams (Reference Godwin and Williams1984) observed a reduction in PUN from 680 to, on average, 363 mg/l when water intake was increased by 32% from 1·7 to 2·3 l/day. However, Ergene & Pickering (Reference Ergene and Pickering1978) found no differences in PUN in sheep when urine production was increased upon supply of saline (10 g NaCl/l) drinking water.
Based on the studies mentioned in this section it seems that increased water intake lowers PUN, whereas restricted access to water increases PUN and subsequently MUN. This effect of water intake on MUN is likely to affect the UUN : MUN or the UN : MUN ratios as well in dairy cattle receiving feed rations that vary in mineral content.
Rations rich in minerals such as Na and potassium (K) lead to increased water consumption and urine production (Bannink et al. Reference Bannink, Valk and Van Vuuren1999), thereby decreasing PUN and consequently MUN. Mineral contents of grass silage harvested from N- and K-fertilized grasslands are high compared with the mineral contents in maize silage. For example, average concentrations of K and Na in grass silages in the Netherlands are 34·1 and 2·3 g/kg DM, respectively, whereas average concentrations of K and Na in maize silage are substantially lower, viz. 12·0 and 0·2 g/kg DM (CVB 2007). As a consequence, grass-based rations probably result in a high consumption of K and Na compared with maize-based rations, leading to higher urine production, resulting in lower levels of PUN and MUN and consequently higher UUN : MUN ratios. De Campeneere et al. (Reference De Campeneere, De Brabander and Vanacker2006) and Van Duinkerken et al. (Reference Van Duinkerken, André, Smits, Monteny and Sebek2005) studied the effect of roughage type (maize silage v. grass silage) on MUN and rates of ammonia emission from barns. In comparison with the maize silage diet, De Campeneere et al. (Reference De Campeneere, De Brabander and Vanacker2006) observed a 143% higher urine production for the grass silage diet, whereas Van Duinkerken et al. (Reference Van Duinkerken, André, Smits, Monteny and Sebek2005) estimated 60% higher urine production based on a regression equation of Bannink et al. (Reference Bannink, Valk and Van Vuuren1999) with the grass silage diet. A lower MUN was found for the grass silage rations, which might be attributed in part to the increase in urine production. In the study of De Campeneere et al. (Reference De Campeneere, De Brabander and Vanacker2006), the UN : MUN ratios were 1·13 and 1·41 for the maize and grass-based rations, respectively. However, confounding factors such as differences in DMI and dietary protein intake, and extent of rumen hindgut fermentation, prohibit the drawing of solid conclusions.
Schmidt-Nielsen et al. (Reference Schmidt-Nielsen, Osaki, Murdaugh and O'Dell1958) studied the effect of rising or decreasing urine production rates (at equal dietary N intake) by means of an intravenous mannitol or glucose infusion on UUN and observed that during periods of rising urine flow UUN was increased by 35%, whereas during periods of decreasing urine flow UUN was decreased until a steady-state urine flow was reached again. The temporary increase in UUN during a rising urine flow results in a decreased urea blood plasma pool and, as a consequence, a reduced level of PUN. This mechanism of temporary change in UUN during periods of increasing or decreasing urine flows might actually be responsible for the difference in PUN levels found in the previously described experiments from De Campeneere et al. (Reference De Campeneere, De Brabander and Vanacker2006), Van Duinkerken et al. (Reference Van Duinkerken, André, Smits, Monteny and Sebek2005) and Steiger Burgos et al. (Reference Steiger Burgos, Senn, Sutter, Kreuzer and Langhans2001).
The negative correlation between PUN and urine production may be explained firstly by the fact that renal blood flow is increased at increasing water intake and urine production, and secondly by the fact that urea is used as an osmolite in the kidneys to concentrate urine. At high urine production there is less need to concentrate urine, and urea concentration in the interstitial cells of the inner medulla may fall (Rabinowitz & Gunther Reference Rabinowitz and Gunther1974). A low urea concentration in the inner medulla probably results in low quantities of urea transported back to blood circulation by the ascending vasa recta located in the inner medulla in the kidney, whereas the opposite might happen during periods of low urine production.
In conclusion, both water restriction and increased water intake affects the PUN, MUN and UN : MUN ratios, with water restriction having the highest impact on the level of the PUN, MUN and UN : MUN ratios.
Dietary protein concentration
In a previous section it was shown that the dietary concentration of protein affects the expression of UT proteins in the inner medullary collecting duct of the kidneys. This altered expression is likely to affect renal urea reabsorption, the relationship between PUN and UUN and as a result the relationship between MUN and UUN. For example, Olmos Colmenero & Broderick (Reference Olmos Colmenero and Broderick2006) tested the effect of dietary CP on milk production by varying the dietary CP content from 135 to 194 g/kg DM: the UUN : MUN ratio increased from 0·82 at 135 g CP/kg DM to 1·33 at 194 g CP/kg DM. The results of Olmos Colmenero & Broderick (Reference Olmos Colmenero and Broderick2006) were confirmed in a study from Borucki Castro et al. (Reference Borucki Castro, Phillip, Lapierre, Jardon and Berthiaume2008) in which the UUN : MUN ratio increased from 1·02 at 162 g CP/kg DM to 1·35 at 201 g CP/kg DM.
Figure 4 shows the results from a meta-analysis, based on 23 trials, in which the relationship between dietary CP concentration and the UUN : MUN ratio was studied. The linear plateau relationship that was found indicated an increased renal reabsorption rate of urea (possibly combined with a decreased glomerular filtration rate) at decreasing dietary CP concentrations (lower than 170 g CP/kg diet DM), whereas at dietary protein levels exceeding 170 g CP/kg DM the UUN : MUN ratio did not change, indicating an unchanged renal reabsorption rate of urea.

Fig. 4. Relationship between dietary content of CP (g CP/kg DM) and the ratio between UUN excretion (g N/day) and MUN concentration (mg N/l). A quadratic broken line model yielded the best model fit. The model: UUN : MUN=L+U× (R − CP)2, where (R − CP)2 is zero at values of CP above a threshold CP content R (g CP/kg DM). The model is adapted from Robbins et al. (Reference Robbins, Saxton and Southern2006). The value of L as the maximum UUN : MUN was 1·25±0·028, and the value of U as the decline parameter was –0·000 374±0·000 1822, and the threshold value of R as CP at which the maximum UUN : MUN is reached was 170±8·3. The model was derived from 102 observations collected in 23 experiments (references available on request).
In conclusion, the level of dietary CP affects the UUN : MUN ratio and the relationship between dietary CP concentration. The UUN : MUN ratio can be described by a quadratic broken stick model.
Non urea N excretion in urine
High UN : MUN ratios might be expected at low levels of PUN, MUN and intake of CP because of the quantity of nitrogen excreted in urine excluding urea nitrogen (NUUN; g N/day) excreted in urine is, probably largely unrelated to urea levels in the blood and milk. The quantity of NUUN can be calculated as the intercept value from MUN–UN regression formula. Intercept values between 25 and 56 g N/day have been reported (Ciszuk & Gebregziabher Reference Ciszuk and Gebregziabher1994; Gonda & Lindberg Reference Gonda and Lindberg1994; Zhai et al. Reference Zhai, Liu and Ma2005, Reference Zhai, Liu, Wu and Ye2007). Another way of estimating NUUN is to take the intercept value of the regression equation where UN is regressed on UUN (Fig. 2), yielding in the current study a value of 51·9 g N/day.
An exponential relationship between NUUN and MUN was observed based on a meta-analysis of results from 20 trials (Fig. 5) in which the NUUN : MUN ratio is negatively related to MUN. This negative relationship between the NUUN : MUN ratio and MUN should be considered when UUN is estimated based on data from UN and MUN. Bristow et al. (Reference Bristow, Whitehead and Cockburn1992) found that the main N constituents in cattle urine were urea (0·70), allantoin (0·08), hippuric acid (0·06), creatinine (0·04), creatine (0·03), and ammonia (0·03). An increase in DMI (and fermentable organic matter) is likely to result in increased rumen microbial protein synthesis and an increase in NUUN due to an increase in excretion of purine derivatives (mainly allantoin derived from rumen microbial nucleic acids) and hippuric acids (derived from plant phenolic cinnamic acids). Hence, an increase in DMI is likely to increase NUUN excretion, although its effect on total UN secretion will remain small considering the small contribution of hippuric acids and allantoin to UN.

Fig. 5. Relationship between MUN concentration (mg N/l) and the ratio between NUUN (g N/day) and MUN. An exponential model yielded the best model fit. NUUN : MUN ratio=1·368±0·2067×exp(–0·0104±0·00133×MUN). The model was derived from 84 observations collected in 20 experiments (references available on request).
In conclusion, a decrease in MUN will be associated with an increased NUUN : MUN ratio. This fact should be considered when estimating the excretion of UUN based on UN.
Rumen pH and concentration of CO2, butyrate and ammonia
Fast v. slow rumen fermentable carbohydrate diets have been shown to affect the flux of urea from blood to rumen liquid across the rumen wall (Kennedy et al. Reference Kennedy, Clarke and Milligan1981; Norton et al. Reference Norton, Janes and Armstrong1982). This effect of the type of carbohydrate on urea flux might affect the ratio of UUN : MUN as well. Rumen fermentation of ingested feed yields fermentation products including short chain fatty acids, ammonia and CO2. High production rates of short chain fatty acids after a meal result in a lowered rumen pH. Studies show that rumen pH and concentrations of CO2 and butyrate are correlated with the transport rate of ammonia and urea across the rumen wall (Thorlacius et al. Reference Thorlacius, Dobson and Sellers1971; Rémond et al. Reference Rémond, Chaise, Delval and Poncet1993; Abdoun et al. Reference Abdoun, Stumpff, Wolf and Martens2005, Reference Abdoun, Stumpff, Rabbani and Martens2010). For example, Abdoun et al. (Reference Abdoun, Stumpff, Wolf and Martens2005) observed that ammonia fluxes across cell walls of isolated rumen epithelia of sheep at equal ammonia levels decreased when mucosal pH was lowered from 7·4 to 6·9 and from 6·9 to 6·4. In another study from Abdoun et al. (Reference Abdoun, Stumpff, Rabbani and Martens2010) on urea transport across the isolated rumen epithelia of sheep, the effect of rumen pH on the net transfer of blood urea across the rumen wall of sheep was found to be highest at pH 6·2 and would decrease rapidly at higher or lower pH values. Besides the effect of rumen pH, it has been shown in a number of studies that ruminal concentrations of CO2 and/or butyrate stimulate urea transport from blood to rumen (Thorlacius et al. Reference Thorlacius, Dobson and Sellers1971; Norton et al. Reference Norton, Janes and Armstrong1982; Rémond et al. Reference Rémond, Chaise, Delval and Poncet1993; Abdoun et al. Reference Abdoun, Stumpff, Rabbani and Martens2010). It has been suggested that the effect of CO2 on the flow of blood urea across the rumen is caused by an increase in the blood flow to the rumen epithelium; however, no relationship was found in the study of Dobson et al. (Reference Dobson, Sellers and Thorlacius1971) between rumen blood flow and urea transport. Furthermore, the pure unconfounded effect of blood flow on ammonia transport from the rumen to the blood has not yet been elucidated.
Another factor that affects blood–rumen urea transport is the concentration of rumen ammonia. Cheng & Wallace (Reference Cheng and Wallace1979) found a negative correlation between rumen urease activity and rumen ammonia concentration and suggested a mechanism of decreased urea transport at increased concentration of rumen ammonia. Such a negative correlation between urease activity in the rumen (epithelium) and urea transport across the rumen wall could explain the up to 13-fold increase of urea transport across the non-rinsed rumen wall v. the water-rinsed rumen wall in the study of Houpt & Houpt (Reference Houpt and Houpt1968), or the negative correlation between rumen ammonia level and urea transport across the rumen wall found in the studies of Kennedy et al. (Reference Kennedy, Clarke and Milligan1981) and Rémond et al. (Reference Rémond, Chaise, Delval and Poncet1993).
Hristov et al. (Reference Hristov, Ropp, Grandeen, Abedi, Etter, Melgar and Foley2005) tested the effect of the type of carbohydrate on rumen ammonia utilization and observed that starch- and glucose-rich diets resulted in lower concentration of rumen ammonia, PUN and MUN compared with a neutral detergent fibre (NDF)-rich diet. The NDF-rich diet resulted in a lower UN : MUN ratio (UN : MUN=1·51) than the starch- and glucose-rich diets (UN : MUN of 1·64 and 1·62, respectively). Similar results were found by Beckman & Weiss (Reference Beckman and Weiss2005) and Broderick (Reference Broderick2003). This effect of the type of carbohydrate on the UN : MUN ratio could have been affected by rumen microbial protein synthesis and its effect on the level of rumen ammonia.
In conclusion, experimental evidence indicates that urea transport across the rumen wall is subject to regulation, being stimulated after a meal when rumen concentrations of CO2 and butyrate are high. The type of dietary carbohydrate will affect the rate of fermentation and profile of short chain fatty acids and the magnitude of ammonia levels in rumen fluid and thus is likely to influence the dynamics of PUN and thereby the UUN : MUN ratio. However, the sole effect of rumen pH and ruminal concentration of CO2 and butyrate on the UUN : MUN ratio remains to be tested.
ANALYSIS METHODS
Variation in MUN within and between experiments might partly be attributed to the method of urea analysis. Differences between urea analysis methods and devices or laboratories may lead to systematic differences in MUN between studies. Peterson et al. (Reference Peterson, French, Russek-Cohen and Kohn2004) compared a number of analytical devices and methods on the analysis of milk samples and the recovery of MUN from urea spiked milk samples. Recovery of MUN varied from 0·85 to 0·95 and the standard error (s.e.) varied from 0·028 to 0·076 for the enzymatic analysis methods (based on conversion of urea to ammonia by the enzyme urease), whereas for the infra-red-spectrometry methods recovery of MUN varied from 0·47 to 0·95 and the s.e. varied from 0·099 to 0·101. Also, some disturbing effects of level of urea, fat, lactose and protein in the milk on recovery of MUN were found for both methods. Similar disturbing effects of level of urea, fat and protein in the milk on analysis of MUN were observed by Kohn et al. (Reference Kohn, French and Russek-Cohen2004). Broderick (Reference Broderick2003) regressed the values of MUN determined with an enzymatic method on the values of MUN determined with infra-red-spectrometry and found a low correlation coefficient of 0·20. Regression of data in the current study (not shown) between the MUN values determined with an enzymatic method and the values determined with infra-red-spectrometry yielded a correlation coefficient of 0·81 and it appeared that enzymatically determined MUN values smaller than 30 mg/l yielded MUN values of zero when analysed by infra-red-spectrometry, indicating a high lower limit of detection for MUN by infra-red-spectrometry. Finally, in studies in the USA, systematic differences in the MUN and UN : MUN or UUN : MUN ratios might be present between studies having their milk samples analysed before and after 1998 due to a hardware defect in MUN analysers of DHIA laboratories (Kohn et al. Reference Kohn, Kalscheur and Russek-Cohen2002).
In conclusion, the high variability of recovered urea measured by means of infra-red-spectrometry and the low correlation coefficients found between MUN analysed enzymatically and MUN analysed by infra-red-spectrometry indicates the necessity of analysing MUN by means of an enzymatic method in order to obtain accurate data to be used to study the relationship between UUN and MUN.
CONCLUSIONS AND FUTURE PERSPECTIVES
A number of factors have been shown to affect the relationship between PUN, MUN, UUN and UN. Factors such as BW, water intake, urine production, dietary protein level and time and frequency of feeding and milking are shown to affect the relationship between MUN and UUN. Accounting for the effects of these factors on the relationship between MUN and UUN can increase the applicability and accuracy of MUN as a predictor of protein utilization efficiency and UUN, and may explain differences in MUN-UN regression formulas and their prediction results between studies. Owing to many factors that affect the MUN, UUN and the UUN : MUN ratios, a mechanistic modelling approach seems appropriate to predict the relationship between MUN and UUN.


