


Introduction
The sustainability of Irish dairy and drystock farms is dependent on increased productivity and improved efficiency of the conversion of grazed pasture to animal products (Hanrahan et al., Reference Hanrahan, Geoghegan, O'Donovan, Griffith, Ruelle, Wallace and Shalloo2017). The removal of European Union milk quota regime has allowed the Irish dairy industry to increase cow numbers facilitated by increased land area associated with dairying (Kelly et al., Reference Kelly, Shalloo, Wallace and Dillon2020). The Department of Agriculture, Food and the Marine Food Wise 2025 strategy set out as its guiding principal that environmental protection and economic competitiveness would be equally considered and complementary; one was not to be achieved at the expense of the other. While the Irish dairy industry expands, the European Green Deal announced by the European Commission in December 2019 has also identified the requirement to reduce nutrient losses by 50% and fertilizer inputs by 20% by 2030 compared to the base year of 2018.
Nitrogen (N) is essential for plants and it plays a key role in food production being among the most important crop yield-limiting factors in the world together with water (Mueller et al., Reference Mueller, Gerber, Johnston, Ray, Ramankutty and Foley2012). At the same time, N losses contribute to climate change and lead to environmental pollution which is harmful for the functioning of ecosystems and human health (Galloway et al., Reference Galloway, Townsend, Erisman, Bekunda, Cai, Freney, Martinelli, Seitzinger and Sutton2008; Fowler et al., Reference Fowler, Coyle, Skiba, Sutton, Cape, Reis, Sheppard, Jenkins, Grizzetti and Galloway2013). Despite the positive effects of N fertilizer on agricultural production (Whitehead, Reference Whitehead1995), the efficiency with which N is used is variable (Watson and Atkinson, Reference Watson and Atkinson1999). Recent studies have suggested that current N losses from agriculture to the environment are too high (Steffen et al., Reference Steffen, Richardson, Rockström, Cornell, Fetzer, Bennett, Biggs, Carpenter, De Vries and De Wit2015) and continuing population and consumption growth in the next few decades will increase the demand for N fertilizer and increase N losses unless significant improvements are made in the whole food production–consumption chain (Godfray et al., Reference Godfray, Beddington, Crute, Haddad, Lawrence, Muir, Pretty, Robinson, Thomas and Toulmin2010; Sutton et al., Reference Sutton, Bleeker, Howard, Erisman, Abrol, Bekunda, Datta, Davidson, De Vries and Oenema2013; Mogollón et al., Reference Mogollón, Lassaletta, Beusen, Van Grinsven, Westhoek and Bouwman2018).
Within temperate grass-based dairy systems, there is a reliance on matching feed supply (grass growth) and feed demand (managed through calving date, stocking rate (SR) and strategic supplementation). There is a high reliance on climate conditions associated with the production of animal feed harvested by ruminants. The foundation of this production system is productive grassland and efficient grass utilization over a prolonged grazing season (Shalloo and Hanrahan, Reference Shalloo and Hanrahan2020). Such systems are unique in balancing pasture utilization and maintaining high animal dry matter intake (DMI) and performance, while reducing and minimizing imported feed and fertilizer. The beneficial impacts of high SR on grazing system productivity are widely reported (McCarthy et al., Reference McCarthy, Delaby, Pierce, McCarthy, Fleming, Brennan and Horan2016; Coffey et al., Reference Coffey, Delaby, Fleming, Pierce and Horan2018); the impacts of SR on the environment need to be fully considered. Previously increased SR was associated with increased chemical fertilizer use and reliance on imported feed, greater nutrient surpluses and reduced nutrient-use efficiency, resulting in increased losses to groundwater and the general environment (Hennessy et al., Reference Hennessy, Delaby, Van Den Pol-Van Dasselaar and Shalloo2020). Both McCarthy et al. (Reference McCarthy, Delaby, Hennessy, McCarthy, Ryan, Pierce, Brennan and Horan2015) and Roche et al. (Reference Roche, Ledgard, Sprosen, Lindsey, Penno, Horan and Macdonald2016) investigated the direct effect of SR on nitrate-N leaching and both studies reported either stable or declining nitrate-N leaching with increasing SR; however, strictly no additional N fertilizer or supplements were introduced at higher SR.
Currently, Irish dairy farms that have a derogation from the Nitrates Directive (91/676/EEC) can legally apply up to 250 kg N fertilizer/year in conjunction with an organic N loading of a maximum of 250 kg N/ha/year, corresponding to an annual SR of 2.75 cows/ha. However, water quality has been declining in recent years (EPA, 2019) and so there is an overall requirement to reduce chemical N fertilizer use, the impact of variation in the rate of N applied needs to be investigated. The objective of this paper is to investigate the influence of chemical N fertilizer application rate on grass yield, stock carrying capacity (through forage self-sufficiency at different SRs) and N surplus. The pasture-based herd dynamic milk (PBHDM) model (Ruelle et al., Reference Ruelle, Shalloo, Wallace and Delaby2015) merged with the Moorepark St Gilles grass growth (MoSt GG) model (Ruelle et al., Reference Ruelle, Hennessy and Delaby2018a) was used to simulate a 40 ha farm. The number of cows, soil type, fertilizer application and weather were changed for each simulation, resulting in 140 simulations over 16 climate years. The main model outputs were daily grass growth, cow DMI and silage fed, and farm N surplus.
Materials and methods
Overall summary of the models
The PBHDM model (Ruelle et al., Reference Ruelle, Shalloo, Wallace and Delaby2015, Reference Ruelle, Delaby, Wallace and Shalloo2016) simulates a dairy farm at the paddock and cow level. The model simulates each individual animal at grazing and is dependent on animal characteristics but also on grass availability with a reduction in animal DMI during the defoliation process included in the model. Within the model, grassland management-based decision rules are included to ensure realistic simulations. Animals move from one paddock to another based on a fixed residency time in the paddocks or based on an objective post-grazing height, which can be either fixed or dependent on the pre-grazing height. The farm grass cover is evaluated daily and is compared with the animal requirement. In situations where there is a farm grass cover excess on the overall farm, some paddocks can be allocated for silage conservation rather than grazed and vice versa. In the case of a grass deficit (subject to the management rules defined by the user), forage or concentrate supplementation can be added to the diet (Ruelle et al., Reference Ruelle, Shalloo, Wallace and Delaby2015).
The PBHDM model was evaluated by comparing model outputs with two grazing systems in France and in Ireland (Ruelle et al., Reference Ruelle, Shalloo, Wallace and Delaby2015). Model outputs that were compared to the actual experimental data were milk production, pre- and post-grazing sward height and feed supplementation levels. These outputs were all compared on a weekly basis while paddock residence time and total grass harvested and conserved as grass silage was evaluated over the entire grazing season.
Grass growth in the PBHDM model is predicted by the MoSt GG model (Ruelle et al., Reference Ruelle, Hennessy and Delaby2018b) which is fully integrated within the PBHDM (Ruelle et al., Reference Ruelle, Shalloo, Wallace and Delaby2015). The MoSt GG model (Ruelle et al., Reference Ruelle, Hennessy and Delaby2018a) is a dynamic model developed in C++ describing the grass growth of perennial ryegrass swards and the N and water fluxes of a paddock. The model operates with a daily time step simulating soil N mineralization, immobilization and water balance, grass growth, grass N uptake and grass N content. The model operates through a daily potential growth which is dependent on solar radiation and the total green biomass. To calculate the actual daily growth, this potential growth is then multiplied by parameters depending on environmental conditions (temperature, water in the soil and radiation) and a parameter depending on the soil mineral N availability compared to the N demand associated with potential grass growth. The MoSt model has been validated against various historical data (Ruelle et al., Reference Ruelle, Hennessy and Delaby2018a, Reference Ruelle, Hennessy and Delaby2018b; Ruelle and Hennessy, Reference Ruelle, Hennessy, O'Brien, Henessy and Shallo2019) and is currently being used to predict grass growth weekly on 78 commercial farms in Ireland (Ruelle and Hennessy, Reference Ruelle, Hennessy, O'Brien, Henessy and Shallo2019; Ruelle et al., Reference Ruelle, Delaby and O'Donovan2021).
Model simulations
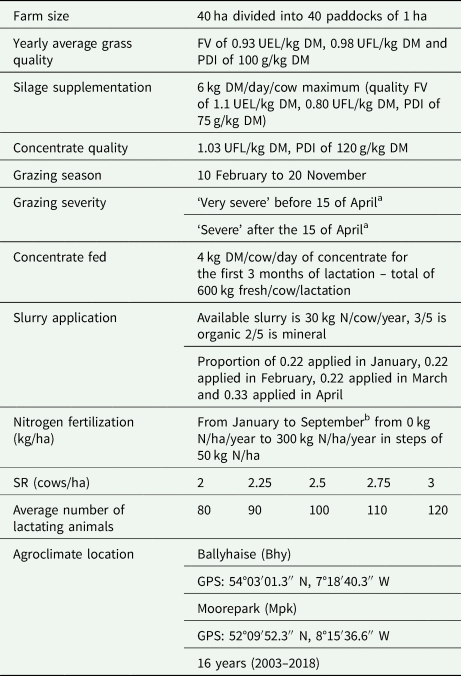
Currently, Ireland has a derogation from the Nitrates Directive (91/676/EEC) allowing a maximal annual organic N loading of 250 kg N/ha (equivalent to an SR of 2.75 cows/ha) in conjunction with a maximal chemical fertilizer application of 250 kg N/ha/year for the farms in derogation. This paper is focused on grazing dairy farm with SRs between 2.0 and 3.0 cows/ha. The descriptions of the simulations are summarized in Table 1. Farm size was fixed at 40 ha and included 40 paddocks. A total of 140 main scenarios were analysed:
(1) Stocking rate – five stocking rates – 2, 2.25, 2.5, 2.75 and 3 cows/ha.
(2) Fertilizer N application rate – seven rates – 0 to 300 kg N/ha/year increasing by a step of 50.
(3) Soil type – two soil types – a free-draining soil (FDS: 6% organic matter (OM), proportion of 0.60 sand and 0.15 clay, soil depth of 100 cm) corresponding to a Moorepark soil type and a heavy soil (HS: 8% OM, proportion of 0.28 sand and 0.36 clay, soil depth of 100 cm) corresponding to a Ballyhaise soil type, those two soil types are the extremes of the soil types found on intensive Irish dairy farms.
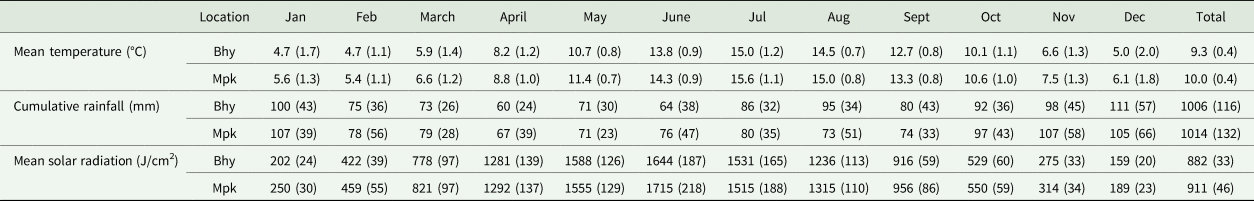
(4) Agroclimate location – two weather locations were used – Ballyhaise (Bhy: 2003–18, 54°03′01.3″ N, 7°18′40.3″ W) corresponding to the north of the country and Moorepark (Mpk: 2003–18, 52°09′52.3″ N, 8°15′36.6″ W) corresponding to the south of the country with data being provided by Met Eireann (the Irish Meteorological Service; www.met.ie) synoptic weather stations on the farm sites. The weather data are presented in Table 2.
Table 1. Description of input parameters of the simulations to the PBHDM model
UFL, ‘Unité Fourragère lait’ 1 UFL = 7.1 MJ of net energy for lactation (NEL); PDI, ‘Protéine Digestible dans l'intestin’ protein unit, UEL, ‘Unité d'Encombrement Lait’, Fill value unit (Faverdin et al., Reference Faverdin, Baratte, Delagarde and Peyraud2011; INRA, 2010).
a Calculation of the objective post grazing sward height (obj_postGH) depending on the pre grazing sward height (preGH) and the severity of the grazing:
Severe: obj_postGH = 4 − 0.1 × preGH + 0.015 × preGH2.
Very severe: obj_postGH = 3.5 − 0.1 × preGH + 0.015 × preGH2.
b Proportion of 0.06 applied in January, 0.05 applied in February, 0.17 applied in March, 0.21 applied in April, 0.12 applied in May, 0.14 applied in June, 0.09 applied in July, 0.09 applied in August and 0.07 applied in September based on Teagasc recommendations.
Table 2. Monthly description of the meteorological data at the two agroclimate locations (sd)
For each scenario, simulations were completed for 16 years on a continuous cycle, meaning that some events occurring in year 1 could have consequences in year 2 and so on.
Annual feeding management
The feeding system used is the INRA feeding system (INRA, 2010) where the quality of feed is characterized by its energy value (UFL ‘Unité Fourragère Lait’; 1 UFL is the equivalent of 7.1 MJ of net energy for lactation, corresponding to the net energy for maintenance and lactation available from 1 kg of air-dried rolled barley), protein (PDI ‘protéine digestible dans l'intestin’) and fill value (FV expressed in UEL ‘Unité d'Encombrement Lait’; 1 UEL is the equivalent to an intake of 140 g DM/kg of metabolic bodyweight (BW0.75)). Concentrate does not have a fixed FV as it depends on the substitution rate between concentrate and silage. In the simulation, concentrate supplementation (1.03 UFL/kg DM, PDI of 120 g/kg DM) was fed at the rate of 4 kg DM/day/cow for the first 5 months of lactation irrespective of the grass available on the farm resulting in a concentrate feeding level of 600 kg fresh/cow/lactation following Teagasc recommendations. No additional concentrate has been fed during the rest of the lactation. The grazing season was from 10 February to 20 November, irrespective of the amount of grass on the farm, and only lactating cows were allowed to graze. While indoors, lactating cows were fed grass silage ad libitum (quality FV of 1.1 UEL/kg DM, 0.80 UFL/kg DM, PDI of 75 g/kg DM), dry cows were offered 80% of the ad libitum intake of the lactating cows (around 10 kg of DM of silage/cow/day). During the grazing season the only reason the herd could return indoors was if the paddocks were deemed ungrazable due to waterlogged soil (i.e. if the soil water content was greater than 90% of saturation level), in that case cows were fed ad libitum grass silage indoors.
As the model does not predict the grass nutritive value, the grass quality was constant throughout the simulations at 0.98 UFL/kg DM, PDI of 100 g/kg DM and FV of 0.93 UEL/kg DM. As the model describes the reduced intake during the defoliation process, the value of 0.93 UEL/kg DM corresponds to the FV at the start of grazing in a paddock and reduces as the grass height in the paddock declines (Ruelle et al., Reference Ruelle, Shalloo, Wallace and Delaby2015).
Grazing management and supplementation
The lactating herd moves from one paddock to another based on an objective post-grazing sward height which is dependent on the pre-grazing sward height (Table 1). The farm grass cover (i.e. quantity of grass available on the farm; kg DM/ha) is evaluated daily and is compared with the herd requirement. In situations where there is an excess farm grass cover on the overall farm, some paddocks are allocated for silage conservation rather than grazing and vice versa. In the case of a grass deficit, grass silage can be fed up to 6 kg DM/cow. In the simulations, priority is always given to grazing over silage; it is assumed that silage would always be available to purchase onto the farm.
Fertilizer management
The different annual levels of N fertilizer application simulated were 0–300 kg N/ha with steps of 50 kg N/ha. For each simulation the mineral N fertilizer was applied from 15 January to 15 September with the repartition of application as follows: proportion of 0.06 in January, 0.05 in February, 0.17 in March, 0.21 in April, 0.12 in May, 0.14 in June, 0.09 in July, 0.09 in August and 0.07 in September based on pre-2022 Teagasc recommendations (Wall and Plunkett, Reference Wall and Plunkett2021). As an example, the N fertilizer application rates for the months of January, February, March, April, May, June, July, August and September used to simulated 100 and 300 kg N/ha were 6 and 18 kg N/ha, 5 and 15 kg N/ha, 17 and 51 kg N/ha, 21 and 63 kg N/ha, 12 and 36 kg N/ha, 14 and 42 kg N/ha, 9 and 27 kg N/ha, 9 and 27 kg N/ha, 7 and 28 kg N/ha, respectively. Slurry was applied to the farm from January to April as follows: proportion of 0.22 in January, 0.22 in February, 0.22 in March and 0.33 in April. The quantity of slurry produced was 30 kg/cow/year (based on 20 kg collected during the housing period and 10 kg during milking throughout the year), assuming 2/5 was mineral N and 3/5 was organic N.
Model outputs
The main outputs from the simulations are grass growth (kg DM/ha), N response (kg DM/kg N applied), number of grazing days, number of days at grazing without silage supplementation, grass intake (kg/cow and kg/ha), silage fed (at grazing, indoor for lactating and indoor for dry cow in kg DM/cow and kg DM/ha), milk, protein and fat produced (kg/cow and per ha), amount of silage produced (kg/ha) and yearly surplus or deficit of silage (kg/ha). All outputs are extracted per day and are then summarized by week, season and year for the full simulation. Annual farm gate N surplus was calculated for all years for each simulation. The calculation included all purchased N and N sales, but excluded net mineralization and atmospheric deposition. The equation for the annual N surplus (kg N/ha) was Nin − Nout where:

With 6.25 as the kjeldahl conversion factor for feed and 18.1 the average protein percentage of concentrate feed (kg DM, DAFM, private report):

With 6.25 as the kjeldahl conversion factor for feed and with 13.5 the average protein content of silage feed (kg DM, DAFM, private report):
fertilization was the chemical N fertilizer applied (kg N/ha/year):


with 6.38 as the kjeldahl conversion factor for milk.
Cow weight gain was included at 35 kg/year to calculate an annualized net increase in liveweight from when a cow enters the herd as a replacement heifer and leaves as a cull cow. The liveweight of a calf when the calf leaves the farm was assumed to be 40 kg. It was assumed that calves had a N content of 0.029 kg N/kg body weight and the cow liveweight gain had a N content of 0.024 kg N/kg body weight (ARC, 1994) resulting in the following equation:

with 6.25 as the kjeldahl conversion factor for feed and with 13.5 the average protein content of silage feed (kg DM, DAFM, private report).
Results
Grass dry matter yield
The average annual grass DM yield across scenarios and years was 12 424 kg DM/ha, with a minimum grass yield of 4971 kg DM/ha (SR 2 cows/ha, 0 kg/ha/year fertilizer, FDS, Mpk, 2018) and a maximum grass yield of 17 452 kg DM/ha (SR 3 cows/ha, 300 kg/ha/year fertilizer, HS, Mpk, 2011) (Table 3).
Table 3. Impact of soil type, agroclimate location and N application rate (kg N/ha) on seasonal grass yield kg DM/ha (sd) and N response (kg DM/kg N)

a Spring: 1 February to 30 April; summer: 1 May to 31 July; autumn: 1 August to 31 October.
On average, across all years, at 250 kg/ha/year of chemical N and SR 2.5 cows/ha, the average annual grass yield was of 13 816 kg DM/ha for MpkFDS, 13 841 kg DM/ha for BhyFDS, 14 978 kg DM/ha for MpkHS and 14 441 for BhyHS. While the average yield for the two FDS types was close, variation was higher for the MpkFDS: ranging from 9420 kg DM/ha in 2018 to 15 573 kg DM/ha in 2011 (±1787) compared to 12 479 kg DM/ha in 2018 and 155 521 kg DM/ha in 2017 (±926) for BhyFDS. This higher variation with the MpkFDS was associated with drought years of 2006, 2013 and 2018, coupled with poor autumn growth (average 1660 kg DM/ha), while for those years, at the Bhy location there was significant autumn growth (average 3772 kg DM/ha).
For the HSs, the annual grass yield variation was similar for the two weather patterns and there was higher yield for MpkHS ranging from 13 645 kg DM/ha in 2012 to 16 500 kg DM/ha (±945) in 2007 and from 12 604 to 16 351 kg DM/ha (±971) in BhyHS.
On average for each 0.25 point increase in SR, there was an increase in annual grass yield of 182 kg DM/ha. This increase in yield reduced as SR increased (193 kg DM/ha when SR increased from 2 to 2.25 cows/ha and 162 kg DM/ha when it increased from 2.75 to 3 cows/ha). There was a greater increase in annual grass yield with increased SR when no fertilizer was applied (average 275 kg DM/ha) compared to when fertilizer N was applied (108 kg DM/ha at 300 kg N/ha/year).
The growth during winter (1 November to 31 January) was lower under Bhy conditions (average 353 kg DM/ha) than Mpk conditions (average 452 kg N/ha) due to colder weather conditions. It was lower for the HS (average 307 kg DM/ha) than for the FDS (average 501 kg DM/ha) due to the HS being easily flooded during this period. In spring (1 February to 30 April) growth was lower under Bhy conditions (average 2112 kg DM/ha) than Mpk conditions (average 2360 kg DM/ha). The HS had a higher grass growth during the spring than the FDS (average of 2331 and 2150 kg DM/ha, respectively). In summer (1 May to 31 July), on average, growth was very similar for the two agroclimate locations, however it was higher for the HS (average 6742 kg DM/ha) than for the FDS (average 6070 kg DM/ha) due to being less prone to soil moisture deficit. In autumn (1 August to 31 October) growth was more variable among soil types and weather conditions. On average, growth was highest for MpkHS (3587 kg DM/ha) followed closely by BhyHS (3486 kg DM/ha). It was the opposite for the FDS with the MpkFDS (3071 kg DM/ha) being lower than the BhyFDS (3354 kg DM/ha). This is due to a warmer weather in the autumn at Mpk, better for grass growth, but also linked to a lower rainfall, resulting in a drought in August leading to a growth decrease on the MpkFDS. In autumn, the MpkFDS had higher growth variability with a standard deviation (sd) of 1035 kg DM/ha compared to 528 kg DM/ha for the BhyFDS and around 611 kg DM/ha for the HS simulations.
While, on average across all the years, weather and annual grass yield at both locations are similar (Table 2), Fig. 1 highlights the possible differences in growth pattern for the same year at the two locations. Figure 1 presents the weekly average grass growth for all years at the two locations and for the two soil types, which highlights two extreme years of 2011 and 2018. Figure 1 highlights the higher water retention by the HS but also the difference in the weather events between Bhy and Mpk with a greater drought at Mpk than at Bhy.
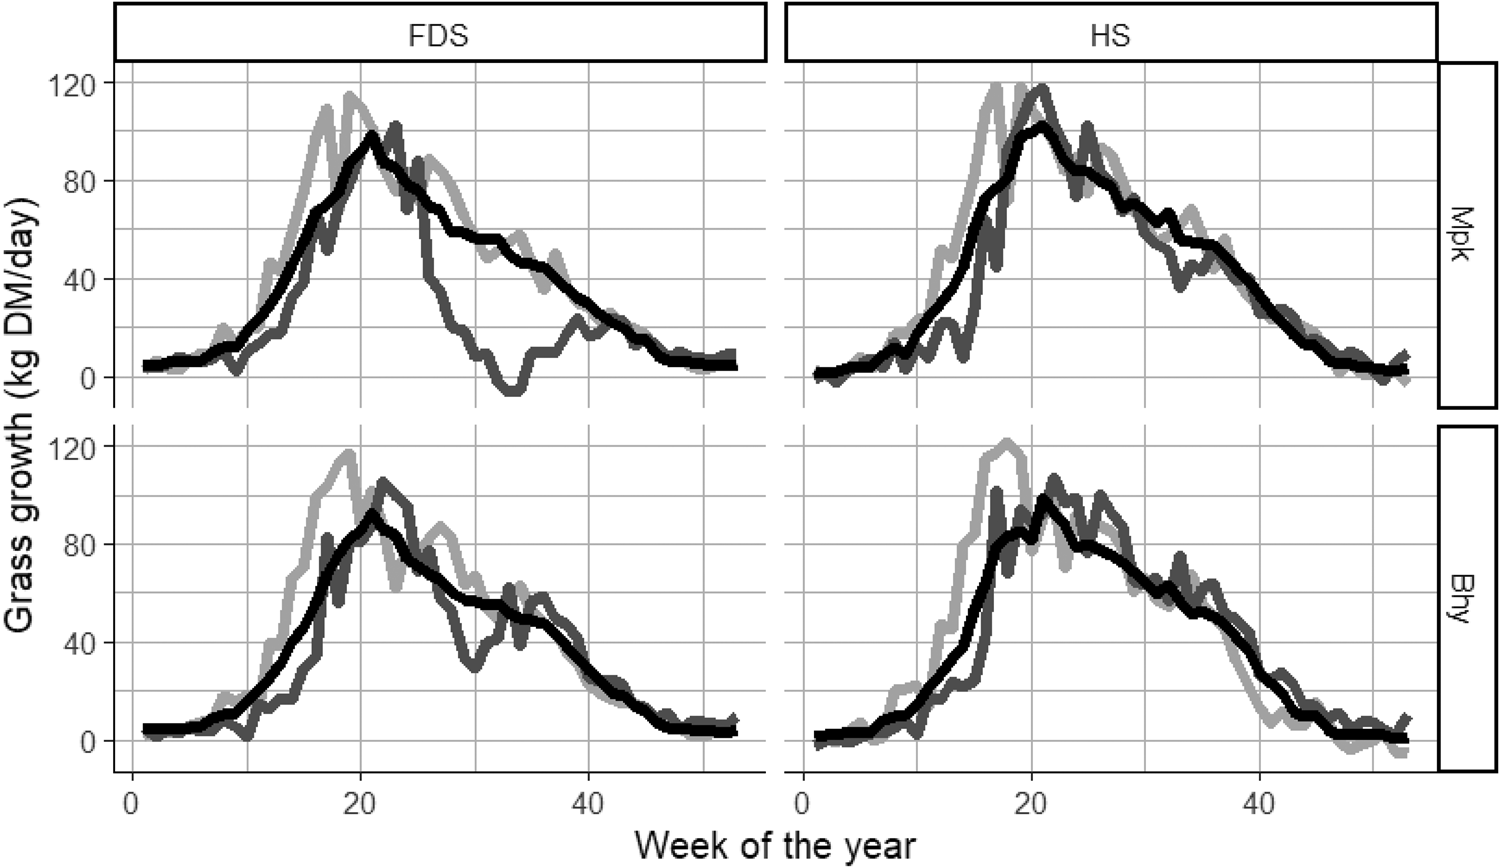
Fig. 1. Representation of the variability of the mean grass growth by week of the year. In black average grass growth across the year, light grey grass growth in the year of 2011 (good growing year), dark grey average grass growth in 2018 (drought year). Mpk, Moorepark; Bhy, Ballyhaise; FDS, free-draining soil; HS, heavy soil.
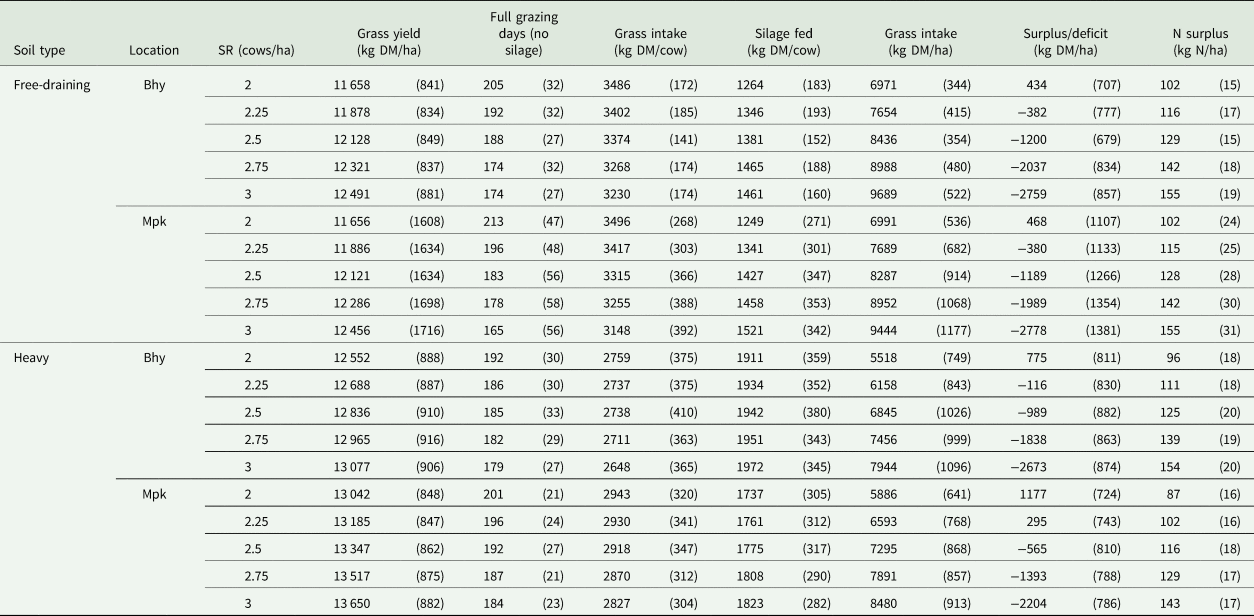
Annual grass yield, number of days without silage supplementation, grass intake per cow, silage fed per cow, grass intake per ha and grass surplus or deficit per ha for all SRs are presented in Tables 4 to 6 for the annual fertilizer application rates 250, 200 and 150 kg N/ha/year, respectively.
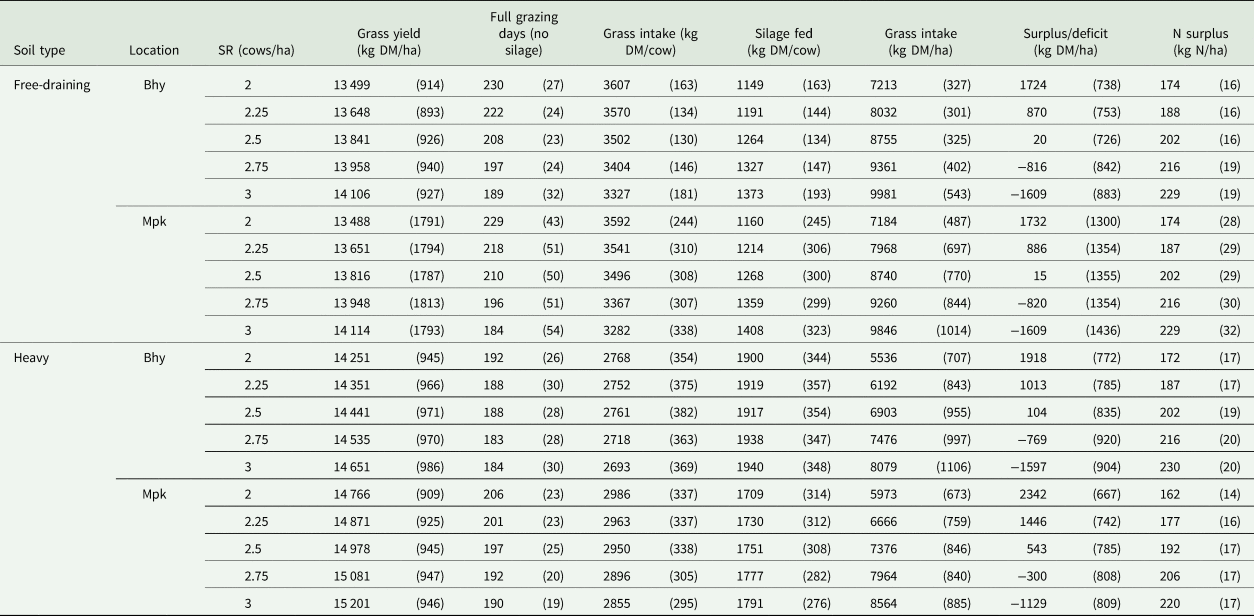
Table 4. Impact of soil type, agroclimate location and SR on mean annual grass yield (kg DM/ha), grazing indicators and dairy cow DM intake (kg DM/cow) at an annual fertilizer application rate of 250 kg N/ha
Cows were fed with 600 kg of concentrate fresh per year and the only available supplementation available at grazing was grass silage.
Cow DMI
Across all simulations, the average DMI per cow annually was 3050 kg DM grazed grass and 1649 kg DM grass silage, with the average amount of concentrate offered fixed at 600 kg. The corresponding production level was of 5456 kg milk, 246 kg fat and 205 kg protein per cow. The maximum grass DMI per cow was 3864 kg DM for MpkFDS at an SR of 2 cows/ha and 300 kg N/ha and the minimum grass DMI per cow was 1774 kg DM for the BhyHS in 2012 and 0 kg N/ha. While 2012 did not correspond to one of the worst years in terms of annual grass yield, the high amount of rainfall led to paddocks being ungrazable for a significant proportion of the grazing season on the HS farm. On average across all of the years, for the SR 2.5 cows/ha and the fertilization rate 250 kg N/ha/year (Table 4), the grass DMI/cow was 3502 kg DM (±130), 2761 kg DM (±382), 3496 kg DM (±308) and 2950 kg DM (±338) for the BhyFDS, BhyHS, MpkFDS and MpkHS systems, respectively (Fig. 2). The corresponding silage fed per cow per year was 1264 kg DM (sd 134 kg DM), 1917 kg DM (sd 354 kg DM), 1268 kg DM (sd 300 kg DM) and 1751 kg DM (sd 308 kg DM) for the BhyFDS, BhyHS, MpkFDS and MpkHS systems, respectively. The lower grass DMI and greater grass DMI variability per cow on the HS was due to paddocks being flooded more often leading to some paddocks not being suitable for grazing during the summer months.
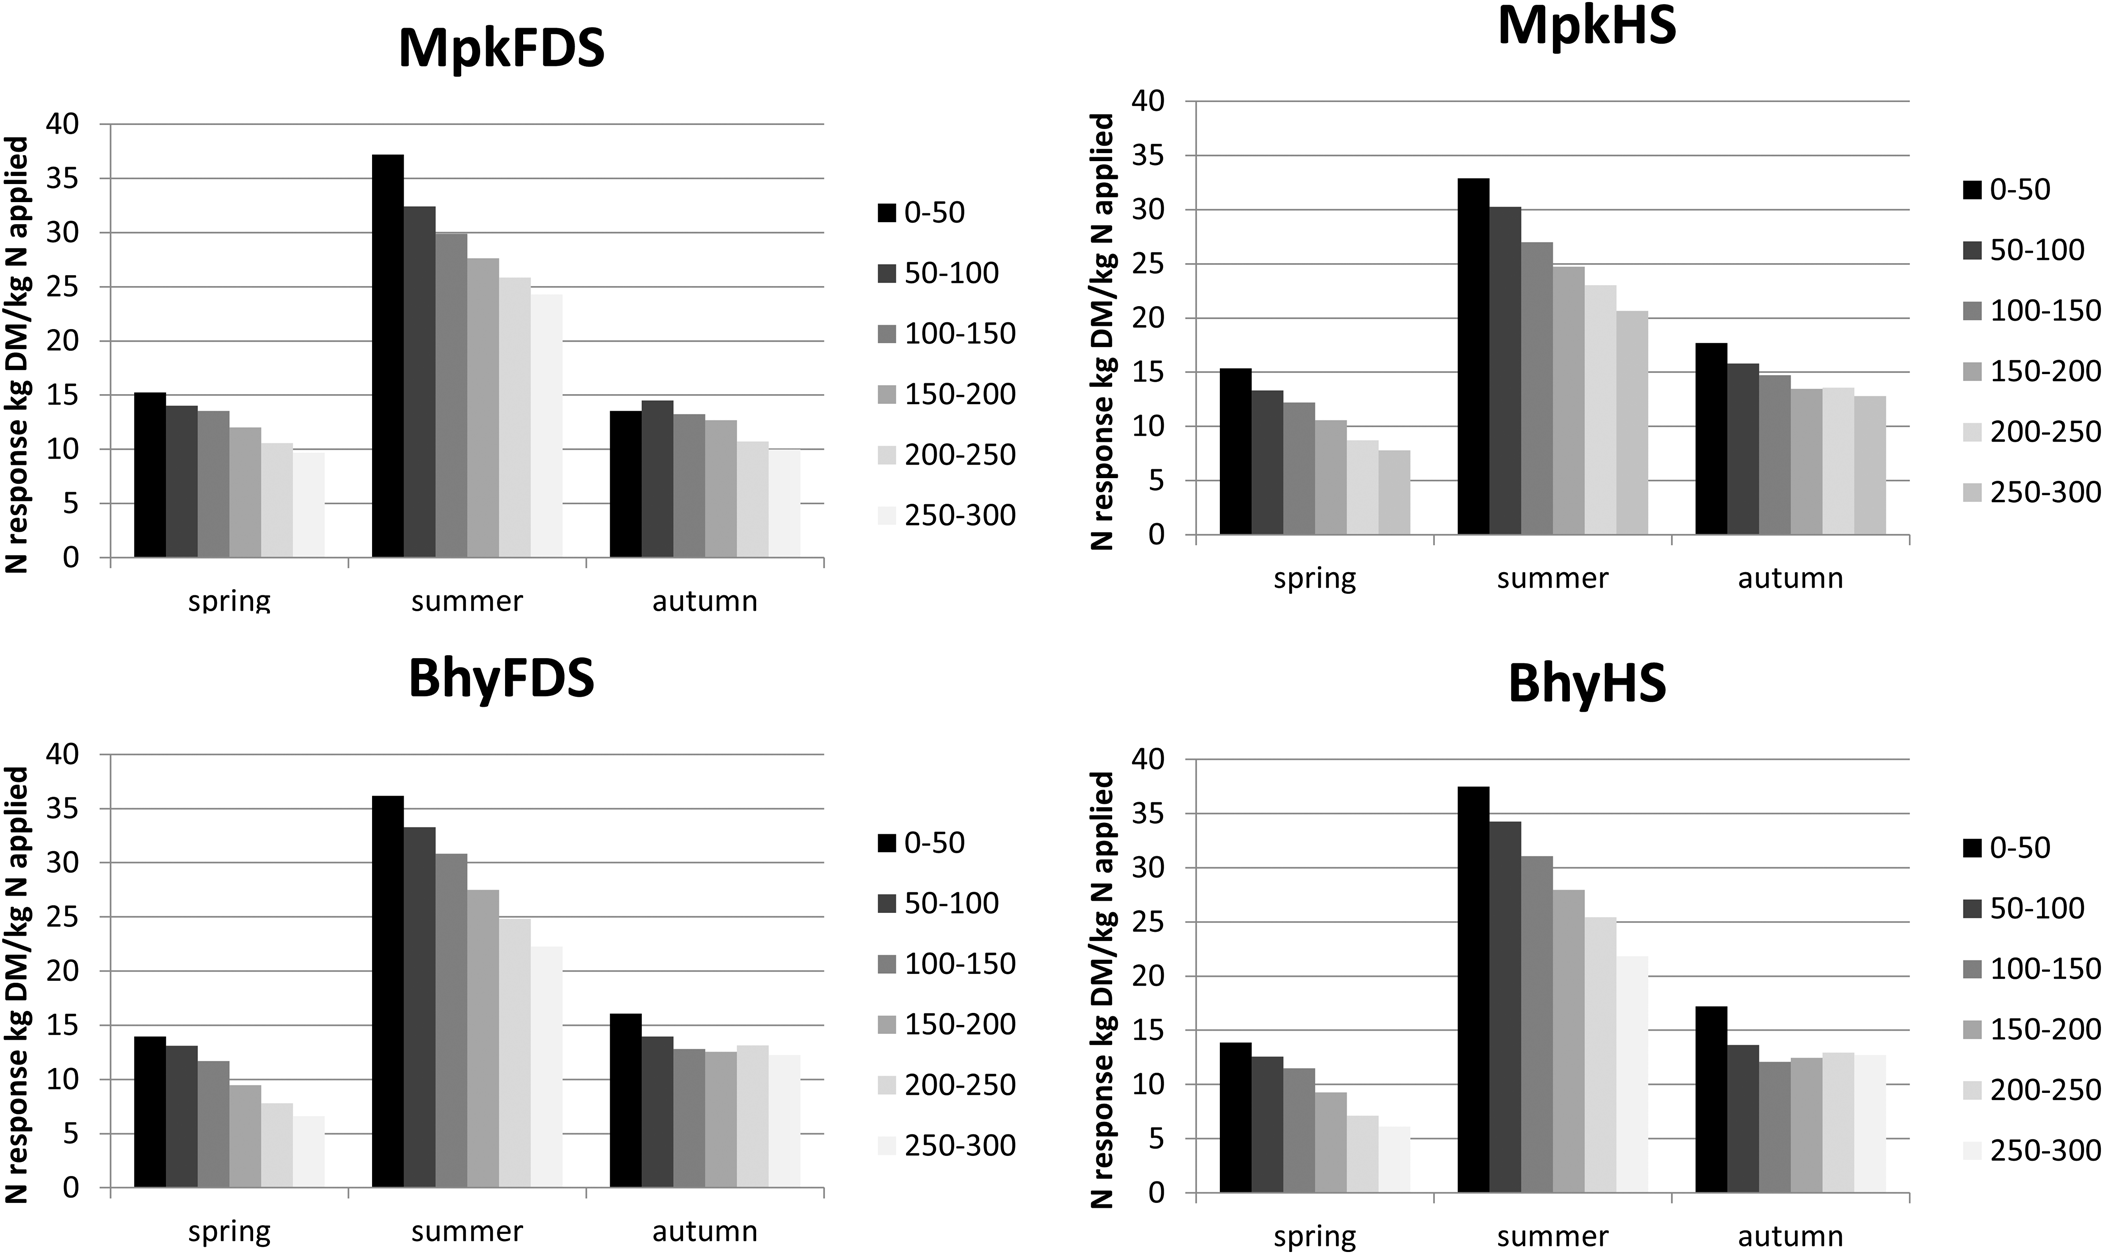
Fig. 2. Mean grass intake (kg DM) per ha and per cow depending on soil type, agroclimate location, SR and fertilizer level. Mpk, Moorepark; Bhy, Ballyhaise; FDS, free-draining soil; HS, heavy soil.
At the SR 2.5 cows/ha, the increase in grass DMI/cow/kg of N applied was of 1.6, 0.5, 1.6 and 0.6 kg DM/kg N for the BhyFDS, BhyHS, MpkFDS and MpkHS, respectively (Fig. 2). These results show that an increase in N fertilizer application rate on an FDS leads to an increase in grass DMI/cow, while on HS the extra fertilizer was used to increase silage produced. Grass DMI/cow declined as SR increased, while grass intake per ha increased (Figs 2 and 3).
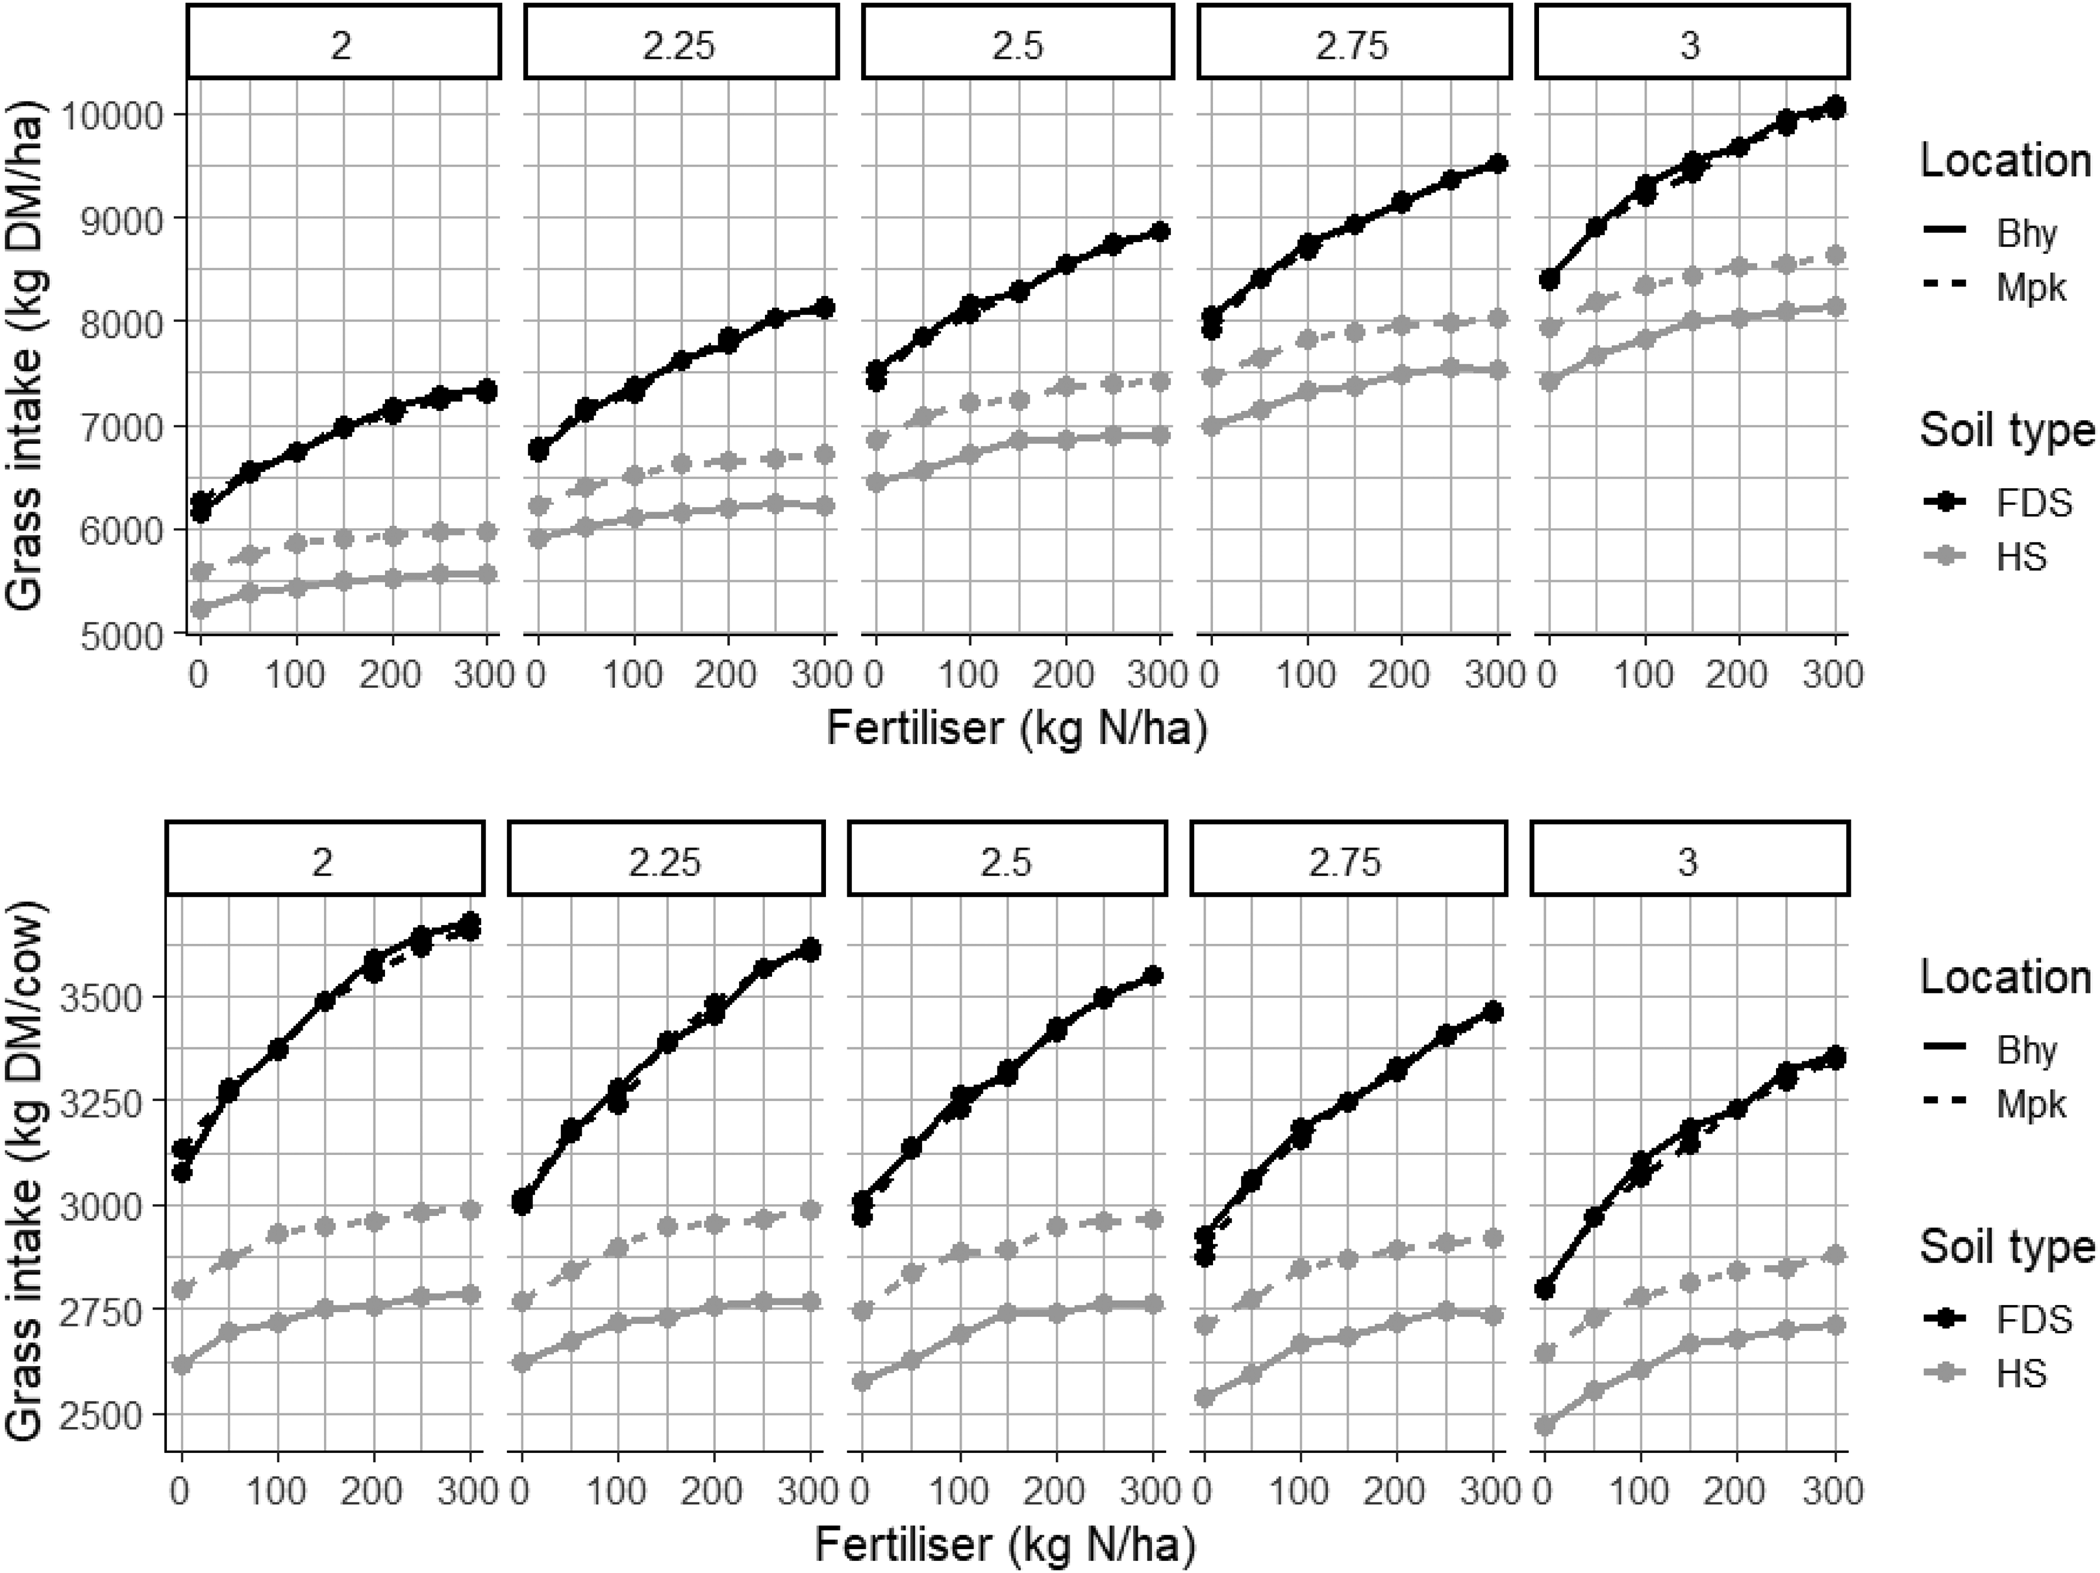
Fig. 3. On farm surplus or deficit depending on soil type, agroclimate location, SR and fertilizer level. Mpk, Moorepark; Bhy, Ballyhaise; FDS, free-draining soil HS, heavy soil.
Nitrogen response
The N response was calculated based on the previous level of N fertilizer (increasing in steps of 50 kg N/ha/year) (Table 3). The average N response due to increasing N fertilizer application by 50 kg/ha/year was 18.5 kg DM/ha, with a minimum of 9.4 kg DM/ha (SR 3 cows/ha and increasing fertilizer from 250 to 300 kg N/ha/year, BhyFDS in 2018) and a maximum of 28.0 kg N/ha (SR 2.25 cows/ha and increasing fertilizer from 0 to 50 kg N/ha/year, BhyFDS, 2014). The N response decreased as N fertilizer application rate increased, with an average response across all the simulations of 22.9 kg DM/kg N applied between the level 0 and 50 kg N/ha/year, and a response of 14.5 kg DM/kg N applied as application rate increased from 250 to 300 kg N/ha/year. On average, across all years, the response to increasing fertilizer application rate from 200 to 250 kg N/ha/year at an SR of 2.5 cows/ha was of 16.6 (±2.0), 16.7 (±1.4), 15.5 (±1.5) and 15.3 (±1.4) for MpkFDS, BhyFDS, MpkHS and BhyHS, respectively.
Figure 4 presents the average N responses by season, fertilizer level, soil type and weather. On average, across all years, the lowest response was in the spring (average 9.2 kg DM/kg N applied from 200 to 250 kg N/ha/year) followed by the autumn (average 12.9 kg DM), while the highest response was always in the summer (average 23.9 kg DM).
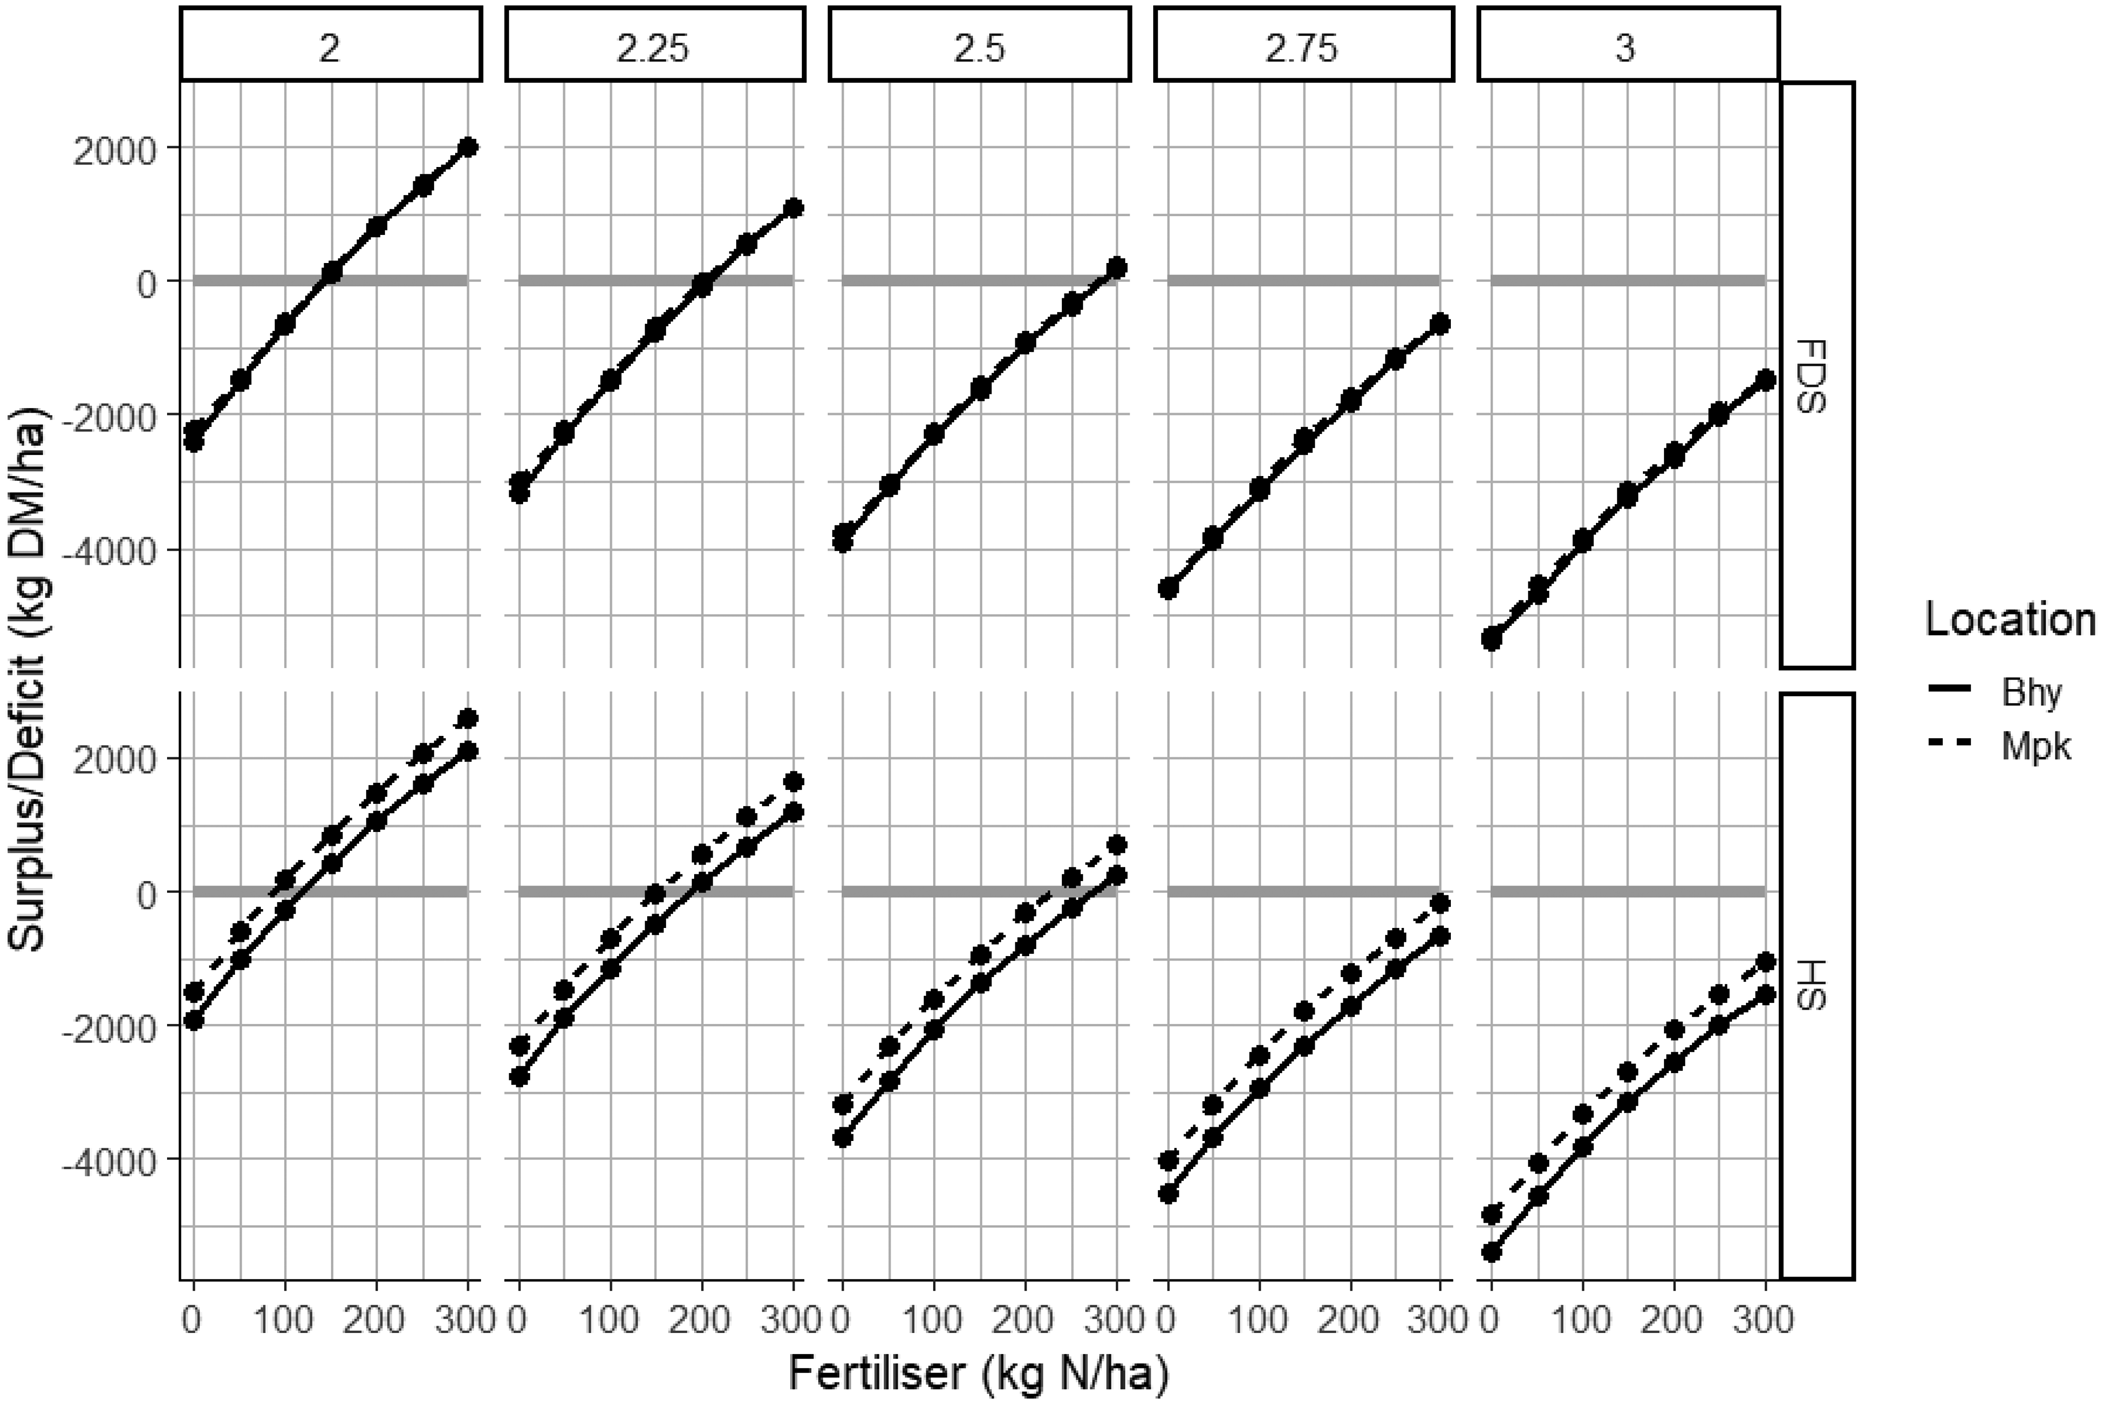
Fig. 4. Variation in nitrogen response (kg DM/kg N applied) by season depending on soil type, agroclimate location and nitrogen level. Mpk, Moorepark; Bhy, Ballyhaise; FDS, free-draining soil; HS, heavy soil.
Effect of nitrogen fertilizer rate and SR on feed self-sufficiency
When fertilizer N application rate was reduced, the number of SRs that were forage self-sufficient declined (Fig. 3). When 250 kg N/ha/year were applied SR 2, 2.25 and 2.5 were forage self-sufficient, while the systems stocked at 2.75 and 3 cows/ha had to purchase in 26 920 and 59 280 kg DM grass silage, respectively, to balance energy requirements on the farm (Table 4). When N fertilizer was reduced to 200 kg N/ha/year, only the systems stocked at 2 and 2.25 cows/ha were forage self-sufficient, and the 2.5, 2.75 and 3 cows/ha systems had to purchase in 15 280, 48 600 and 80 480 kg DM of grass silage, respectively, to balance energy requirements on the farm (Table 5). When N fertilizer application rate was reduced to 150 kg N/ha/year, only the system stocked at 2.0 cows/ha was self-sufficient for forage, and the 2.25, 2.5, 2.75 and 3 cows/ha had to purchase in 5680, 39 280, 72 400 and 104 000 kg DM of grass silage, respectively, to balance feed requirements (Table 6). A linear regression analysis was undertaken to examine if there was a relationship between N applied, SR and farm self-sufficiency. Other parameters included in the regression were the soil type, location and year. The results showed that a reduction in N fertilizer application rate of 50 kg/ha/year required a decrease in SR of 0.18 cows/ha to maintain self-sufficiency (R 2 = 0.90).
Table 5. Impact of soil type, agroclimate location and SR on mean annual grass yield (kg DM/ha), grazing indicators and dairy cow DM intake (kg DM/cow) at an annual fertilizer application rate of 200 kg N/ha

Cows were fed with 600 kg of concentrate fresh per year and the only available supplementation available at grazing was grass silage.
Table 6. Impact of soil type, agroclimate location and SR on mean annual grass yield (kg DM/ha), grazing indicators and dairy cow DM intake (kg DM/cow) at an annual fertilizer application rate of 150 kg N/ha
Cows were fed with 600 kg of concentrate fresh per year and the only available supplementation available at grazing was grass silage.
Effect of nitrogen fertilizer rate and SR on farm gate annual N surplus
Across all simulations, the average annual N surplus was 127 kg of N/ha with a lowest value of −40 kg N/ha (MpkHS in 2011, 0 kg/ha/year of N applied and SR 2.0 cows/ha) and a highest value of 341 kg N/ha (MpkFDS in 2018, 300 kg/ha/year N applied and SR 3.0 cows/ha). Overall the annual N surplus increased as annual N fertilizer application rate and SR increased. On average, across all simulations, the FDS had a higher annual N surplus (131 kg N/ha) than the HS (123 kg N/ha) and the Bly agroclimate location led to a slightly higher annual N surplus (130 kg N/ha) than the Mpk (125 kg N/ha).
Discussion
Overall, the simulations conducted showed realistic agronomic output responses. The average response of 727 kg DM/ha per unit increase in SR in this study aligns well with the previously published research conducted at Mpk between 2013 and 2016 where the average response was of 671 kg of DM/ha (Coffey et al., Reference Coffey, Delaby, Fleming, Pierce and Horan2018). McCarthy et al. (Reference McCarthy, Delaby, Pierce, McCarthy, Fleming, Brennan and Horan2016) found a higher response of 1206 kg DM/ha. McCarthy et al. (Reference McCarthy, Delaby, Pierce, McCarthy, Fleming, Brennan and Horan2016) also showed that the marginal response decreased as SR increased. The average grass intake for FDS was 3499 kg DM at SR 2.5 cows/ha and N fertilizer application rate of 250 kg N/ha/year. This number compares well with the results of McCarthy et al. (Reference McCarthy, Delaby, Pierce, McCarthy, Fleming, Brennan and Horan2016) which had an average grass intake per cow of 3718 kg DM at an SR of 2.5 cows/ha.
In the simulations, a reduced grass DM response to increasing fertilizer N application was observed; an average response of 23.0 kg of DM/kg N applied was recorded between 0 and 50 kg N/ha/year, and a response of 15.0 kg of DM/kg N applied was recorded when N fertilizer application increased from 250 to 300 kg N/ha/year. Previous studies (Enriquez-Hidalgo et al., Reference Enriquez-Hidalgo, Gilliland and Hennessy2016) found similar results with a response ranging from 8.0 to 28.3 kg DM/kg N applied at an application level of 120 kg N/ha/year compared to 0 kg N/ha/year and Hennessy et al. (Reference Hennessy, O'Donovan, French and Laidlaw2008) found responses varying between 15.0 and 33.1 kg DM/kg N applied (when compared to 0 treatment). Previously published studies show a wide range of N responses to N fertilizer application in spring from 2.8 to 22.9 kg DM/kg N applied (O'Donovan et al., Reference O'Donovan, Delaby, Stakelum and Dillon2004). In that study the N response decreased as N applied increased. The average response in early April was of 19.4 kg DM/kg N when 30 kg N/ha was applied which decreased to 11.6 kg DM/kg N when 90 kg N/ha was applied. In the O'Donovan et al. (Reference O'Donovan, Delaby, Stakelum and Dillon2004) study, cut plots were used rather than grazed swards which could explain the higher response in this study. Some older studies such as MacCarthy (Reference Maccarthy1982) showed lower responses in spring (5.2 kg DM/kg N applied), which was calculated in early March and not in April. The selection of perennial ryegrass cultivars for grazed grassland in Ireland has a strong focus on seasonal growth (spring and autumn), which probably increased the N responses in the past number of years (McEvoy et al., Reference McEvoy, O'donovan and Shalloo2011). The grass growth response to fertilizer N application is greatest when grass is actively growing and when conditions of light, temperature and water supply are optimum (Whitehead, Reference Whitehead1995; Hennessy, Reference Hennessy2005). Differences in these factors are largely responsible for the differences in herbage DM yield and the seasonal response to fertilizer N (Whitehead, Reference Whitehead1995; Hennessy, Reference Hennessy2005).
Due to the high variability in N response within season, depending on the weather conditions in a given year, developing an appropriate N fertilizer application strategy is challenging. For example, in the spring of 2018 the N response was low compared to the other years, at approximately 7.2 kg DM/kg N applied for both soil types and both sites at annual N fertilizer application rates of 200–250 kg N/ha. In that year, the N application strategy could have been broadly the same in all regions and soil types due to the low temperatures, high rainfall and poor grass growth, and the best recommendation would have been to delay N application until March or early April. In contrast, in 2007, under the Mpk conditions, the average N response in spring at annual N application rates of 200–250 kg N/ha was approximately 16.1 kg DM/kg N applied for the FDS and 10.9 kg DM/kg N applied for the HS largely due to a milder spring. In that same year under Bhy conditions, the response was only 12.0 kg DM/kg N applied for the FDS and 4.8 kg DM/kg N applied for the HS, which shows the impact of having local and farm specific management for N fertilizer. These examples illustrate the use of precision management based on weather conditions and soil type to guide N fertilizer advice during the low growth periods.
In a farm, soil type and weather are the two parameters a farmer has little control over. Future published modelling work on grass growth should always take into account weather variability (location and year) as well as soil type as it has been shown in this study that a conclusion drawn from 2007 findings would be the opposite to that found in 2018. Precision grassland management techniques that restrict the application of chemical and organic fertilizer N applications when severe weather events are forecasted would also be vital in terms of reducing N loss. This study focused on a small geographical area with differences in soil type and climatic conditions in Ireland. Grazing systems globally will be dealing with much more diverse weather conditions within a region as well as across soil types. Management needs to move away from prescriptive structures with singular advice to a situation where dynamic systems and guidelines interact with the reality on the ground. Systems that capture data and allow dynamic management similar to PastureBase Ireland (Hanrahan et al., Reference Hanrahan, Geoghegan, O'Donovan, Griffith, Ruelle, Wallace and Shalloo2017) or HappyGrass (https://www.happygrass.fr/) should be used in other regions and jurisdictions. This would facilitate more tailored management within and across grass-based systems of milk production.
This study has shown that there is an increase in N surplus as SR and nitrogen fertilizer application rate increases, which is in agreement with previously published studies (Ledgard et al., Reference Ledgard, Penno and Sprosen1997; Gourley et al., Reference Gourley, Dougherty, Weaver, Aarons, Awty, Gibson, Hannah, Smith and Peverill2012). Increased N surplus is often linked to an increase in N leaching (Stott and Gourley, Reference Stott and Gourley2016). There is an increased risk of N being leached on well-drained and moderately drained soils as surplus N increases (Scholefield et al., Reference Scholefield, Lockyer, Whitehead and Tyson1991, Reference Scholefield, Tyson, Garwood, Armstrong, Hawkins and Stone1993; Fraters et al., Reference Fraters, Van Leeuwen, Boumans and Reijs2015). However, this loss is not apparent in HSs (Scholefield et al., Reference Scholefield, Tyson, Garwood, Armstrong, Hawkins and Stone1993), therefore further emphasizing the requirement for tailored management depending on soil type.
The introduction of the farm to fork strategy (2021) requires a reduction in chemical N fertilizer use and N loss. In this study, it was demonstrated that, on average, with each 50 kg/ha/year reduction in N fertilizer application rate, SR had to be reduced by 0.18 cows/ha in order to maintain feed self-sufficiency (Fig. 3). Grass-based systems are focused on maximizing grass production and utilization and minimizing the amount of feed imported to the farm (Shalloo and Hanrahan, Reference Shalloo and Hanrahan2020). This is more sustainable, both profitably and environmentally, than focusing on maximizing milk yield per cow which tends to move away from grass based systems. With a move to lower grass production there is a risk of greater feed importation to the farm which will lead to reduced profitability and a deterioration in environmental sustainability (O'Brien et al., Reference O'Brien, Hennessy, Moran and Shalloo2015). In the simulations described, when all systems were compared regardless of soil type or agroclimate location, as SR increased the level of surplus feed produced in the system declined.
Longer-term strategies exist that could be used to maintain grass production with reduced N fertilizer application rate, for example achieving and maintaining optimum soil fertility while incorporating and maintaining clover in the swards (Dillon et al., Reference Dillon, Shalloo, Ruelle, Delaby, Fenton, Crosson, Creighton, O'Donovan, Horan and Wall2020). The simulations described in the current study assume high soil fertility levels. Increasing soil fertility on farms with sub-optimal soil fertility could result in maintenance of the current level of grass production despite reduced N fertilizer application. Indeed, increasing soil fertility (pH, P and K) has been shown to increase N use efficiency (Wall, Reference Wall2019). White clover (Trifolium repens L.) is the most important sown legume species in grazed grassland in temperate regions including Ireland (Peyraud et al., Reference Peyraud, Le Gall and Lüscher2009). The incorporation of white clover in grazing swards takes advantage of their capacity to fix atmospheric N and make it available for plant growth allowing the reduction in chemical N fertilizer use (Egan et al., Reference Egan, Galvin and Hennessy2018; Enriquez-Hidalgo et al., Reference Enriquez-Hidalgo, Gilliland, Egan and Hennessy2018). The use of white clover (T. repens L.) in recent decades in Ireland has been low due to the availability of cheap N fertilizer (Gilliland et al., Reference Gilliland, McGilloway and Conaghan2009). Incorporating white clover into perennial ryegrass swards can reduce N fertilizer requirement without affecting herbage production (Egan et al., Reference Egan, Galvin and Hennessy2018), while sometimes increasing herbage production at a given N fertilizer application rate (Enriquez-Hidalgo et al., Reference Enriquez-Hidalgo, Gilliland, Egan and Hennessy2018; McClearn et al., Reference McClearn, Gilliland, Guy, Dineen, Coughlan and Mccarthy2020a), increasing herbage quality (Ulyatt and Morley, Reference Ulyatt and Morley1981; Ayres et al., Reference Ayres, Nandra and Turner2002) and increasing DM intake (Ribeiro Filho et al., Reference Ribeiro Filho, Delagarde and Peyraud2003, Reference Ribeiro Filho, Delagarde and Peyraud2005) and milk production (Ribeiro Filho et al., Reference Ribeiro Filho, Delagarde and Peyraud2003, Reference Ribeiro Filho, Delagarde and Peyraud2005; McClearn et al., Reference McClearn, Gilliland, Guy, Dineen, Coughlan and Mccarthy2020a). All of these components are associated with increases in farm profitability (McClearn et al., Reference McClearn, Shalloo, Gilliland, Coughlan and Mccarthy2020b).
Conclusion
This paper showed that increasing either SR or annual N fertilizer application rate increased annual grass yield but also lead to an increase in annual N surplus. While the average annual grass yield looked similar between the two soil types the FDS had more grazed grass by the animals while in the HSs, there was more grass silage conserved and consumed as the ground conditions were not always fit for grazing. Weather variability and its impact on grass yield highlighted the importance of having flexibility and dynamic grassland management. This paper clearly illustrates the challenges in balancing feed supply with lower N input at varying SRs. This study shows that irrespective of the soil type, a 50 kg reduction in N fertilizer application per ha would lead to a requirement to reduce SR by 0.18 cows/ha if no additional measures are taken on farm to maintain herbage production and feed supplementation is not increased.
Author contributions
E. R., M. O. D., P. D., L. S., L. D., B. H., M. E. and D. H. conceptualized the study. E. R., M. O. D., P. D., L. S. and L. D. designed the modelled scenarios. E. R. ran the simulation. D. H., B. H., M. E., L. S., M. O. D. and P. D. analysed the industry consequences of the model outputs. E. R. wrote the article. L. S., D. H. and P. D. critically revised the paper.
Financial support
The authors are grateful for the funding provided by the Irish Dairy Levy Trust (Dublin, Ireland).
Conflict of interest
The authors declare there are no conflicts of interest.


 Open access