


Introduction
The trends of carbon dioxide (CO2) concentration in the atmosphere influence productivity of the land and oceans directly. The contribution by the land ecosystems to these trends consists of a sink term due to net increased synthesis of organic compounds, and a source term due to cultivation and land-use change. Between 2000 and 2009, land net productivity at the global scale increased by approximately 5% relative to the calculated pre-industrial level, leading to a land sink of 2.6 ± 1.2 Pg carbon (C) per year (Raupach et al. Reference Raupach, Canadell and Le Quere2008; Le Quere et al. Reference Le Quere, Andres, Boden, Conway, Houghton, House, Marland, Peters, van der Werf, Ahlstrom, Andrew, Bopp, Canadell, Ciais, Doney, Enright, Friedlingstein, Huntingford, Jain, Jourdain, Kato, Keeling, Klein Goldewijk, Levis, Levy, Lomas, Poulter, Raupach, Schwinger, Sitch, Stocker, Viovy, Zaehle and Zeng2013) (1 Pg = 1015 g). Coupled Model Intercomparison Project Phase 5 (CMIP5) projections suggested that the rate of net C uptake by the terrestrial ecosystem will decrease in the 21st century. For Europe, Smith et al. (Reference Smith, Smith, Wattenbach, Zaehle, Hiederer, Jones, Montanarella, Rounsevell, Reginster and Ewert2005) predicted the cropland soil organic carbon (SOC) stock will also decrease by 4–6 Pg (39–54%) by 2080 relative to 11 Pg C in 1990. However, net uptake of C by the land is highly variable year-to-year mainly in response to climate variations (Mercado et al. Reference Mercado, Bellouin, Sitch, Boucher, Huntingford, Wild and Cox2009). Because of this fluctuation, it is not possible to determine precisely whether the rate of C uptake by the land sink has been increasing or decreasing globally over shorter periods (Settele et al. Reference Settele, Scholes, Betts, Bunn, Leadley, Nepstad, Overpeck, Taboada, Field, Barros, Dokken, Mach, Mastrandrea, Bilir, Chatterjee, Ebi, Estrada, Genova, Girma, Kissel, Levy, MacCracken, Mastrandrea and White2014).
Soil organic C accumulation is constrained by nitrogen (N) (Hungate et al. Reference Hungate, Dukes, Shaw, Luo and Field2003), as the N and C processes are mutually regulated by each other (Luo et al. Reference Luo, Hui and Zhang2006). The relationship is interdependent such that the mineralization of N is influenced by the balance between inputs (harvest residues, rhizodeposition, manure, slurry, etc.) and the degradation of soil organic matter (SOM) over an extended period of time. Experiments have shown that when elevated CO2 concentration increases C : N ratios, decomposition of microorganisms require more N (Gill et al. Reference Gill, Polley, Johnson, Anderson, Maherali and Jackson2002). In addition to losses through leaching and gaseous fluxes, higher C : N ratios are expected to reduce N mineralization in soil (Lam et al. Reference Lam, Chen, Norton and Armstrong2013), the main source of N for plants, whereas N demand and removal in grain cropping systems will increase under elevated CO2 concentrations (Lam et al. Reference Lam, Chen, Norton, Armstrong and Mosier2012). Thus, to realistically analyse future land productivity determined by SOC, C and N processes must be studied concurrently in response to climate change.
The combined direct effect of climate change on C and N processes consists mainly of increased temperature, elevated CO2 concentration and increased or decreased soil moisture. Christensen & Christensen (Reference Christensen and Christensen2007) suggested that the annual mean temperature in Scandinavia will increase by 4.16 °C, and precipitation by 9%, by 2080. Under these conditions, the mineralization rate of N in crop residues and SOM is expected to increase in Denmark (Olesen et al. Reference Olesen, Askegaard, Berntsen, Hatch, Chadwick, SC and Roker2004), potentially leading to significant amount of N losses through leaching, especially in sandy soils (Askegaard et al. Reference Askegaard, Olesen, Rasmussen and Kristensen2011). Recent results from long-term experiments carried out under Nordic conditions indicated that SOC is increasing with the rate of N fertilizer applied (Katterer et al. Reference Katterer, Bolinder, Berglund and Kirchmann2012). The model projections and experiments in similar climatic regions indicated varying results; SOC content may increase (Gervois et al. Reference Gervois, Ciais, de Noblet-Ducoudre, Brisson, Vuichard and Viovy2008; Reijneveld et al. Reference Reijneveld, van Wensem and Oenema2009), decrease (Janssens et al. Reference Janssens, Freibauer, Schlamadinger, Ceulemans, Ciais, Dolman, Heimann, Nabuurs, Smith, Valentini and Schulze2005; Zaehle et al. Reference Zaehle, Bondeau, Carter, Cramer, Erhard, Prentice, Reginster, Rounsevell, Sitch, Smith, Smith and Sykes2007) or remain unchanged (Meersmans et al. Reference Meersmans, van Wesemael, Goidts, van Molle, De Baets and De Ridder2011) over a long term, depending on topography, soil type, land management, vegetation, soil moisture and initial SOC.
The high variability in experimental and modelling studies probably stems from intrinsic heterogeneity in C and N processes across ecosystems. Murty et al. (Reference Murty, Kirschbaum, McMurtrie and McGilvray2002) suggested that for better projections at a global scale, especially for cooler climates, measurements on SOC dynamics regarding specific regions would be required. Though invaluable, these measurements cannot be carried out expediently due to high time, labour and financial demands. Obtaining information and describing the interactions of soil processes and climate are therefore performed using process-based models. When validated, the models can be implemented to predict changes in SOC in response to land-use and climate change, because most of the known factors regarding C dynamics are included in the models (Madsen et al. Reference Madsen, Nørr and Holst1995). Combined with local measured SOC data to better reflect the real site-specific conditions under which C is accumulated, simulation models become powerful tools overcoming the problems associated with extensive and costly experiments.
Soil organic C has been broadly examined in land ecosystems using models. Most of the studies have focused primarily on C sequestration (Zak et al. Reference Zak, Pregitzer, King and Holmes2000; Garcia-Palacios et al. Reference Garcia-Palacios, Vandegehuchte, Shaw, Dam, Post, Ramirez, Sylvain, de Tomasel and Wall2015). Soil productivity-oriented studies including soil N dynamics while simultaneously investigating the temporal course of C are scarce. With this background, the objectives of the current study will be (1) to evaluate the long-term SOC dynamics in a continuous mono-crop system under climate change; (2) to simultaneously investigate C and N processes under climate change; (3) to identify and quantify the uncertainties in estimating SOC and N dynamics under climate change.
Methods and materials
Study area
The study area is located in southern Denmark (55°7′N, 10°45′E 33 m asl) on the island of Funen. In order to run the ‘Soil and Water Assessment Tool’ (SWAT) model (details below), spatially explicit inputs were needed. For that reason, a 4.4 ha arable sub-basin was delineated in a watershed in south-eastern Funen (Pedersen et al. Reference Pedersen, Blicher-Mathiesen, Mejlhede and Grant2010), where the landscape is flat and the soil is of sandy loam glacial tills from the Weichsel glaciation (Breuning-Madsen & Jensen Reference Breuning-Madsen and Jensen1996).
The climate in the basin (and in Denmark in general) is temperate with winter mean temperature around 0 °C and summer mean of 17 °C. The average annual precipitation is approximately 745 mm. Annual potential evapotranspiration (PET) is approximately 550 mm and the actual is approximately 380 mm: it exceeds precipitation in spring and early summer, leading to depletion of soil water. In late autumn, winter and early spring, 150–400 mm water percolates through the soil. Due to a precipitation surplus in late autumn, soil water reserves are replenished (Cappelen Reference Cappelen2012).
Observed weather data and climate scenarios using ensembles regional circulation models
Daily gridded climate data including minimum and maximum temperatures, precipitation, solar irradiance and reference evapotranspiration calculated by the Makkink method (Jacobs & de Bruin Reference Jacobs and de Bruin1998) for a 20-year baseline period (1991–2010) were obtained from the Danish Meteorological Institute (DMI). Observed precipitation data were gridded to 10 km through an interpolation method of approximately 500 rain gauges distributed evenly across Denmark. Temperature and reference evapotranspiration were gridded to 20 km based on a scarcer network of weather stations. Precipitation data were corrected to compensate for gauge under-catch due to aerodynamic effects and wetting losses (Allerup et al. Reference Allerup, Madsen and Vejen1997; Stisen et al. Reference Stisen, Hojberg, Troldborg, Refsgaard, Christensen, Olsen and Henriksen2012). The observed climate variables that were used in the current study corresponded to the grid that was nearest to the study area.
The climate change signals were obtained from global and regional circulation model simulations (GCM–RCM pairings) carried out by the EU ENSEMBLES project (van der Linden & Mitchell Reference van der Linden and Mitchell2009). For the current study, a sub-set of four climate models was selected based on the criteria such as highest resolution, longest simulations until the end of the 21st century covering from 1951 to 2100, and consistent climate sensitivity to atmospheric CO2 pressure. The sub-sets of ENSEMBLES were (1) ARPEGE and RM5.1 from the National Center of Meteorological Institute Research, France, (2) ECHAM5 from the Max Planck Institute for Meteorology (MPI), Germany and HIRHAM5 from the DMI, Denmark, (3) HadCM3 and HadRM3 from the Met Office Hadley Centre, UK, (4) ECHAM5 from the MPI and RCA3 from the Swedish Meteorological and Hydrological Institute. From here onward the GCM–RCM pairings will be denoted by their RCM acronym only.
For the RCM output, the A1B (medium-impact) emission scenario was considered (Nakicenovic & Swart Reference Nakicenovic and Swart2000). A1B indicates a world with rapid economic growth and prompt introduction of new and efficient technologies leading to a global energy system balanced across all sources. In this scenario, the atmospheric CO2 concentration for the next century was estimated to be 460–535 ppm for the 2011–2030 period (gradually increasing), and 615 ppm for the rest of the century. The CO2 concentration was used in the climate files as an input for the crop-soil models.
Bias corrections on regional circulation model outputs
Regional circulation model outputs are subject to systematic errors and biases. The outputs required additional bias correction in order to use them in the analyses of climate change impact. Compared with temperature, precipitation shows significant natural variability both temporally and spatially. In order to retain the projected regime characteristics while removing initial climate model bias, a bias correction method was implemented as suggested by Seaby (Reference Seaby2013); for temperature, a bias removal approach was used to correct daily values via seasonal bias removal factors calculated between the RCM reference period and the observed data. Projections for precipitation outputs by the RCMs were corrected using distribution-based scaling precipitation. In the current study, evapotranspiration was calculated by the crop-soil models using temperature and solar radiation using the Makkink method (Jacobs & de Bruin Reference Jacobs and de Bruin1998).
The crop-soil models
Three commonly used, process-based models were compared in the current study as they allowed detailed investigation of soil N and C processes: FASSET, version 2.5 (Berntsen et al. Reference Berntsen, Petersen, Jacobsen, Olesen and Hutchings2003), DAISY, version 5.18 (Hansen et al. Reference Hansen, Jensen, Nielsen and Svendsen1991) and SWAT, version 2012 (Arnold et al. Reference Arnold, Srinivasan, Muttiah and Williams1998).
Calibration of crop parameters in the three models regarding winter wheat was based on experiments that were carried out in Research Center Foulum, Central Denmark (56°30′N, 9°34′E) between 2002 and 2012. Observed data included phonological development stages (day of occurrence for emergence and flowering), biomass, dry matter yield, crop N uptake and grain N at harvest. In addition, soil water content, soil mineral N and nitrate (NO3−) leaching data were collected. For calibration of flowering dates specifically, an additional data set from 1992 to 1996 was also used. The models were calibrated using a step-by-step method. First, the simulation output was fitted to measured soil water content with default winter wheat parameter values. Concurrently, crop phenology, crop biomass and N contents were fitted. Lastly, soil mineral N and N leaching was fitted to the measured values. Because the models were validated several times using independent data sets, an additional validation procedure was omitted in the current study.
In FASSET, the soil module has a one-dimensional vertical structure, in which the SOM sub-module consists of seven discrete C and N pools; two for added organic matter, two for soil microbial biomass, one for soil microbial residues, one for humus and an inert pool. The division of the pools is a crude approximation of nature, describing turnover of all the organic pools by first-order differential equation. Organic material (organic fertilizers, plant residues and rhizodeposition) enters the system by creating new added organic matter pools, which take part in the turnover. In FASSET, each organic pool has a fixed C : N ratio and therefore the C turnover will result in either N mineralization or N immobilization (Petersen et al. Reference Petersen, Berntsen, Hansen and Jensen2005a, Reference Petersen, Jensen, Hansen, Pedersen, Henriksen, Sorensen, Trinsoutrot-Gattin and Berntsenb). FASSET simulates crop growth based on soil information, climate input, crop management, water and N availability. Biomass accumulation is predominantly affected by temperature and solar radiation. It also dynamically takes the effect of CO2 concentration into account by calculating daily dry matter multiplied by  $e^{0.4537 - (170.97/{\rm C}{\rm O}_{\rm 2}{\rm ppm})}$. This relationship between CO2 concentration and dry matter accumulation was validated using Free-Air Carbon dioxide Enrichment (FACE) experiments (Olesen et al. Reference Olesen, Petersen, Berntsen, Hansen, Jamieson and Thomsen2002). While increasing the biomass through elevated CO2, the model further assumes that higher CO2 concentrations reduce the transpiration rates as shown by Leakey et al. (Reference Leakey, Ainsworth, Bernacchi, Rogers, Long and Ort2009).
The DAISY SOM sub-module considers three main compartments of SOM: added organic matter, the soil microbial biomass and SOM, which corresponds to native dead organic matter. These compartments were divided into slow and fast pools along with one inert pool of intractable material (Abrahamsen & Hansen Reference Abrahamsen and Hansen2000). Division of the SOM compartments and the way in which the turnover of organic matter is described is identical to the FASSET model.
The effect of elevated CO2 was, however, not included in the standard DAISY. In order to study the effect of climate change, the following modifications were made by Borgesen & Olesen (Reference Borgesen and Olesen2011): photosynthetic C assimilation is calculated via a light-saturated CO2 response curve. The light-saturated photosynthetic rate, light use efficiency (the linear phase of the light response curve) and CO2 compensation point (the moment when C assimilation and respiration rates are equal) were allowed to change as the CO2 concentration and temperature increased. The stomatal conductance of a leaf was also affected by elevated CO2. The response of stomatal conductance to CO2 was estimated using the data from Ainsworth et al. (Reference Ainsworth, Davey, Bernacchi, Dermody, Heaton, Moore, Morgan, Naidu, Ra, Zhu, Curtis and Long2002).
The Soil and Water Assessment Tool is a watershed scale spatial model. Major components of the model include hydrology, weather, erosion, soil temperature, crop growth, nutrients, pesticides and management activities. It links hydrology, nutrient cycling and crop growth, making it suitable for simulating long-term impacts of climate, land-use and management practices (Nair et al. Reference Nair, King, Witter, Sohngen and Fausey2011). For crop growth simulation, SWAT uses the same inputs as the previous two models. Crop growth is based on the accumulation of heat units. For each day, SWAT initially calculates the potential crop growth assuming optimum conditions. If the potential growing conditions are not met, SWAT identifies that particular day as a stress day and the potential biomass is reduced due to stress. Carbon dioxide concentration is used mainly to alter the calculations of PET and biomass production. For the latter, SWAT adjusts radiation use efficiency for increased concentrations of CO2, resulting in higher maximum leaf area index and transpiration (Stockle et al. Reference Stockle, Williams, Rosenberg and Jones1992). For the current study, CO2 dependence of stomatal conductance was also taken into account. Doubling of CO2 concentration from the default value resulted in 40% reduction in stomatal conductance following Easterling et al. (Reference Easterling, Rosenberg, McKenney, Jones, Dyke and Williams1992). The main difference of SWAT from the other models in terms of the soil organic sub-module is that it uses a single dynamic pool for soil organic C, N and phosphorus (P), and separate pools for residue and manure C, N and P. The pools are not separated into active and stable pools. Microbial activity on SOM, manure and residues decompose the organic C, N and P simultaneously (Kemanian & Stockle Reference Kemanian and Stockle2010).
The initial SOC pool size estimations were based on field measurements carried out by the Danish Center for Food and Agriculture (Børgesen et al. Reference Børgesen, Jensen, Blicher-Mathiesen and Schelde2013). The parameterization of the SOM turnover models (the partitioning rate from one pool to the other) of FASSET and DAISY were based on Danish long-term field experiments (Bruun et al. Reference Bruun, Christensen, Hansen, Magid and Jensen2003).
Because SWAT is a spatial model, a watershed was delineated using ArcGIS–SWAT (ArcSWAT) interface. Digital elevation model data and predefined digital stream network, obtained from Danish Center for Environment and Energy (Pedersen et al. Reference Pedersen, Blicher-Mathiesen, Mejlhede and Grant2010), were used for delineation. ArcSWAT then divided the watershed into smaller hydrological response units with homogenous biophysical properties using slope, soil and land-cover maps.
The models were run from 1951 to 2010 to establish the baseline. While the baseline results presented in the current study correspond to 1991–2010, the preceding runs from 1951 to 1990 were used to train the models.
Soil and crop management
The soil properties of the study area are presented in Table 1 and adopted from Børgesen et al. (Reference Børgesen, Jensen, Blicher-Mathiesen and Schelde2013). Assuming a direct correlation between SOC and humus (Perie & Ouimet Reference Perie and Ouimet2008), and based on the values in Table 1, C content at 0–30 cm was estimated to be 110 t C/ha in the study area using the following equation:
 $$\eqalign{& {\rm C}\% \quad \quad \quad {\rm BD}\quad \quad \quad \quad \quad {\rm Soil}\,{\rm depth}\,{\rm in}\,{\rm cm} \cr & \displaystyle{{24\,{\rm g}\,{\rm C}} \over {{\rm kg}\,{\rm C}}} \times 154\,000\,{\rm kg}\,{\rm soil/ha} \times 30{\rm =} 110\,{\rm t}\,{\rm C/ha}} $$
Table 1. Texture and carbon content in three soil layers in the study area based on soil data in Geo-region Eastern Denmark.

The SOC stock maps derived by Adhikari et al. (Reference Adhikari, Hartemink, Minasny, Kheir, Greve and Greve2014) also indicated that the average C stock at 0–30 cm in the study area was between 81 and 120 t/ha. The values shown in Table 1 were subsequently used in parameterization of the models, resulting in initial SOC values of 109.8, 108.4 and 109.4 t/ha in FASSET, SWAT and DAISY, respectively.
Crop management included the following field operations: ploughing, sowing, fertilization and harvest. Dates of operations during the baseline period were based on current farmer practices (Table 2). The dates of future operations were adjusted with increasing temperature, and based on modifications from warmer sites in Europe (Henriksen et al. Reference Henriksen, Rosenbom, van der Keur, Olesen, Jørgensen, Kjær, Sonnenborg and Christensen2012).
Table 2. Dates of field operations for the baseline period and the future under projected climate change

For simulations, a continuous mono-crop rotation using winter wheat with no irrigation was implemented. Straw was removed at harvest, and the stubble incorporated into the soil during ploughing. All simulations were run using three levels of N fertilization: 80, 162 and 240 kg N/ha. The rate of 162 kg N/ha was considered as the standard amount currently being applied to Danish fields (Plantedirektoratet 2013).
Statistical analysis
The statistical analyses were carried out using mixed-effects analysis in R open source statistical software version 2.1.4.1 with the package lme4 (Bates et al. Reference Bates, Maechler and Bolker2012). The random slope model was chosen for the analyses, where random variables were not only allowed to have different intercepts, but where they were also allowed to have different slopes for the main effect. This approach, in ecological studies in particular, was emphasized by Schielzeth & Forstmeier (Reference Schielzeth and Forstmeier2009), who showed that mixed models without random slopes are anti-conservative and tend to find many significant results which are actually due to chance.
In the current study, the relationship between SOC and time (temporal change in temperature, soil moisture and CO2) was analysed. Time and N inputs (with and without interaction term) were entered into the statistical model as fixed effects. As random effects, the model had intercepts for RCMs and crop-soil models, as well as random slopes for time by RCM and by crop-soil model. It was assumed that RCMs and crop-soil models would elicit varying levels of SOC estimations over time.
The change in N leaching from the soil and denitrification in response to climate change were also analysed using the same approach, including time and N input as fixed effects, and RCM and crop-soil models as random effects. Following the analyses, visual inspection of residual plots revealed no obvious deviations from homoscedasticity or normality, and as such, P-values were subsequently obtained by likelihood ratio tests of the full model with the effects in question against the model with interactive effects, and against the model without any effect of fixed factors (null model). The difference between statistical models, and thus the existence of the effect of a factor or interaction occurred when P < 0.01.
Results
Baseline weather and climate change projections
The observed and generated baseline parameters were presented in detail in Ozturk et al. (Reference Ozturk, Sharif, Baby, Jabloun and Olesen2017). In summary, increased future air temperature was suggested by all the RCMs. By 2080, HadRM3 indicated the highest temperature increase (3.3 °C from the baseline), while RCA3, HIRHAM5 and RM5.1 indicated increases of 2.2, 2.1 and 2 °C, respectively, during the same period.
Precipitation over the entire projection period was generally estimated to increase, with HIRHAM5, RCA3 and HadRM3 suggesting increases of 15, 7.9, and 5.6%, respectively. Projections from RM5.1, however, suggested a 2.5% decrease. In general, during 2060 and 2080 periods, there is a tendency for increased precipitation relative to the baseline. Variation in precipitation from one year to another was very high: rainfall in relation to the baseline fluctuated from 75% above the baseline level to 50% below it in the future depending on the RCM and projection period.
Baseline simulations
Measurements of the soil variables in the study area indicated 110 t SOC/ha, at 30 cm soil depth (Table 1). While initial values at the beginning of the warm-up period (1951) were calculated by the models to be approximately 110 t/ha, average SOC between 1990 and 2010 was estimated to be approximately 109–116 t/ha depending on RCM, crop-soil model and N input rate (Table 3). The SWAT suggested a slightly increasing trend, while FASSET suggested both increases and decreases, depending on N input over the baseline, and DAISY suggested a decreasing trend regardless of N input (Fig. 1).
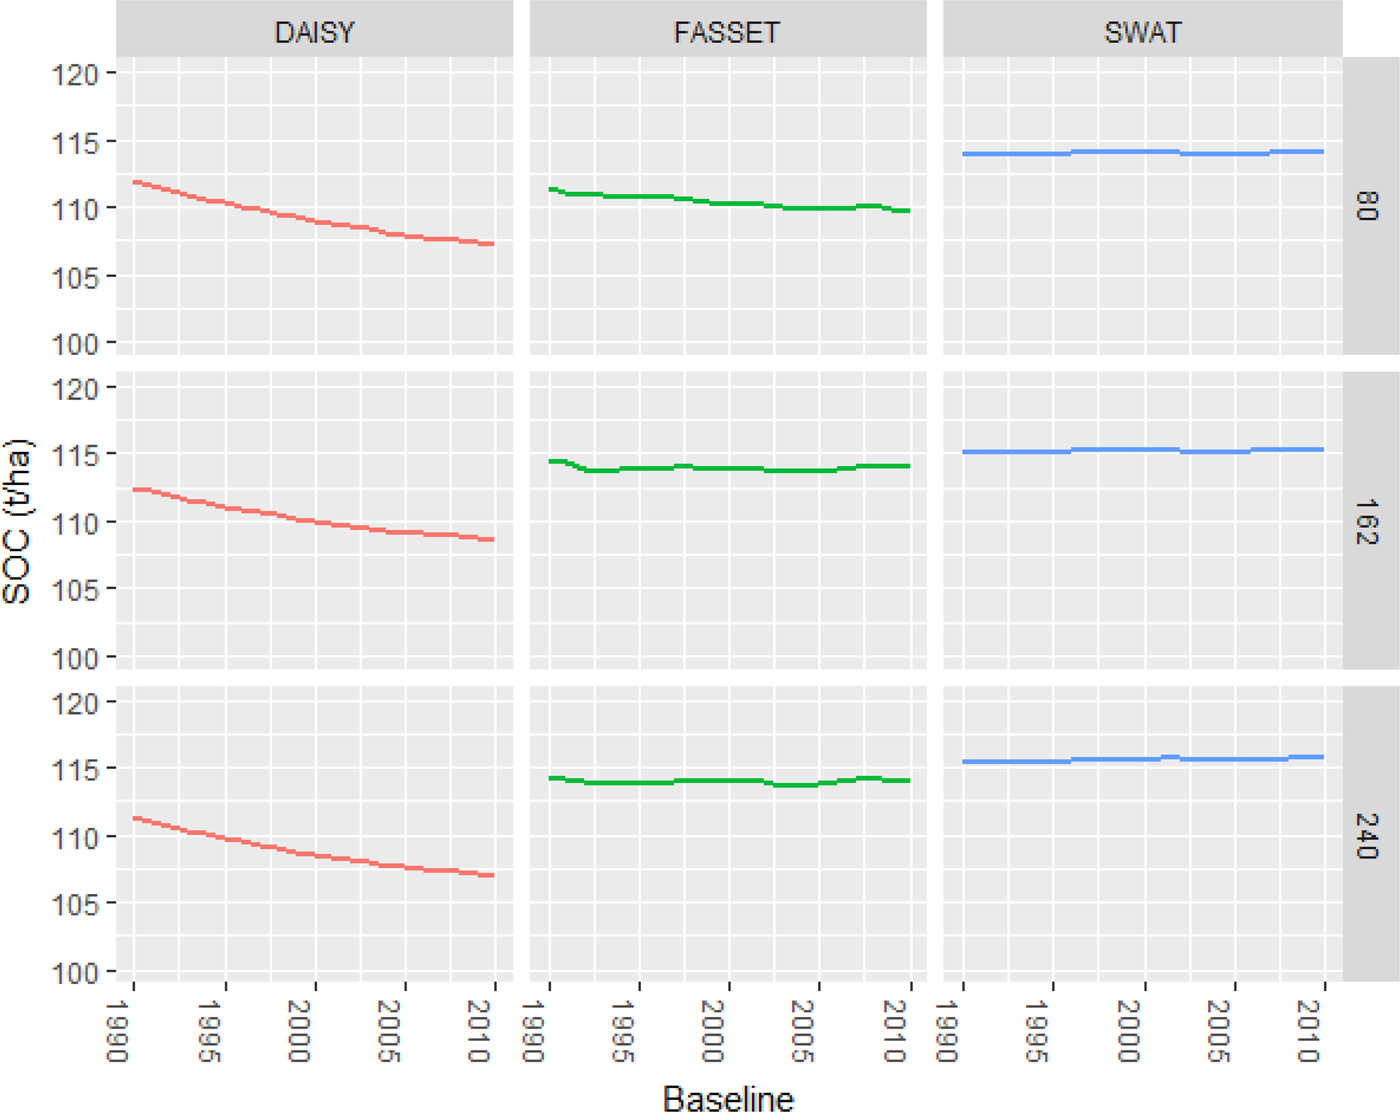
Fig. 1. The course of soil organic carbon (SOC) during the baseline (1991–2010) estimated by each soil model at 80, 162 and 240 kg N/ha input. Colour online.
Table 3. The baseline averages of soil organic carbon (SOC), denitrification and nitrogen (N) leaching estimated by the models under four regional circulation model (RCM: HadRM3, HIRHAM5, RCA3, RM5.1) projections and three N inputs at 80, 162, 240 kg/ha

Nitrogen losses from the cropping system were estimated through calculation of leaching and denitrification. Nitrification and ammonia volatilization were not considered, as they constituted insignificant amounts probably due to the application of mineral N only. During the baseline period, DAISY and FASSET indicated lower leaching and higher denitrification compared with SWAT (Table 3). Overall, N losses were found to be similar throughout the baseline period; however, the rate at which the losses occurred was different among the models.
The likelihood comparison test of mixed-effects analyses suggested that time (in which temperature and precipitation changed) and N input level affected the SOC change significantly. Throughout the baseline period, SOC was estimated to be lower at 80 kg N/ha than 162 and 240 kg N/ha. However, there was no difference between the 162 and 240 kg N inputs. The comparison further suggested that N input and time were not significantly inter-dependent in affecting SOC. In the statistical analysis, it was found that 98% of the total variance of random effects is attributed to crop-soil models, while 1.4% of the variance was due to random error, with only the remaining <1% variance attributed to RCM. For the baseline period, crop-soil models accounted for almost all the variation in SOC.
In terms of N losses, the likelihood comparison suggested that denitrification was significantly affected by N input and time. However, there was no interdependence between N input and time. It was found that RCM contributed ≈97% of the total variance of the random variation, while <1% of the variance was attributed to crop-soil models and ≈3% was due to random error in relation to denitrification.
The likelihood comparison showed that there was a significant interactive effect of N input and time on N leaching. It was further calculated that ≈99% of the variance of the random variation was due to RCM. Throughout the baseline period, RCMs were the main source for the variation in N losses.
Soil organic carbon under climate change
The crop-soil models suggested different trends in SOC in response to climate change. The change in SOC estimated by DAISY was almost always negative, indicating a decrease relative to the baseline, except for the trend in SOC at 162 and 240 kg N input (Fig. 2). Nonetheless, SOC accumulation in each future period that was estimated by DAISY was overall negative relative to its baseline. A decrease in SOC over the entire simulation period at 80 kg/ha N input was also suggested by FASSET, but when N input was 162 and 240 kg/ha, it indicated a slight increase in SOC in the second half of the simulation period, especially when N input was 240 kg/ha (Fig. 2). By the end of the simulation period, FASSET also indicated a negative SOC accumulation.
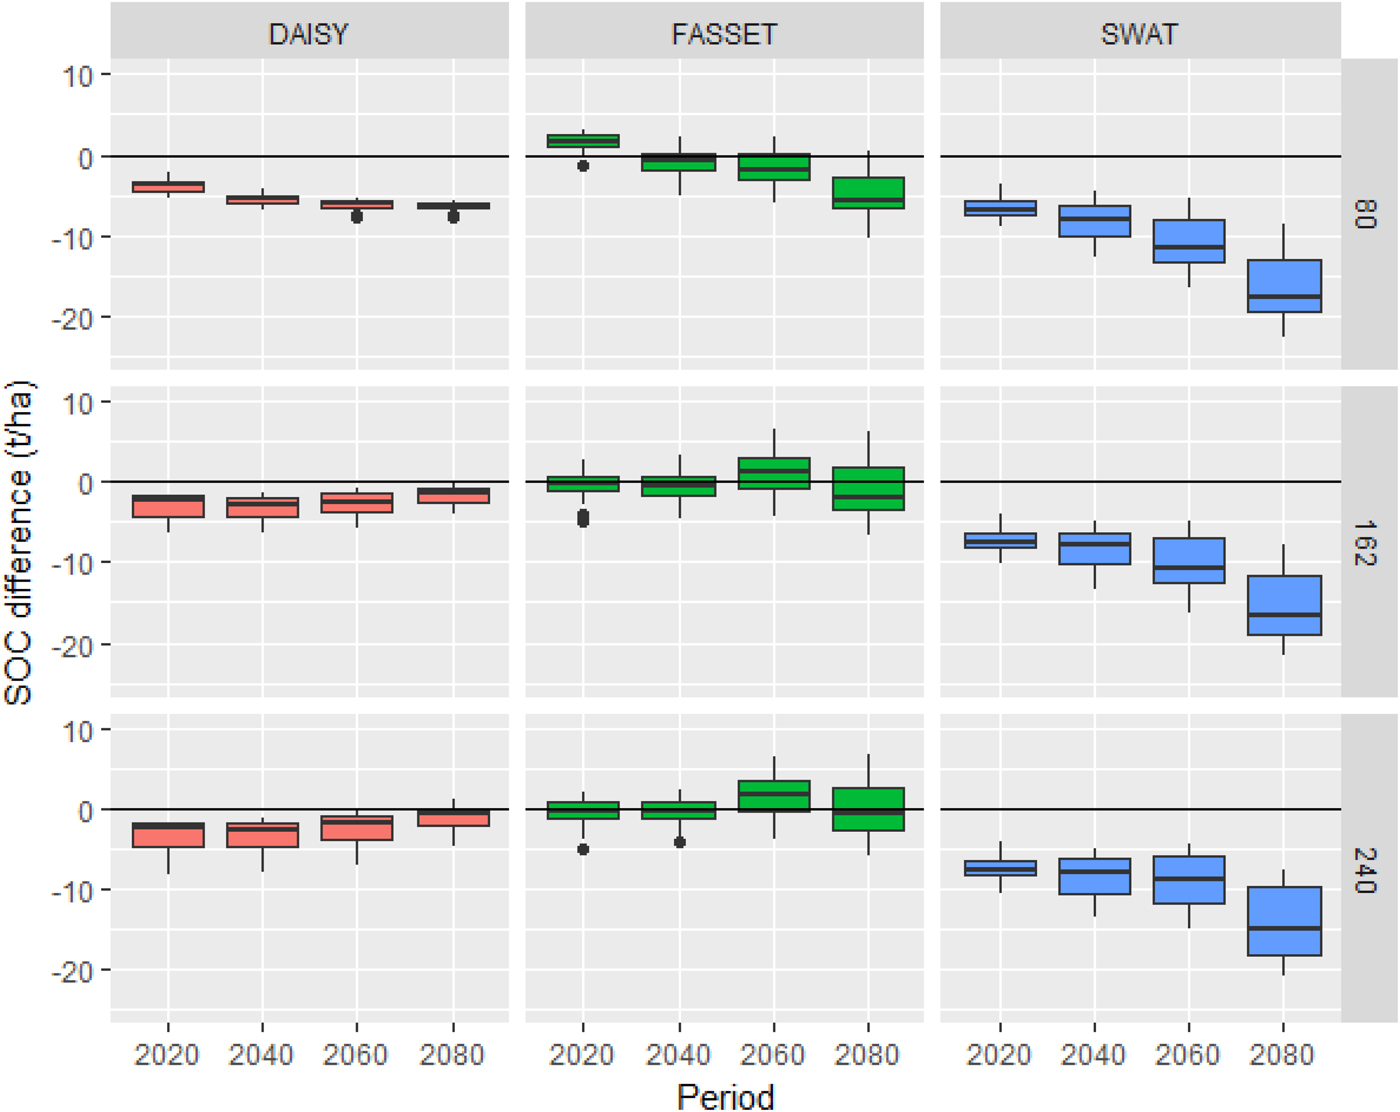
Fig. 2. The difference in soil organic carbon (SOC) between baseline average (1991–2010) and the future in four time periods (2020: 2011–2030, 2040: 2031–2050, 2060: 2051–2070, 2080: 2071–2090) in relation to each soil model and different N inputs at 80, 162 and 240 kg N/ha. The bars represent the difference between the future and the baseline period. (A different year in a 20-year future period was subtracted from the baseline average 20 times.) The positive values show increase, negative values show decrease relative to the baseline. Due to insignificant contribution of regional circulation models (RCM) to the total variance of the random variation in estimating SOC, the data were not shown with respect to RCM. Colour online.
Particularly in FASSET simulations, SOC was positively affected by N input. For example, C that was retained in the soil at 162 kg N/ha was always higher than SOC retained at 80 kg N/ha by the end of the century. The fastest decrease in SOC over time characterized SWAT, and like DAISY, SOC accumulation was never positive at any of the N input levels.
Unlike the baseline simulations, the likelihood comparison of mixed models suggested that SOC was indeed affected significantly by the interactive effect of N input and time during which the temperature, precipitation and CO2 concentration changed. The analysis suggested that only 0.4% of the total variance of random effects was attributed to RCM, and approximately 99% random variation was attributed to crop-soil models. The remaining 0.6% of the total variance was attributed to the random error. Overall, the crop-soil models contributed to almost all of the uncertainty in estimating SOC in response to climate change.
Nitrogen leaching
The baseline N leaching estimations are presented in Table 3. In general, while DAISY indicated the least amount of N leached, SWAT indicated the largest with FASSET in between. In response to climate change, all the models indicated increased leaching in relation to their baselines (Fig. 3), except DAISY under HIRHAM5 and HadRM3 projections.

Fig. 3. The difference in annual leaching between baseline average (1991–2010) of each regional circulation model (RCM: HadRM3, HIRHAM5, RCA3, RM5.1), and the future in four time periods (2020: 2011–2030, 2040: 2031–2050, 2060: 2051–2070, 2080: 2071–2090) in relation to each soil model and different nitrogen (N) inputs at 80, 162 and 240 kg N/ha. The bars represent the difference between the future and the baseline period. (A different year in a 20-year future period was subtracted from the baseline average 20 times.) The positive values show increase, negative values show decrease relative to the baseline. Colour online.
The likelihood comparison indicated that there was no significant interactive effect of N input and time on N leaching in the soil. However, while the sole effect of time was highly significant, the sole effect of N input was found to be less significant (0.01 < P < 0.05). The mixed-effect analysis further indicated that ≈23% of the total variance of the random variation was attributed to RCM and ≈76% to crop-soil models. The remaining ≈1% of the variation was due to random error. Overall, the crop-soil models contributed most to the uncertainty in estimating N leaching in response to climate change.
Denitrification
Relative to the baseline simulations, models generally indicated increased denitrification (Fig. 4), with N loss through denitrification higher under the warmest climate projection (HadRM3). The likelihood comparison suggested that there was a significant interactive effect of N input and time on denitrification (P < 0.01). The mixed-effects analysis further suggested that 81% of the total variance of random variation was attributed to crop-soil models in predicting the denitrification, while 18% of the variation was due to RCM.

Fig. 4. The difference in annual denitrification between baseline average (1991–2010) of each regional circulation model (RCM: HadRM3, HIRHAM5, RCA3, RM5.1), and the future in four time periods (2020: 2011–2030, 2040: 2031–2050, 2060: 2051–2070, 2080: 2071–2090) in relation to each soil model and different nitrogen (N) inputs at 80, 162 and 240 kg N/ha. The bars represent the difference between the future and the baseline period. (A different year in a 20-year future period was subtracted from the baseline average 20 times.) The positive values show increase, negative values show decrease relative to the baseline. Colour online.
Discussion
The crop-soil models
Results from simulation studies are associated with imprecision known as model uncertainty (Ogle et al. Reference Ogle, Breidt, Easter, Williams and Paustian2007), which was addressed by including the models in statistical analyses as random variables so that the contribution of each model to the total variance of random variation could be quantified. In the current study, the contribution of crop-soil model to the variation was highest in SOC estimation and denitrification, suggesting crop-soil model as being the main source of uncertainty. In calculating SOC, it can be speculated that simulation of warming effects on organic matter decomposition was probably the main source of uncertainty. Smith et al. (Reference Smith, Fang, Dawson and Moncrieff2008) suggested that temperature sensitivity on organic matter decomposition changes according to SOC pools. In DAISY and FASSET, the effect of temperature on decomposition rate is identical in different C pools; however, in SWAT, in addition to different C pool structure, the effect of temperature on decomposition rate is also different.
At elevated CO2, the C : N ratio of plant residue is expected to affect SOC and productivity. The models did not consider the C : N ratio of plant residue specifically, but allowed a change in C : N ratio of the soil through N uptake mechanism; depending on the amount of N taken up by the (previous) crop, the C : N ratio of active pools changes. Ecosystem C accumulation is constrained by nutrients, particularly N, through mechanisms that are not yet well developed in, or are absent from, the models. It can be suggested that new factors, such as litter quality or CO2 acclimation of C3 plants, that affect SOC turnover under climate change should be implemented in the models.
Increased crop residues returned to the soil after harvest, due to increased biomass under elevated CO2, was not estimated to be sufficient to maintain SOC under changing climate. However, each model includes the effect of elevated CO2 on biomass accumulation in a different way. It is highly probable that estimation of the contribution from crop residues to SOC in fact added to the total variance of random variation. The high uncertainty stemming from the crop-soil models prevents discovery of the plausible long-term effect of crop residue on SOC accumulation. Similarly, the greatest portion of the variation in climate change projections was indeed attributed to the models themselves (Asseng et al. Reference Asseng, Ewert, Rosenzweig, Jones, Hatfield, Ruane, Boote, Thorburn, Rotter, Cammarano, Brisson, Basso, Martre, Aggarwal, Angulo, Bertuzzi, Biernath, Challinor, Doltra, Gayler, Goldberg, Grant, Heng, Hooker, Hunt, Ingwersen, Izaurralde, Kersebaum, Muller, Kumar, Nendel, O'Leary, Olesen, Osborne, Palosuo, Priesack, Ripoche, Semenov, Shcherbak, Steduto, Stockle, Stratonovitch, Streck, Supit, Tao, Travasso, Waha, Wallach, White, Williams and Wolf2013).
Soil organic carbon
The initial SOC estimations by the crop-soil models were close to the 110 t/ha calculated through measurements, initially suggesting the models were suitable to assess C changes in response to abiotic factors under current climatic conditions. However, even though the initial conditions, crop rotation, climate and soil management were identical, the course of SOC simulated by the models over the baseline period was different.
There are various results in the literature on SOC development in arable lands; the baseline trend of SOC in the current study was partially in agreement with another study by Hamelin et al. (Reference Hamelin, Jorgensen, Petersen, Olesen and Wenzel2012) that was carried out in Denmark only if the estimates by individual models were pooled. Hamelin et al. (Reference Hamelin, Jorgensen, Petersen, Olesen and Wenzel2012) reported approximately 5 t C/ha increase over 20 years on sandy loam when winter wheat straw was incorporated into the soil after harvest. However, they reported that SOC content at 0–25 cm decreased approximately 0.2 t/ha annually over 10–12 years on loamy soils to which only mineral fertilizer was applied. Similar to the current baseline scenario conditions, when the straw was removed, Hamelin et al. (Reference Hamelin, Jorgensen, Petersen, Olesen and Wenzel2012) reported a decrease at 1.5 t C/ha over 20 years.
A meta-analysis showed that, until now, biomass and SOC stocks in croplands have been increasing, mainly due to gradually intensified crop production throughout the 20th century (Gervois et al. Reference Gervois, Ciais, de Noblet-Ducoudre, Brisson, Vuichard and Viovy2008). In the current simulations by SWAT and FASSET, it can be speculated that SOC gained equilibrium via the initial parameter values over the baseline period, and since both climate and cropping management were kept constant, the models suggested neither significant gain nor loss of SOC.
In response to climate change, crop-soil models indicated varying trends; both increasing and decreasing by FASSET, and an increasing trend, (except at 80 kg N input) but overall negative C accumulation relative to baseline by DAISY, and constantly decreasing trend and negative accumulation of SOC by SWAT. Nitrogen input and the RCM projections seemed to have an effect on SOC estimations in FASSET and DAISY, since under milder climate (HIRHAM5, RM5.1) and higher N input rates, SOC estimations suggested an increasing trend. This interaction between climate variables and N input was also highlighted by the mixed-effect analysis.
In regulating SOC decomposition, soil water content and temperature are very important factors (Craine et al. Reference Craine, Fierer and McLauchlan2010; Lefevre et al. Reference Lefevre, Barre, Moyano, Christensen, Bardoux, Eglin, Girardin, Houot, Katterer, van Oort and Chenu2014), thus the size of C stocks in croplands determined by the net balance between primary (crop) production and the respiration of soil microbes. Faster C turnover associated with higher temperatures result in the loss of SOC, because losses predominantly stem from respiration of soil microbes, which increases with increasing temperature where soil moisture allows (Settele et al. Reference Settele, Scholes, Betts, Bunn, Leadley, Nepstad, Overpeck, Taboada, Field, Barros, Dokken, Mach, Mastrandrea, Bilir, Chatterjee, Ebi, Estrada, Genova, Girma, Kissel, Levy, MacCracken, Mastrandrea and White2014). The decrease in SOC is accordingly estimated under warmer climate by earlier studies (Trumbore et al. Reference Trumbore, Chadwick and Amundson1996; Riley & Bakkegard Reference Riley and Bakkegard2006; Heikkinen et al. Reference Heikkinen, Ketoja, Nuutinen and Regina2013; Ziegler et al. Reference Ziegler, Billings, Lane, Li and Fogel2013). In the current simulations, SWAT indicated a constant decrease in SOC under climate change, regardless of time period and the degree of RCM projections. Estimations from FASSET and DAISY differed by RCM and N input. Overall, depending on the severity of climate change, the simulations indicated that decomposition rate of SOC in Denmark under a mono-crop regime will surpass accumulation by the mid-century due to climate change. The same trend was also predicted by Smith et al. (Reference Smith, Smith, Wattenbach, Zaehle, Hiederer, Jones, Montanarella, Rounsevell, Reginster and Ewert2005) for Northern Europe.
To maintain higher SOC accumulation under elevated CO2, additional N input is required (Hungate et al. Reference Hungate, Dukes, Shaw, Luo and Field2003). In a long-term study from southern Sweden (1957 to current), it was found that N fertilization rate and C accumulation in the soil was positively and significantly correlated (Carlgren & Mattsson Reference Carlgren and Mattsson2001; Katterer et al. Reference Katterer, Bolinder, Berglund and Kirchmann2012). The analysis of the current study showed that SOC was indeed affected by N input and time (climate) interactively. The significant effect predicted in the current simulations was probably due to increased amounts of crop residues under higher N inputs. The higher N input resulted in relatively higher SOC accumulations, yet the loss of C could not be compensated solely by additional N input under climate change.
Soil productivity and nitrogen losses
The current simulation study suggested that increased amount of crop residues returned to soil, or increased N fertilization, would not translate into increases in cropland C stocks in the longer term. It is well known that the C : N ratio of residues affects soil N availability, and is highly significant to understand the consequences for agriculture under elevated CO2. There are two direct consequences; firstly, a high C : N ratio of crop residues affects soil N availability because it leads to enhanced N immobilization and/or reduced N mineralization (Torbert et al. Reference Torbert, Prior, Rogers and Wood2000; Gill et al. Reference Gill, Polley, Johnson, Anderson, Maherali and Jackson2002; Viswanath et al. Reference Viswanath, Pal and Purakayastha2010), and secondly, reduction in the food quality of consumed plant material due to depleted organic N in the crop (Taub et al. Reference Taub, Miller and Allen2008; Bloom Reference Bloom2009; Bloom et al. Reference Bloom, Burger, Rubio-Asensio and Cousins2010). Further, the balance between mineralization and immobilization affects the availability of inorganic N to plants; while denitrification and leaching contributes to ecosystem N losses (Wrage et al. Reference Wrage, Velthof, van Beusichem and Oenema2001), mineralization allows N to be accessible for plants in nitrate and ammonium form.
The models showed an increasing trend in denitrification in response to climate change. The mixed-effect analysis indicated that denitrification is significantly affected by the amount of N input, suggesting the increased N added to the cropping system might not increase available N in the soil, but might instead be simply emitted into the atmosphere.
While RCM was found to be an important factor in the estimation of denitrification rate in response to climate change, a large proportion of the uncertainty was attributed to crop-soil models. The current analysis thereby also highlighted the effect of crop-soil models in estimating denitrification. Nevertheless, all models predicted generally higher N denitrification by the end of the century than at the beginning of the simulation period. It was reported in an experimental study by Niboyet et al. (Reference Niboyet, Le Roux, Dijkstra, Hungate, Barthes, Blankinship, Brown, Field and Leadley2011) that long-term N addition and increased precipitation had significantly increased potential denitrification, while elevated CO2 and warming had not. It was further reported by a meta-analysis that elevated CO2 also increased N immobilization due to microbial N demand (de Graaff et al. Reference de Graaff, van Groenigen, Six, Hungate and van Kessel2006), although the response of N immobilization to elevated CO2 often varied among studies.
Contrary to the baseline simulations, simulations of future periods suggested that N addition into the cropping system was not a highly significant factor on N leaching in soil (0.01 < P < 0.05). According to mixed-effect analysis, leaching was mostly affected by time. This is probably because of the substantial increase in temperature in the future relative to the baseline.
The crop-soil models and the choice of RCM were both important factors in the estimated rates of N leaching which, like denitrification, was also marked by an increasing trend, except under HadRM3 and HIRHAM5 projections at 240 kg N/ha input simulated by DAISY. Earlier studies suggested that warming increased mineralization and therefore leaching potential (Rustad et al. Reference Rustad, Campbell, Marion, Norby, Mitchell, Hartley, Cornelissen and Gurevitch2001; Guntinas et al. Reference Guntinas, Leiros, Trasar-Cepeda and Gil-Sotres2012). Under warmer conditions in Denmark, enhanced N leaching was indeed predicted (Olesen et al. Reference Olesen, Askegaard, Berntsen, Hatch, Chadwick, SC and Roker2004). Under elevated CO2 however, more N is required by future grain cropping systems just to sustain grain yields (Lam et al. Reference Lam, Chen, Norton, Armstrong and Mosier2012, Reference Lam, Chen, Norton and Armstrong2013) and grain quality (Kimball et al. Reference Kimball, Morris, Pinter, Wall, Hunsaker, Adamsen, LaMorte, Leavitt, Thompson, Matthias and Brooks2001; Bloom et al. Reference Bloom, Burger, Rubio-Asensio and Cousins2010; Hogy et al. Reference Hogy, Brunnbauer, Koehler, Schwadorf, Breuer, Franzaring, Zhunusbayeva and Fangmeier2013; Fernando et al. Reference Fernando, Panozzo, Tausz, Norton, Fitzgerald, Myers, Nicolas and Seneweera2014). On the other hand, increased N through increased fertilization may not compensate CO2-induced reduction in grain N concentration in the future due to CO2 acclimation (Dukes et al. Reference Dukes, Chiariello, Cleland, Moore, Shaw, Thayer, Tobeck, Mooney and Field2005; Korner Reference Korner2006). The current study indicated that more N input would not be economically or environmentally feasible considering the potential increase in leaching and emissions under climate change.
Conclusions
The current study investigated interactive effects between climate variables in the 21st century under A1B emission scenario, and C and N supply on SOC–N dynamics using three dedicated crop-soil models under a continuous winter wheat rotation. The findings included the highly significant contribution of the models to the uncertainty of estimation of SOC, and its relationship with mineral N. The choice of RCM was found to be an important factor in estimating N losses. It was found that, while individual estimations of N leaching and denitrification by the models were different, overall estimations of N losses were similar.
The current study emphasized that mono-culture grain production in Denmark will probably experience more SOC losses than gains in the future unless adaptation measures are developed and implemented. In addition, grain quality is likely to decrease due to diluted organic N content in the plants, as indicated by increased N losses. In this respect, mono-cropping systems based solely on mineral fertilization will not be a sustainable crop production method under a warmer and wetter climate.
Acknowledgements
This study was funded by the Danish Strategic Research Council for the Centre for Regional Change in the Earth System (Grant Number: DSF-EnMi 09-066868). The authors acknowledge the contribution by the Danish Meteorological Institute in relation to gridded weather data.


