Introduction
Maize (Zea mays L.) is one of the most widely planted crops in the world, accounting for approximately 37.2% of global cereal production (FAO, 2016). As increasing in global population, human consumption and animal feed, maize demand will further rise which would except to double by 2050 (CIMMYT, 2011). The production of maize depends on both planting area and yields, and meeting the increased demand will require an increased in one or both of these factors. In recent decades, maize yields have been greatly improved, which is mostly due to fertilizer applications and irrigation (Zhou et al., Reference Zhou, Sun, Wang, Ding, Li, Ma and Zhao2019; Yu et al., Reference Yu, Jiang, Wang, Kattel, Chuai, Shang, Zou and Miao2022). However, climate change has led to disasters such as droughts, floods and extreme temperature events that cause significant damage to crop growth and yield, posing a threat to local and global food security (Corey et al., Reference Corey, Pedram and Navin2016; Schmitt et al., Reference Schmitt, Offermann, Söder, Frühauf and Finger2022; Rohde, Reference Rohde2023). Therefore, timely and robust scientific information is essential to develop effective disaster risk management strategies and prevent damages to ensure global food security.
Meteorological disasters, particularly heat stress, are the primary contributors to the fluctuation of maize production under climate change (Zhao et al., Reference Zhao, Liu, Piao, Lobell, Huang, Huang, Yao, Bassu, Ciais, Durang, Elliott, Ewert, Janssens, Li, Lin, Liu, Martre, Müller, Peng, Peñuelas, Ruane, Wallach, Wang, Wu, Liu, Zhu, Zhu and Asseng2017; Lizaso et al., Reference Lizaso, Ruiz-Ramos, Rodríguez, Gabaldon-Leal, Oliveira, Lorite, Sánchez, García and Rodríguez2018; El-Sappah et al., Reference El-Sappah, Rather, Wani, Elrys, Bilal, Huang, Dar, Elashtokhy, Soaud, Koul, Mir, Yan, Li, El-Tarabily and Abbas2022). From 2001 to 2020, the global average temperature was estimated to have reached 0.84–1.10°C higher values than the period from 1850 to 1990 (IPCC, 2021). The global rise in surface temperature will result in increased frequency, duration and the magnitude of extreme high temperature events (Huo et al., Reference Huo, Zhang, Li, Kong and Jiang2023; IPCC, 2023). Since the 1980s, China's surface temperature increased and was greater at higher northern latitudes (Liu, Reference Liu2018; Huo et al., Reference Huo, Zhang, Li, Kong and Jiang2023). These changes will have considerable impacts on agricultural production (Lobell et al., Reference Lobell, Schlenker and Costa-Roberts2011; Wang et al., Reference Wang, Zhang, Song, Chen, Wei, Shi and Tao2014).
The Huang-Huai-Hai (HHH) Plain, located in eastern China, accounted for 32 and 34% of the maize planting area and maize production in China, respectively (Liu, Reference Liu2012). The planting area and yield of maize in this region increased during the past decades (Xue et al., Reference Xue, Ma and Hu2016; Jiang et al., Reference Jiang, Liu and Gao2018). However, the rising summer temperatures (Gao et al., Reference Gao, Guo, Chen and Han2009) have led to an increase in the frequency and intensity of heat stress during the critical period of summer maize (Wang et al., Reference Wang, Liao, Huang, Ming and Meng2018), which will lead to an increasing risk of heat stress during the critical period of summer maize (Zhang et al., Reference Zhang, Zhang, Chen, Wei and Song2018b; Zhang et al., Reference Zhang, Han and Yang2021a). The post-silking period (PSP) is the sensitive period to heat stress, which is critical to maize kernel dry matter accumulation and yield formation (Lizaso et al., Reference Lizaso, Ruiz-Ramos, Rodríguez, Gabaldon-Leal, Oliveira, Lorite, Sánchez, García and Rodríguez2018; Wang et al., Reference Wang, Sheng, Zhang, Dong, Yan, Hou, Wang and Huang2021). During this period, heat stress can cause the pollen-sterilization, reduce the grain-filling rate, shorten the duration of the period, lower the kernel weight (Mayer et al., Reference Mayer, Edreira and Maddonni2014; Wang et al., Reference Wang, Sheng, Zhang, Dong, Yan, Hou, Wang and Huang2021), resulting in a significant yield loss (Yang et al., Reference Yang, Shen, Lu and Lu2017; Zhang et al., Reference Zhang, Chen, Geng, Gao, Zheng, Zhang and Wang2017). For each 1°C increase, the yield decreases by 2.4% (Lu et al., Reference Lu, Yu, Cao and Chen2015). Therefore, understanding the hazard of heat stress during the PSP of summer maize is crucial for defending against heat stress damage, managing production and reducing economic losses in agricultural production.
However, there were few studies focused on the hazard of heat stress during the PSP of maize (Couëdel et al., Reference Couëdel, Edreira, Lollato, Archontoulis, Sadras and Grassini2021; Gao et al., Reference Gao, Feng, Liang, Lin, Zhao, Shen, Du, Cui and Zhou2021). Moreover, there is no clear threshold for classification of heat stress during the PSP of maize. Therefore, the objectives of this study are to: (i) investigate the long-term variation trends of accumulated heat stress days (DAY), heat stress intensity (HSI) and heat degree-days (HDD) during the PSP of summer maize; (ii) to construct the index of classification for heat stress in the PSP of summer maize; and (iii) to assess the hazard of heat stress in the PSP of summer maize in the historical period (1981–2019) and future period (2020–2100).
Materials and methods
Research area
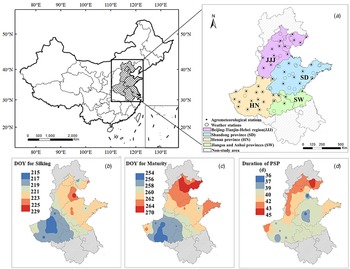
This study was conducted in the HHH Plain of China, including four sub-regions: Beijing-Tianjin-Hebei region (Jing-Jin-Ji, JJJ), Shandong province (SD), Henan province (HN) and parts of Anhui and Jiangsu province (Su-Wan, SW) (Fig. 1a). This region belongs to East Asian Temperate Monsoon Climate zone. During the maize growing season (From June to September), the mean maximum temperature ranged from 22.9 to 35.0°C, the mean minimum temperature ranged from 12.3 to 26.2°C; the total precipitation ranged from 345 to 1015 mm, and the average solar radiation per day ranged from 20.6 to 25.3 MJ/m2 (Tian, Reference Tian2016; Zheng et al., Reference Zheng, Hu, He, Xing, Gao, Liu, Ma and Pan2022). The main cropping system is double cropping, which is dominated by winter wheat and summer maize rotation (Zhang et al., Reference Zhang, Ge, Ma, Ding, Wang, Li, Zhou and Zhao2022).

Figure 1. (a) The locations selected in the Huang-Huai-Hai Plain in China. Lines show province boundaries. Sub-regions are named in italic. (b) and (c) are the averages of DOY (day of year) for silking and maturity dates and (d) is the duration of post-silking period (PSP, from silking to maturity).
Climate and crop data
In this study, 64 weather stations were selected from the National Meteorological Networks of the China Meteorological Administration (CMA) (Fig. 1a). Climate data included daily maximum temperatures from 1981 to 2019 at each station. Projected daily maximum temperature data were selected from Sixth Coupled Model Intercomparison Project (CMIP6; https://esgf-node.llnl.gov/projects/cmip6/) (with the resolution of 0.5° × 0.5°), under three SSP scenarios (SSP1–2.6, SSP3–7.0 and SSP5–8.5) in two time periods of the 21st century: the 2040s (2020–2060) and the 2080s (2061–2100). We selected five GCMs (GFDL-ESM4, IPSL-CM6A-LR, MPI-ESM1.2-HR, MRI-ESM2.0, UKESM1.0-LL). The observational reference dataset used for bias adjustment and statistical downscaling in the above data is version 2.0 of WFDE5 over land merged with ERA5 over the ocean (W5E5) (Cucchi et al., Reference Cucchi, Weedon, Amici, Bellouin and Buontempo2020; Lange et al., Reference Lange, Menz, Gleixner and Müller2021). This dataset covers 1979–2019 at daily temporal resolution and the entire globe at 0.5° spatial resolution. The algorithm has been adjusted and improved on the basis of version 1.0 to avoid the occurrence of excessive daily maximum temperature values in some grid cells in some months, making it closer to historical climate data. The original climate scenario data were extracted from the Intersectoral Impact Model Intercomparison Project (ISI-MIP, https://data.isimip.org/search/). The maize phenology data, including silking and maturity dates, were obtained from 42 agricultural meteorological experiment stations (Wu et al., Reference Wu, Zhang, Ge, Xing, Han, Chen and Kong2021; Tao et al., Reference Tao, Zhang, Zhang and Chen2022). The observations of above have uniform CMA observing standards and guidelines (Liu et al., Reference Liu, Hubbard, Lin and Yang2013).
We referred to the period from silking to maturity as the PSP. According to the decadal averages of silking and maturity dates of PSP (Table 1), there was little changes after 2000, therefore, we used the silking and maturity dates in 2013 to fill up the missing records after 2013. The inverse distance weighted interpolation method was used to interpolate the phenology data from agricultural meteorological experiment stations to entire research area. Then we extracted the phenology data for the 64 weather stations according to the latitude and longitude (Figs 1b–d).
Table 1. Averages of silking and maturity dates and the duration of post-silking period (silking to maturity) of summer maize in the four sub-regions during 1981–2019

*JJJ, Beijing-Tianjin-Hebei region; SD, Shandong province; HN, Henan province; SW, Jiangsu and Anhui provinces.
Methodology to hazard assessment of heat stress
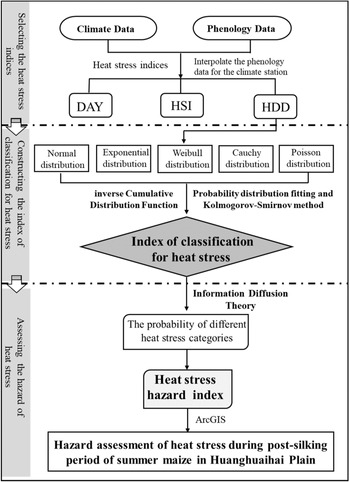
Three steps are included in the framework for hazard assessment of heat stress (Fig. 2).

Figure 2. Flow chart showing the procedure used to make hazard assessment of heat stress to summer maize during the post-silking period. DAY, accumulated heat stress days; HSI, heat stress intensity; HDD, heat degree-days.
Step 1. Selecting the heat stress indices.
To comprehensively evaluate the occurrence and impact of heat stress during the PSP of summer maize, three heat stress indices were developed, including HSI, accumulated heat stress days (DAY) and HDD. These indices were based on daily maximum temperature during the PSP. DAY is the number of days with Tmax,i ⩾ 30°C, calculated with Eqns (1) and (2) (Schauberger, et al., Reference Schauberger, Archontoulis, Arneth, Balkovic, Ciais, Deryng, Elliott, Folberth, Khabarov, Müller, Pugh, Rolinski, Schaphoff, Schmid, Wang, Schlenker and Frieler2017). HSI is the average of daily maximum temperature for days when Tmax,i ⩾ 30°C. HDD is the total HDD during the PSP considered the frequency, duration and intensity of heat stress, calculated with Eqns (3) and (4) (Shimono, 2011).


where ds is the silking date; dm is the maturity date; Th is the threshold temperature for heat stress of maize (30°C); Tmax,i is daily maximum temperature on day i (CMA, 2008; Lobell et al., Reference Lobell, Hammer, McLean, Messina, Roberts and Schlenker2013).
Step 2. Constructing the index of classification for heat stress.
Five types of probability distribution models (Normal, Exponential, Weibull, Cauchy and Poisson) were used to fit the probability distribution curve of HDD at each site, which shown in Eqns (5)–(9) (Huo and Jiang, Reference Huo and Jiang2006; Yang et al., Reference Yang, Huo, Li, Wang and Wu2020). The maximum likelihood estimation method was used to estimate the parameters in the model. Then optimal probability distribution function was selected based on the Kolmogorov–Smirnov method (K-S) at each site.


Based on HDD optimal probability distribution function, the inverse Cumulative Distribution Function (iCDF) was used to determine the threshold of different heat stress categories. Referring to Yang et al. (Reference Yang, Huo, Wang, Wu, Mao and Kong2021), iCDF (0.25), iCDF (0.50) and iCDF (0.75) were taken as the lower limit of mild, moderate and severe heat stress. Therefore, the classification of heat stress intensities based on the range of HDD values was made into three different heat stress categories.
Step 3. Accessing the hazard of heat stress.
Based on established index for different heat stress categories, the information diffusion theory (Huang, Reference Huang2005) was used to calculate the possibility (Pi) of heat stress in level i to assess the hazard of different heat stress categories. The information diffusion theory has been widely used in disaster risk assessment and allowed for more accuracy in risk estimation (Hao et al., Reference Hao, Zhang and Liu2012; Liu et al., Reference Liu, You, Zhu, Wang and Ran2019).
Considering the probability and intensity of different heat stress categories, the heat stress hazard index (M) is constructed as follows:

where n is the disaster intensities, n = 3; Qi is the weight of intensity for each level, that is, the weights of mild, moderate and severe level were 1, 2 and 3, respectively (Yang et al., Reference Yang, Huo, Wang, Wu, Mao and Kong2021); Pi is the possibility of heat stress for summer maize in level i, which is calculated by information diffusion theory.
Results
Spatial variation of heat stress during post-silking period
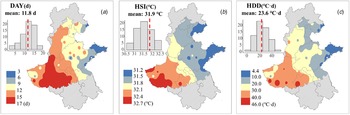
At the regional scale, we found the average DAY, HSI and HDD in the HHH Plain was 11.8 d (3–17 d), 31.9°C (31.2–32.7°C) and 23.6°Cd (4.4–46.0°Cd) during 1981 to 2019, respectively. There was obvious spatial consistency among these three heat stress indices, and the main hotspots of heat stress occurred in the southwest regions (parts of HN and SW sub-regions) (Fig. 3).

Figure 3. Heat stress indices during the post-silking period averaged over 1981–2019 in the Huang-Huai-Hai Plain of China. The histogram is the site distribution of DAY, HSI, HDD and the red dashed line indicates the mean value. (a) DAY, accumulated heat stress days; (b) HSI, heat stress intensity; (c) HDD, heat degree-days.
The average value of DAY in the HN sub-region was up to 15 days, which is 5 d more than that of SD sub-region. The average HSI in the HN sub-region was above 32.0°C, which is 0.4°C higher than SW and 0.7°C higher than the SD and JJJ sub-regions. The average HDD in HN and SW were 35.2 and 30.0°Cd, respectively, about two times than that in JJJ and SD sub-regions.
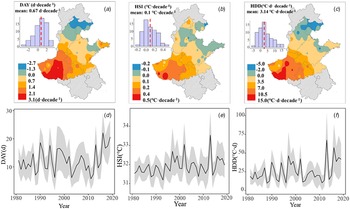
Trends of heat stress during post-silking period
At the regional scale, DAY, HSI and HDD during the PSP increased with an average rate of 0.67 d/decade, 0.1°C/decade and 3.14°Cd/decade over the last four decades (Fig. 4). Spatially, the trend of DAY, HSI and HDD were ranged −2.7~3.1 d/decade, −0.2~0.5°C/decade and −5~15°Cd/decade, respectively. The trend of heat stress is high in southwest regions but relatively slow in the northeast regions. The heat stress in the JJJ sub-region showed an overall downward trend, the average trends of DAY, HSI and HDD were −1.3 d/decade, −0.1°C/decade and −5°Cd/decade. And sub-regions with the largest increase is HN, followed by SW. The trends of DAY, HSI and HDD in HN were 2.1 d/decade, 0.3°C/decade and 6.7°Cd/decade, respectively, and in SW were 1.4 d/decade, 0.2°C/decade and 6°Cd/decade. However, no significant trends were observed in SD sub-region.

Figure 4. Temporal trends of heat stress indices during the post-silking period of averaged over 1981–2019 in the summer maize in the Huang-Huai-Hai Plain of China. The histogram is the site distribution of DAY, HSI, HDD and the red dashed line indicates the mean trend. (a) is the tendency rate of DAY (accumulated heat stress days); (b) is the tendency rate of heat stress intensity (HSI); (c) is the tendency rate of heat degree-days (HDD). (d), (e) and (f) is the temporal trend of DAY, HSI and HDD from 1981 to 2019; the black line is the mean value of the time series in the Huang-Huai-Hai Plain and the grey fill area refers to one standard deviation of time series.
Construction of the index of classification for heat stress
According to the results of K-S test, among the 64 sites, the optimal distribution of HDD sequences in 45 (70%) sites was Weibull distribution (Table 2). Therefore, the Weibull distribution was selected as the optimal distribution function of HDD.
Table 2. Fitting function test results of each station in The Huang-Huai-Hai Plain

The cumulative probability function of the Weibull distribution for HDD was shown in Fig. 5. Then, the iCDF was used to determine the threshold of heat stress classification. iCDF (25%), iCDF (50%) and iCDF (75%) were 9.4, 19.4 and 34.2°Cd, respectively. Therefore, the index range for three classifications of heat stress during the PSP of summer maize in the HHH Plain was obtained (Table 3).

Figure 5. The cumulative probability distribution functions of Weibull distribution of HDD (heat degree-days) during the post-silking period of summer maize.
Table 3. Classification of heat degree-days (HDD) during the post-silking period of summer maize in The Huang-Huai-Hai Plain

Hazard assessment of heat stress for summer maize
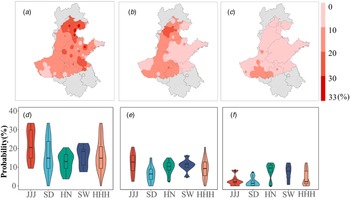
The regional mean hazard probability of mild, moderate and severe heat stress were 16.6, 9.3 and 4.5%, respectively. We found that there was obvious difference for major heat stress categories for each sub-region (Fig. 6). In HN sub-region, there were similarly values of hazard probability for mild, moderate and severe heat stress, with the region average were 12.6, 10.1 and 8.6%, respectively. However, the heat stress in JJJ sub-region was mainly characterized by mild and moderate categories. The probability of mild heat stress ranged from 9.3 to 33.5% with the average of 21.6%; the maximum probability of moderate heat stress was 20.8%, and the minimum value was 3.5%; the probability of severe heat stress was less than 10%. The SW sub-region is mainly mild (16.3%) and moderate (10.9%) categories. For SD sub-region, the heat stress was mainly mild heat stress (0~33.5%), and moderate and severe heat stress hazard probability were less than 10%.

Figure 6. Hazard probability of different categories of heat stress during the post-silking period of summer maize in the Huang-Huai-Hai Plain of China. (a, d) Mild heat stress, (b, e) Moderate heat stress, (c, f) Severe heat stress. (JJJ, Beijing-Tianjin-Hebei region; SD, Shandong province; HN, Henan province; SW, Jiangsu and Anhui provinces; HHH, the Huang-Huai-Hai Plain).
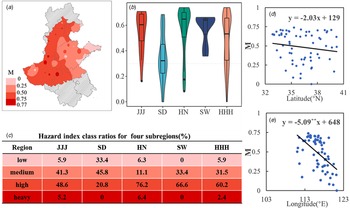
At the regional scale, the heat stress hazard index (M) was 0.48 during 1981 to 2019 (Fig. 7). Spatially, the heat stress hazard index ranged from 0 to 0.77, and longitudinal gradients (P < 0.01) were found. Thus, the highest values were in the western regions, but relative lower values were located in the eastern regions.

Figure 7. (a, b) Hazard probability of heat stress during the post-silking period of summer maize in the Huang-Huai-Hai Plain of China. (c) Hazard index class rations for four sub-regions (heavy level with M index larger than 0.75; high level with M index between 0.5 and 0.75; medium level with M index between 0.25 and 0.5; low level with M index no greater than 0.25). (d, e) Correlations between the hazard probability of heat stress for summer maize and (d) latitude and (e) longitude during the post-silking period (JJJ, Beijing-Tianjin-Hebei region; SD, Shandong province; HN, Henan province; SW, Jiangsu and Anhui province; HHH, the Huang-Huai-Hai Plain). **, * indicate significance at P < 0.01, and P < 0.05.
During 1981–2019, areas of four levels of hazard of heat stress, low, medium, high and heavy accounted for 5.9, 31.5, 60.2 and 2.4% of the study region's area (Fig. 7c), respectively. High (with M index between 0.5 and 0.75) and heavy (with index larger than 0.75) hazard was detected in HN, western SW, most JJJ and western SD sub-regions. Medium (with index between 0.25 and 0.5) hazard was mainly in central SD and eastern SW sub-regions, and low (with index no greater than 0.25) hazard was in eastern SD sub-region.
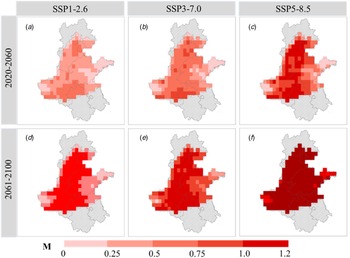
Heat stress hazard index (M) will increase in the future at all regions (Fig. 8), particularly after 2060. Under SSP1–2.6, M were 0.34 and 0.43 in 2040s and 2080s, which similar to the values during the historical period. Under SSP3–7.0, M changed from 0.63 to 0.88 in the 2020 to 2100, and 0.40 higher than historical. Under SSP5–8.5, M ranged from 0.41 to 1.10, 0.95 to 1.20 during the 2040s and 2080s respectively, about two times than historical period.

Figure 8. Hazard probability of heat stress during the post-silking period of summer maize in the Huang-Huai-Hai Plain of China under SSP1–2.6 (a, d), SSP3–7.0 (b, e) and SSP5–8.5 (c, f) (the average value of five GCM models: GFDL-ESM4, IPSL-CM6A-LR, MPI-ESM1.2-HR, MRI-ESM2.0, UKESM1.0-LL).
Discussion
The impact of heat stress on crop production has received increasing attention recently (El-Sappah et al., Reference El-Sappah, Rather, Wani, Elrys, Bilal, Huang, Dar, Elashtokhy, Soaud, Koul, Mir, Yan, Li, El-Tarabily and Abbas2022; Sun et al., Reference Sun, Wang, Ren, Zhao, Zhang, Ren and Liu2023). However, insufficient attention had been paid to the change of heat stress and the occurrence risk during historical crop growth, so could not take countermeasures against heat stress in advance (Gobin, Reference Gobin2012; Verma et al., Reference Verma, Kumar, Verma, Singh, Siddique and Singh2020). In this study, we used the daily maximum temperature ⩾30°C as the heat stress threshold during the PSP of summer maize (Schauberger, et al., Reference Schauberger, Archontoulis, Arneth, Balkovic, Ciais, Deryng, Elliott, Folberth, Khabarov, Müller, Pugh, Rolinski, Schaphoff, Schmid, Wang, Schlenker and Frieler2017), and taken DAY, HSI and HDD as the heat stress indices to explore the spatial and temporal trend of heat stress of maize. Based on HDD, the iCDF was used to construct the index of heat stress classification during the PSP, which is suitable for the summer maize planting areas in HHH Plain. Then, the hazard assessment of heat stress was carried out using information diffusion theory. Hazard assessment of heat stress can help us develop better adaptation measures to mitigate the negative impacts of climate warming on maize yield.
During the maize growing season, extreme climate events occur frequently (Zhang et al., Reference Zhang, Chen, Wang, Zhang, Tao and Liu2014; Zhang et al., Reference Zhang, Han and Yang2021a, Reference Zhang, Han and Yang2021b), though the frequency in different maize growth regions varied. So it was important to identify the major agrometeorological events in each region. Such information is critical to the local maize community to make proactive decisions to avoid disasters. In HHH Plain, we found that heat stress occurred in most areas over the past decades, and the hazard index ranging from 0 to 0.77 (Fig. 7a). Heat stress injury is usually caused by high temperatures and long duration (Orlov et al., Reference Orlov, Sillmann, Aunan, Kjellstrom and Aaheim2020; Schwingshackl et al., Reference Schwingshackl, Sillmann, Vicedo-Cabrera, Sandstad and Aunan2021). Therefore, due to the strong HSI and long heat stress days in Henan province, it was considered to be a high-hazard area, with a wide range of disasters, high frequency and severity, while Shandong province has the lowest hazard of heat stress. This may be related to the location of the sea and land. Hence, this indicates the importance of considering the different spatial distribution of climate impacts for agriculture (Guan et al., Reference Guan, Liu, He, Li, Mi and Qin2021).
Information diffusion, K-S tests, Weibull distribution and iCDF were selected to compute the heat stress grade index of summer maize and carry out hazard assessment in this study. In the previous study on disaster risk assessment, computations based on information diffusion theory have elucidated relative accuracy in risk estimation (Hao et al., Reference Hao, Zhang and Liu2012). This method uses small sample site data for hazard assessment, avoiding errors caused by limited sample data. The iCDF reflects the variety regulation of discrete samples of maize theoretically, and avoids the effects of subjective factors (Jena et al., Reference Jena, Chatterjee, Pradhan and Mishra2014). Such methods are more valid in the analysis of limited samples and choosing other existing approaches if sufficient date available, such as copula functions, bivariables and multivariate probabilistic estimates (Zhang et al., Reference Zhang, Yang, Guo, Huang and Huo2018a), for longer data series would benefit distribution fitting of variables. The use of the heat stress indices can serve as an effective methodology to assist in the risk of heat stress of maize (Yang et al., Reference Yang, Huo, Li, Wang and Wu2020; Ye et al., Reference Ye, Liu, Shen, Liu, Liu and Deng2022). Generally, the establishment of heat stress grade index and M results can partially help to adapt climate change in the agricultural system of study region.
There are many ways to reduce heat stress effects during the PSP of summer maize, breeding heat tolerant hybrids is the most economical and effective method. Heat tolerant which was achieved by a number of morpho-physiological, biochemical and molecular adjustments. At cellular level, high temperatures trigger the expression of certain genes and increase the accumulation of certain metabolites which may enhance the heat enduring ability of plants and thus heat tolerance (Hasanuzzaman et al., Reference Hasanuzzaman, Nahar, Alam, Roychowdhury and Fujita2013). So heat tolerant maize lines were able to remain relatively high grain yield under high temperature condition (Tiwari and Yadav, Reference Tiwari and Yadav2019; Dong et al., Reference Dong, Guan, Zhang, Liu, Li, Fu, Tang, Qi, Qiu, Jin, Huang and Yang2021). Plant hormones as efficient regulators can enhance plant stress resistance (Mitra et al., Reference Mitra, Kataki, Singh, Gaur, Razafindrabe, Kumar, Chatterjee and Gupta2021; Yan, Reference Yan2021); increased organic fertilization can slow down plant root senescence, increased potassium fertilization can increase the water content of plant leaves, and meteorological annual forecasts with reasonable fertilization are important for maize to resist heat stress (Li and Zheng, Reference Li and Zheng1996; Li et al., Reference Li, Wang, Li and Diao1999). At the same time, rational irrigation can reduce field temperature and enhance transpiration of plants (Yin et al., Reference Yin, Wang, Kong, Wang, Zhang, Chu, Wen and Chen2015); therefore, in field management, measures such as spraying exogenous hormones or regulating water and fertilizer can be taken to alleviate the inhibitory effect of heat stress on maize growth, so as to effectively reduce the adverse effects of heat stress. In addition, it is also necessary to strengthen the forecast and early warning of high temperature weather, improve the level of meteorological services for agriculture and guide farmers to take preventive measures in a timely manner. But, in fact, the heat stress grade of summer maize during the PSP is affected by the biological characteristics of the plant itself and environment, such as variety stress resistance, genotype cultivation measures and soil environment, and may vary in different regions (Wei et al., Reference Wei, Zeng, Luo, Wang, Meng and Wang2021; Zhang et al., Reference Zhang, Han and Yang2021a, Reference Zhang, Han and Yang2021b). With the variety replacement and climate change, it is necessary to further explore the heat stress threshold for the local hybrids.
Conclusions
The threshold of classification for mild, moderate and severe heat stress were 9.4, 19.4 and 34.2°Cd, respectively. At the regional scale, heat stress hazard index (M) was 0.48, ranged from 0 to 0.77 during 1981 to 2019. The highest values were in the western regions, but relative lower values were located in the eastern regions. In the future climate change scenarios, M will be increased. Under SSP5–8.5, M ranged from 0.95 to 1.20 during the 2080s, about two times than historical period.
Financial support
This work was supported by the Ministry of Science and Technology of China (2022ZD0119503), and the 2115 Talent Development Program of China Agricultural University.
Authors’ contributions
Zhijuan Liu, Zhenzhen Fu designed research; Zhenzhen Fu, Shibo Guo, Zhentao Zhang, Xiaomeng Lu, Jingjin Gong and Meiqi Dong performed research and analysed the data; and Zhenzhen Fu, Zhijuan Liu, Xiaoguang Yang wrote the paper.
Conflict of interest
The authors declare no conflicts of interest exist.
Ethical standards
Not applicable.