


Introduction
Many factors, such as natural resources and the development of assisted reproductive technology, nutrition and animal health programmes, may affect the beef cattle supply chain. Although the animal supply flow is important for the entire chain, it may be most relevant to farmers (Rezitis and Stavropoulos, Reference Rezitis and Stavropoulos2010). Evaluation of the number of animals to be slaughtered is required to adjust cash flow, as it is important for the industry to allocate shipping space, plan the scale of slaughter, adjust the number of employees, estimate retail delivery volumes and define the strategy of animal purchase prices. Farmers systematically integrate the production system with their suppliers to improve competitiveness. However, climate change affects the beef cattle production capacity across different systems and regions (Berry et al., Reference Berry, Rounsevell, Harrison and Audsley2006; Lobell et al., Reference Lobell, Schlenker and Costa-Roberts2011).
The supply of most agricultural products is affected by their price in response to climate variables. Ubilava (Reference Ubilava2012) observed that the occurrence of climate phenomena such as El Niño (EN) and La Niña (LN) affected coffee prices in the international market. Similarly, according to reports, these two climatic phenomena decreased annual rice productivity worldwide and have had a direct impact on crop yields in different countries over the years (Chen and McCarl, Reference Chen and McCarl2000; Chen et al., Reference Chen, McCarl and Chang2008).
Livestock growth in different pasture production systems is influenced by climate. Thus, unfavourable climatic conditions can decrease the vegetative growth of plants, which will affect the animal production efficiency. According to IBGE (2015), in the state of Rio Grande do Sul, Southern Brazil, cattle supply for slaughter seems to be more sensitive to climatic phenomena compared with other regions of Brazil. In the state of Rio Grande do Sul, slaughter decreased by 32 and 12.5% during LN periods in 1998–01 and 2006–07, respectively, while the rest of Brazil increased cattle slaughter by 9 and 12% during the same period (IBGE, 2015). The Rio Grande do Sul is the fifth largest Brazilian beef producer, and the predominant production system uses British beef cattle breeds and their crosses, which graze natural pasture in the region. The State has a herd of about 14 million cattle, and 0.73 of them are concentrated in the Pampa Biome region (Fig. 1) that comprises 1 78 243 km2, corresponding to 0.63 of the state territory (Hasenack and Cordeiro, Reference Hasenack and Cordeiro2006; BRASIL, 2014). The main feature of the Pampa Biome is the predominance of natural pastures, covering about 6.5 million hectares (Hasenack and Cordeiro, Reference Hasenack and Cordeiro2006), which are the main source of food for cattle in this region.
Fig. 1. Geographical limits of the Pampa Biome in the State of Rio Grande do Sul, Southern Brazil.
Therefore, climate phenomena are a risk factor for the production systems and play a role in modulating the seasonal vegetation cycle; they may thus compromise the local beef supply. However, climatic events are not usually the first factor to be evaluated when analysing the behaviour of beef products in global markets. According to the microeconomic theory, the change in a product supply is determined by its production cost, the industry's expectation of demand and the variation in product prices. The latter quantifies the degree of response of the production sector to the price dynamics.
Hence, the current study assesses environmental and economic scenarios to enhance beef cattle production strategies aiming at effective sustainable practices and reducing production risks. Therefore, the purpose of this research was to evaluate how climate phenomena affect the supply of beef cattle for slaughter in Southern Brazil, and how environmental issues affect the price of live beef cattle and its share in the global market.
Materials and methods
Data were collected regarding the beef supply chain in the state of Rio Grande do Sul from January 1997 to March 2014, and classified as the number of cattle slaughtered monthly, prices in futures markets, amount and value of exports and the price of beef cattle paid to farmers in the State (CEPEA, 2014; IBGE, 2015; MDIC, 2015). Cattle prices were obtained in Brazilian currency (Reais; R$) and transformed into US currency (US Dollars; US$) updated to the March 2014 dollar exchange rate (as found on BACEN, http://www4.bcb.gov.br/pec/conversao/conversao.asp). According to MDIC (2015), the exports, imports and movement of live cattle to and from Rio Grande do Sul were insignificant, corresponding to <0.01 of State consumption, and for that reason, this variable was not considered.
Data were collected regarding climate phenomena such as El Niño, La Niña and Multivariate El Niño Southern Oscillation Index (MEI) (CPTEC-INPE, 2014a, b; NOAA, 2014a). In addition, data were obtained about the Tropical South Atlantic (TSA) and Tropical North Atlantic (TNA) indices, and the Positive and Negative Atlantic Dipole climate phenomenon (NOAA, 2014b; Table 1). All data were processed in a LibreOffice spreadsheet and then exported to the statistical software Gnu Regression, Econometrics and Time Series Library (http://gretl.sourceforge.net/). The MEI considers variables such as sea surface temperature (SST), intensity and direction of winds, the pressure at sea level and fraction of sky covered by clouds. These indices are those that best represent the climate phenomena of the equatorial Pacific (Wolter and Timlin, Reference Wolter and Timlin2011), classified as EN and LN, which affect vegetative growth in different regions of the planet. Wolter (Reference Wolter1987) determined that MEI >0.4 is considered EN, LN <−0.4 and neutral between −0.4 and 0.4.
Table 1. Occurrence of climate anomalies during spring and summer seasons from 1997 to 2014 in the State of Rio Grande do Sul
NDVI, Normalized Difference Vegetation Index; EN, El Niño; LN, La Niña; +AD, positive Atlantic Dipole; −AD, negative Atlantic Dipole; TNA, Tropical North Atlantic; TSA, Tropical South Atlantic.
Data source: Marques et al. (Reference Marques, Fontana and Mello2005), NOAA (2014a), NOAA (2014b).
To evaluate the relationship between climate phenomena and cattle slaughter, a binary variable was created for the occurrence of EN (presence = 1, absence = 0) and LN (presence = 1, absence = 0). These variables were multiplied by the variable MEI when <−0.4 (LN) and >0.4 (EN) (Wolter, Reference Wolter1987), and causing the MEI–EN, MEI–LN variables to identify MEI values only in the periods when climate phenomena occurred.
The +AD variable occurs when the SST of TNA is higher than the historical average and that of TSA is below the historical average. The opposite is true for –AD. The resulting binary variable considered +AD (presence = 1, absence = 0) and –AD (presence = 1, absence = 0). The South Atlantic Sub-tropical Dipole Index (SASD) was also included in the analysis and it was obtained by subtracting SST of TSA from TNA for September to March (spring–summer in the southern hemisphere) when there is greater forage production (Wainer et al., Reference Wainer, Prado, Khodri and Otto-Bliesner2014).
The effect of climatic phenomena on beef cattle slaughter in the most sensitive period of climate oscillations during spring and summer was also evaluated. A dummy variable called Equinox (EQ) was used and classified as 1 (one) for the spring–summer period (September–March) or as 0 (zero) for the autumn–winter period (April–August). To isolate the months that were not relevant, the variable called Equinox was multiplied by MEI–EN, MEI-LN, +AD, −AD and SASD data originating from the EQEN, EQLN, EQ +AD, EQ –AD, and EQSASD variables. These additional data during the equinox time concern the effects of EL, LN, +AD, −AD and SASD, respectively.
Estimation of the influence of climate variables in the supply of cattle for slaughter was carried out by time series regression Cochrane-Orcutt with log-linear input using the number of cattle slaughtered as a dependent variable and EQEN variables, EQLN, EQ +AD, EQ –AD, EQSASD as the independent variable Eqn (1):
 $$\eqalign{& {\rm SS} = {\bi \alpha} + {\rm EQEN} + {\rm EQLN} + {\rm EQ} + {\rm AD} \cr & \qquad + {\rm EQ} {\rm -} {\rm AD} + {\rm EQSASD} + {\bi \varepsilon} \;} $$
where SS is the number of slaughtered cattle, EQEN and EQLN are the MEI values for the months from September to March for periods EN and LN, respectively; EQ +AD and EQ –AD are considered the dummy variables for the months from September to March when there are the +AD and –AD, respectively; EQSASD are the values of SASD from September to March and ε is the error of the model.
The lags for model variables were defined by the Forward-Backward method, testing 0–6 lags for each variable. The Forward method begins with no variable in the model and adds a variable at each step and the backward method does the opposite. All variables were included initially and then each was deleted or maintained in a stepwise manner. The variable withdrawal decision is taken based on partial F tests, which are calculated for each variable as if it were the last to enter the model. According to Gujarati and Porter (Reference Gujarati and Porter2011), lag is the time interval between the variation of the explanatory variables (X) and the response or change in the dependent variable (Y). In the current study, the lag concept was used to evaluate the onset of the increase or decrease of cattle slaughter after the beginning of the equinox with or without climate phenomena.
In addition, the number of cattle slaughtered in the Rio Grande do Sul was determined according to the live cattle prices paid (PP) to farmers in the Rio Grande do Sul, the exported beef price (EBP) and the indicator for The Brazilian Mercantile and Futures Exchange (BMF; Bolsa de Mercadorias & Futuros, São Paulo) Eqn (2):
 $${\rm SS} = {\bi \alpha} + {\rm PP} + {\rm EBP} + {\rm BMF} + {\bi \varepsilon} \; $$
The PP to farmers in Rio Grande do Sul was analysed according to the number of slaughtered cattle (SS), the EBP and the indicator for the futures market (BMF) Eqn (3):
 $${\rm PP} = {\bi \alpha} + {\rm SS} + {\rm EBP} + {\rm BMF} + {\bi \varepsilon} \; $$
The influence of the EBP and the number of cattle slaughtered (SS) compared with export volumes (EB) was analysed Eqn (4):
 $${\rm EB} = {\bi \alpha} + {\rm SS} + {\rm EBP} + {\bi \varepsilon} $$
The Vector Autoregression Model was used to estimate Eqns (2), (3) and (4); however, for the last model of consistency, if the analysis indicated heteroskedasticity, then it was changed to use the Generalized Autoregressive Conditional Heteroskedastic estimator. Lag equations were defined by selecting the Vector Autoregression Model available in GRETL software. A different combination of lags was defined by the Akaike criterion, where the lowest value had the best-adjusted model.
The variable price of live beef cattle paid to the farmers for slaughtered cattle in Rio Grande do Sul was subjected to a means test using the factor variables that determined the climate phenomenon or periods without phenomena. The factor variables were set to spring–summer on (EQOVERALL), EQEN, EQLN, spring–summer with −AD (EQ –AD), EQLN with –AD (EQLN –AD) and spring–summer without phenomena (EQNOEVENT). For this, the mean Scheffé test (P > 0.01), available in SPSS Statistics 13.0 software was used.
Results
In the current research, it was not possible to confirm that EN increases the cattle supply in relation to overall years or periods without the occurrence of a climate anomaly (Table 2). Moreover, in the regression analysis, indicated by adjusting R 2, the climate phenomena account for 0.79 of the number of animals slaughtered in the spring and summer in the Rio Grande do Sul state, which showed that the beef cattle industry is greatly dependent on climate phenomena.
Table 2. Effective supplies of cattle for slaughter in southern Brazil, from September to April of the years 1997–2014
EQ, Equinox; ELEN, El Niño; LN, La Niña; +AD, positive Atlantic Dipole; −AD, negative Atlantic Dipole; LN −AD, La Niña associated with Negative Atlantic Dipole; SD, standard deviation; CV, coefficient of variation.
There was a 1-month lag in the increase of animals for slaughter from the beginning of spring, starting in October with 5 ± 2.4 percentage point variation (Table 3). There was also no positive influence of the Atlantic Dipole on the cattle supply for slaughter, while the –AD and SASD indices showed negative and positive variations, respectively (Table 3).
Table 3. Climate anomalies and their degree of lags in relation to the supply of cattle for slaughter in the Rio Grande do Sul
EQEN, Equinox El Niño; EQLN, Equinox La Niña; EQSASD, Equinox South Atlantic Subtropical Dipole; EQ −AD, Equinox Negative Atlantic Dipole.
Numbers in parentheses are the standard error.
a Constant in nominal value (US$).
It was observed that beef cattle PP to farmers increased supply by 2.8% and beef exported increased it by 1%, with a 2- and 1-month lag, respectively (Table 4). On the other hand, the cattle supply for slaughter was more affected by the PP to farmers in the Rio Grande do Sul State. In contrast, the prices of exported beef and beef commercialized in the futures market have no influence on the price of live cattle but the range for supply had an influence of around −15%, with a 1-month lag (Table 5).
Table 4. Significance of beef cattle prices paid to producers, exported beef prices and The Brazilian Mercantile and Futures Exchange on the supply of cattle for slaughter in the Rio Grande do Sul
PP, prices paid to producers; EBP, exported beef prices; BMF, the Brazilian Mercantile and Futures Exchange.
Numbers in parentheses are the standard error.
a Constant in nominal value (US$).
Table 5. Significance of beef cattle supply variables for slaughter, exported beef prices and The Brazilian Mercantile and Futures Exchange on the supply of cattle for slaughter in the Rio Grande do Sul
SS, supply for slaughter; EBP, exported beef prices; BMF, the Brazilian Mercantile and Futures Exchange.
Numbers in parentheses are the standard error.
a Constant in nominal value (US$).
It was also observed that beef exported by the Rio Grande do Sul is more sensitive to variations in the number of beef cattle slaughtered than to the price of beef exported, 32 and 2.2%, respectively (Table 6). In the current study, no differences were observed in cattle supply for slaughter in relation to EN (Table 3); however, the PP to producers were lower. In addition, it was observed that in −AD, whether associated with LN or not, prices were higher than the overall average throughout years (Table 7).
Table 6. Beef cattle supply (tons) variables for slaughter (SS) and exported beef prices (EBP) regarding beef exports by the Rio Grande do Sul State
SS, supply for slaughter; EBP, exported beef prices.
Numbers in parentheses are the standard error.
a Constant in nominal value (US$).
Table 7. Mean (μ) price and revenue in the periods of occurrence of weather anomalies
EQN, Equinox; EN, El Niño; LN, La Niña; +AD, positive Atlantic Dipole; −AD, negative Atlantic Dipole; LN−AD, La Niña associated with negative Atlantic Dipole; SD, standard deviation; CV, coefficient of variation.
Discussion
An association between climate phenomena and cattle supply was observed in the current study: supply is lower in LN years and −AD. The years with LN and −AD climate phenomena had less variation with a decrease in the cattle supply compared with dry years during EN, +AD or without climate phenomena. In general, the results indicated that climate phenomena account for the variation in numbers of animals slaughtered in spring and summer in the Rio Grande do Sul, which showed the great dependence of the beef cattle industry on climate.
Climate phenomena in the Brazilian Pampa also affected the vegetation index that influences pasture conditions, the predominant ecosystem in this biome (Marques et al., Reference Marques, Fontana and Mello2005; Grigera et al., Reference Grigera, Oesterheld and Pacín2007; Wagner, Reference Wagner2013). The Pampa Biome is composed predominantly of C4-type natural pastures that grow mainly from September to March (Overbeck et al., Reference Overbeck, Müller, Fidelis, Pfadenhauer, Pillar, Blanco, Boldrini, Both and Forneck2007) when the amount of cattle slaughtered is higher. However, even during these seasons, a marked variation in the number of animals sent to slaughter was observed over the years, which may be associated with the effects of climate variations on forage supply in the region (IBGE, 2015). The variability in a number of animals sent for slaughter seems to be associated with climate phenomena such as EN, LN and –AD (Marques et al., Reference Marques, Fontana and Mello2005; Wagner, Reference Wagner2013; CPTEC-INPE, 2014a, b) because bovines in the Rio Grande do Sul feed mainly on natural pastures.
Berlato and Fontana (Reference Berlato and Fontana2003) observed that 80% of the variation in soybean and maize production in the Rio Grande do Sul was also associated with climatic variations, such as precipitation and temperature. This observation emphasizes the importance of using technologies that can minimize production risks associated with the weather, such as irrigation systems, selection of varieties more resistant to water stress, feed storage and strategies for feeding the animals.
In the autumn/winter period in the Rio Grande do Sul, there is a natural drop in the supply of native forage and, therefore, in the cattle slaughter rate, both showing lower variability in observations when compared with the spring and summer seasons (Marques et al., Reference Marques, Fontana and Mello2005). Similarly, climate phenomena had a less significant impact on the variation of Normalized Difference Vegetation Index (NDVI) in the autumn and winter months in the Rio Grande do Sul (Wagner, Reference Wagner2013), explaining the exclusion of the colder seasons from the current study. It was observed that in EN years, when rainfall tends to be higher than average (Wagner, Reference Wagner2013), the increase of animals for slaughter presented a lag of 1 month from the beginning of spring.
In EN years, a greater supply of cattle for slaughter was observed beginning in October compared with the years when this anomaly does not occur. In EN years, winters are milder and rainy, with a considerable expansion of cropland planted and greater production of native forage (Wagner, Reference Wagner2013); consequently, beef cattle fattening increased and started earlier. This variation of supply was smaller when compared with other phenomena, which may be explained historically by the highest rainfall occurring in September, independent of the impact of EN Perhaps this explains why the standard error variation was more pronounced in this case (Wagner, Reference Wagner2013).
The increase of beef cattle supply observed in the regression model is contrary to the average observed when EN had no difference in productivity periods without an event or the overall average for the series. However, this does not invalidate the means test, which is recommended especially for qualitative factors and is also a suitable indicator to compare climatic events (Bertoldo et al., Reference Bertoldo, Coimbra, Guidolin, Mantovani and do Vale2008). On the other hand, the highest beef prices and lowest cattle supply were observed in LN and –AD years, as expected according to the microeconomics theory (Fig. 2). Wagner (Reference Wagner2013) also observed that during LN periods, rainfall decreases in December and January, lowering the vegetation index in January (Wagner, Reference Wagner2013). The coefficient of variation indicates that variability of the effects of LN associated with –AD is lower compared with EN or no event. This agrees with Wagner (Reference Wagner2013), who noted that the effects of decreased NDVI according to EN are less predictable than periods of LN.
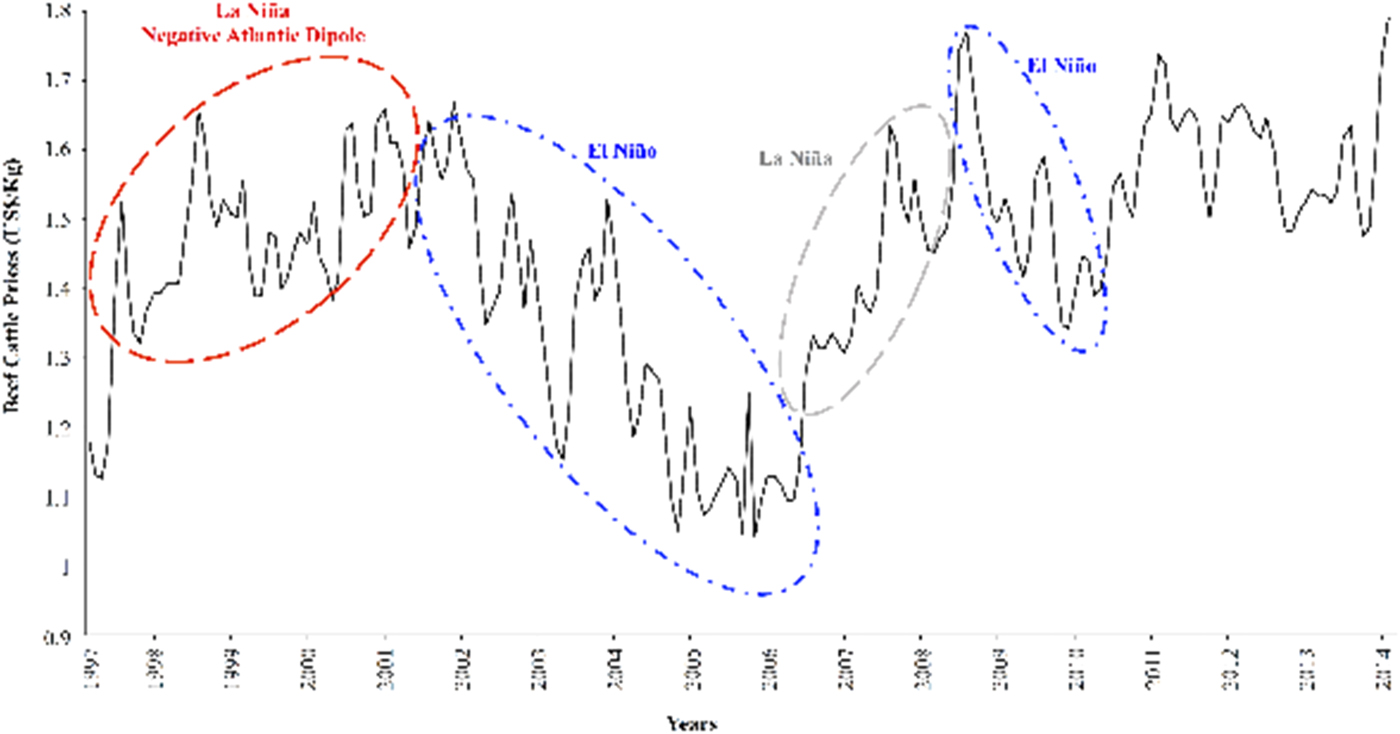
Fig. 2. Price of live cattle paid to farmers in the State of Rio Grande do Sul, Southern Brazil and its relation to climate phenomena.
The production of native forage was evaluated using NDVI (Baldi and Paruelo, Reference Baldi and Paruelo2008; Wagner, Reference Wagner2013), an indicator of green biomass activity that can map and measure the photosynthetic capacity of plants and vegetative coverage, which means measuring vegetative growth of the plant (Schultz and Halpert, Reference Schultz and Halpert1993; Weier and Herring, Reference Weier and Herring2015). It was observed in the Pampa Biome that, during spring and summer, NDVI changes according to climate variations, such as environmental precipitation and temperature. These conditions may be associated with climate phenomena such as EN, LN and –AD (Marques et al., Reference Marques, Fontana and Mello2005; Wagner, Reference Wagner2013; CPTEC-INPE, 2014a, b).
The reports found in scientific databases suggest the importance of the Atlantic Dipole phases in South America focusing on the effects on the north and north-east of Brazil (Chang et al., Reference Chang, Ji and Li1997; Ferreira and da Silva Mello, Reference Ferreira and Mello2005; Taschetto and Wainer, Reference Taschetto and Wainer2008), but there are few publications regarding the effects of rainy precipitation and NDVI in the Rio Grande do Sul (Kayano et al., Reference Kayano, Andreoli and de Souza2011; Reference Kayano, Andreoli and de Souza2013; Bombardi et al., Reference Bombardi, Carvalho, Jones and Reboita2014). According to Wainer et al. (Reference Wainer, Prado, Khodri and Otto-Bliesner2014), the South Atlantic anomaly influences rainfall in South America significantly.
However, Marques et al. (Reference Marques, Fontana and Mello2005) observed that changes in the Atlantic Ocean Sub-tropical SST affect rainfall regimes and are correlated to NDVI in beef cattle production regions in the Rio Grande do Sul, particularly, from July to December. Marques et al. (Reference Marques, Fontana and Mello2005) also identified a positive correlation between SST on TSA in July and August compared with NDVI in September and October, as well as the negative correlation between SST and TSA in September compared with NDVI in November. This supports the findings of the current study, which indicates that SASD has a direct relationship with SST and TSA (Marques et al., Reference Marques, Fontana and Mello2005).
The beef cattle production cycle is the main factor that could possibly justify the beef prices and live cattle exports. Perhaps it is unusual for the Rio Grande do Sul to import live cattle to increase the herd in the State. Indeed, the State needs to retain females to increase the population but will require several months or even years after the adoption of this strategy to achieve higher numbers of animals ready to be slaughtered. Thus, one can consider the supply price elasticity of this activity in the state as inelastic or less sensitive to price changes. Indeed, the variations in the number of slaughtered animals must be associated with other factors such as land use for other agricultural activities and, especially, the availability of forage according to climate changes.
The low influence of variation in the price of beef exported and in the future market PP to cattle farmers suggests that prices in the Rio Grande do Sul were not sensitive to the international market or the reference live beef price in the centre of Brazil. Furthermore, data from the Ministry of Industry and Trade indicated that <0.07 of the Rio Grande do Sul beef is exported, and most of this is low value-added industrialized product (MDIC, 2015), which may be sufficient to justify the low influence of the EBP compared with local prices and export volumes. The live cattle prices variation is not significant due to the systematic beef imports to meet the state's demand, which is explained by the prevalence of business in the local market (MDIC, 2015).
Observations concerning cattle supply for slaughter in the Rio Grande do Sul support the idea that it is more influenced by changes in the beef supply chain, such as the availability of natural pastures, than by economic variables, e.g. prices of amounts exported, the price paid for live cattle to producers and the stock market index. In fact, major climate events that affect the supply of beef cattle, such as climate phenomena, are essential to understand the dynamics of this market in the state.
It was also observed that even at higher prices −AD events and LN associated with the −AD showed a total revenue less than the overall average and the periods without events, mainly due to the lower supply of animals observed in these periods. Similarly, the drop in the price paid to farmers in EN events led to a smaller turnover than in the neutral periods and even than in LN events. This showed that even with the reduction of the risk of crop failure, the farmer is still exposed to market risks.
Although EN occurrences can cause natural disasters such as the major floods of 1997 and 1998 in the Rio Grande do Sul (Zero Hora, 2015), they can support a number of farmers in the state whose revenue is increased because of the greater availability of water for summer crops (Fürstenau, Reference Fürstenau1998). On the other hand, the LN effect causes droughts and crop failure in the Rio Grande do Sul, as in 2008 when the soybean and maize crops were compromised, especially in regions along the Pampa Biome (Zero Hora, 2008). As the sale of cattle for slaughter is about 1/3 of the total turnover of Rio Grande do Sul farming and around 0.11 of the gross domestic product (GDP) agribusiness of this state (FEE, 2015), it is essential to use information on climate phenomena to adjust management strategies for this sector of the economy.
Climate phenomena have become more frequent and intense in recent years because of climate change associated with increasing greenhouse gas phenomena (Cai et al., Reference Cai, Borlace, Lengaigne, van Rensch, Collins, Vecchi, Timmermann, Santoso, McPhaden, Wu, England, Wang, Guilyardi and Jin2014; Reference Cai, Wang, Santoso, McPhaden, Wu, Jin, Timmermann, Collins, Vecchi, Lengaigne, England, Dommenget, Takahashi and Guilyardi2015; Wainer et al., Reference Wainer, Prado, Khodri and Otto-Bliesner2014). In addition, Nardone et al. (Reference Nardone, Ronchi, Lacetera, Ranieri and Bernabucci2010) reported that the grazing and mixed rain-fed systems, which depend on the availability of pastures and farm crops, would be most damaged by climate change. The findings are relevant to the agents of the beef cattle supply chain to provide strong information to evaluate the economic impact of weather changes on food production that will lead to an increase in animal demand by farmers and by the industrial sector.
Hence, the data indicate an important empirical assessment to understand the climate discrepancies in beef cattle production that may enhance additional strategies to mitigate the price of the beef supply chain. Moreover, this research confirmed that, in general, climate phenomena generate different effects on the cattle supply for slaughter, on the PP to farmers and on the financial turnover of this supply chain in the state of Rio Grande do Sul, southern Brazil, showing the economic importance of these climate phenomena (Fig. 3).
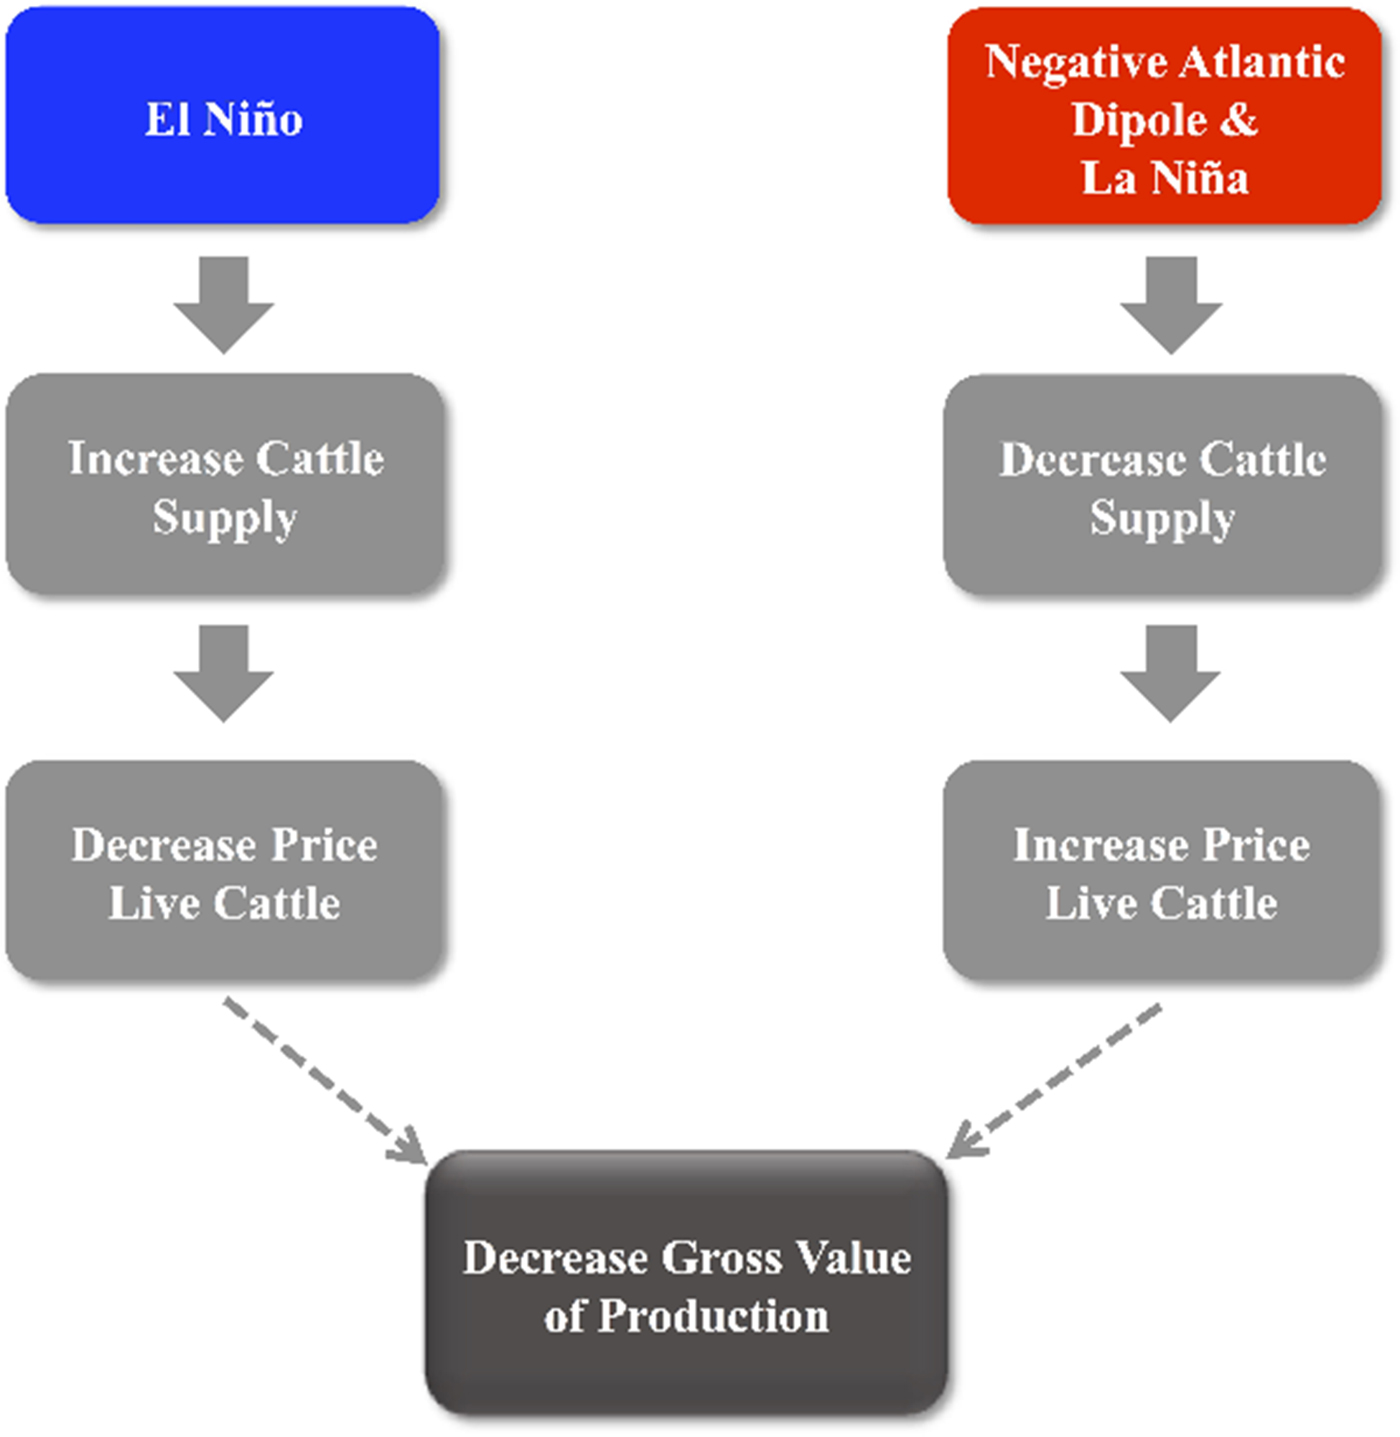
Fig. 3. Relationship of climate phenomena and supply, price and gross value of cattle production in the Rio Grande do Sul, Southern Brazil.
Conclusion
The beef cattle market in the Rio Grande do Sul appears to be more influenced by the occurrence of climate phenomena with LN and −AD than by economic variables such as the beef price paid to the producer and the exported amounts of beef.
Beef cattle were shown to be dependent on external factors, such as weather, increasing the need to adopt new technologies to increase the beef cattle production efficiency. Moreover, in an extensive grazing system of beef cattle in the Rio Grande do Sul, the adoption of new technologies such as pasture irrigation, haymaking, silage and feed lotting, in LN and –AD times, could be an effective strategy to contribute to the economic sustainability of beef farming in Southern Brazil.
Financial support
This study was supported by the Brazilian Council of Scientific and Technological Development (Project CNPq/Universal No. 456724/2014-1) and the Coordination for the Improvement of Higher Education Personnel/CAPES, Brazil (Project CAPES/PNPD).
Conflicts of interest
The authors declare that there is no conflict of interest that could be perceived as affecting the impartiality of the research reported.
Ethical standards
Not applicable.


