


1. Background and Objectives
In 2016, Tennessee had $537 million in cash receipts from cattle and calves accounting for 16% of the state's agricultural cash receipts that year (U.S. Department of Agriculture, Economic Research Service [USDA-ERS], 2017). The state ranked 25th in the United States in cash receipts from cattle and calves; this represents just under 1% of the national cash receipts from cattle and calves (USDA-ERS, 2017). As of January 1, 2016, there were a total of 896,000 head of beef cows that had calved in Tennessee. This is about 3% of the U.S. inventory with a ranking of 12th in the nation (USDA, National Agricultural Statistics Service [NASS], 2017a). However, 2016 commercial cattle slaughter only totaled 64,900 head for Tennessee, which is less than 0.2% of the U.S. total. The live weight was 59 million pounds, which is 0.14% of the U.S. total slaughter of 42 billion pounds (USDA-NASS, 2017b). Thus, more than 90% of cattle originating in Tennessee are harvested out of state (USDA-NASS, 2017a, 2017b). As evidenced by the aforementioned statistics, although beef cattle are an important contributor to the state's cash receipts, most Tennessee beef operations are cow-calf operations and do not finish cattle.
Traditional marketing methods for cow-calf operators include weaning, preconditioning, and backgrounding calves prior to marketing them as feeder cattle to feedlots; custom feeding them through a retained ownership agreement in out-of-state facilities such as those in the Midwest or Great Plains; or finishing on farm and marketing them as local beef. Many Tennessee cow-calf producers market calves weighing less than 600 pounds to backgrounding operations in either Tennessee or to operations outside the state. Calves remaining in Tennessee to be backgrounded are then marketed to a feedlot outside of the state or custom fed outside of the state through a retained ownership agreement. Although these traditional marketing methods offer producers several options to market their cattle, alternative marketing methods in Tennessee are gaining popularity because of growing preferences for local beef as a part of the larger local foods movement. For example, Dobbs et al. (Reference Dobbs, Jensen, Leffew, English, Lambert and Clark2016) found that Tennessee metropolitan consumers were willing to pay premiums for locally produced beef. Merritt et al. (Reference Merritt, DeLong, Griffith and Jensen2017) also found that Tennessee consumers were willing to pay more for Tennessee Certified Beef (TCB) steak and ground beef using an online choice experiment.
In response to consumers desiring locally produced beef, beef cattle industries in several states have adopted branding programs. For example, Iowa-80 Beef (Babcock et al., Reference Babcock, Hayes, Lawrence and Clemens2007), and South Dakota Certified (McLaughlin, Reference McLaughlin2013) are programs designed to differentiate beef products based on geography. The Iowa-80 Beef pilot program specified that each animal is source verified to the farm of birth using an identification system with a unique number that identifies the animal throughout the production process (Babcock et al., Reference Babcock, Hayes, Lawrence and Clemens2007). The Iowa-80 Beef program also specified that each animal is fed in an Iowa feedlot for a minimum of 180 days and is to be sired by a 100% Angus bull. However, state branding programs have encountered difficulties arising from insufficient volumes of cattle to meet needs of larger packers coupled with the lack of federally inspected small- to medium-size packing facilities, which would be best suited to handle the segregated cattle and beef products of such programs (Babcock and Clemens, Reference Babcock and Clemens2005).Footnote 1 As an example, South Dakota Certified beef has grown slowly because of lack of a sufficiently large meat packing plant; hence, most of the meat sold through the program has come from small custom meat plants (McLaughlin, Reference McLaughlin2013).
A total of 13 federally inspected livestock slaughter facilities in Tennessee are listed as possibilities for producers who desire to have livestock slaughtered and processed under USDA inspection (Pepper, Leffew, and Holland, Reference Pepper, Leffew and Holland2016). Dalton, Holland, and Hubbs (Reference Dalton, Holland and Hubbs2007) conducted a study of USDA-inspected livestock slaughter facilities in Tennessee, with 90% of these facilities slaughtering cattle. All slaughter facilities in the Pepper, Leffew, and Holland (Reference Pepper, Leffew and Holland2016) study that were inspected for slaughtering were also inspected for processing. Furthermore, they found that these facilities were all operating well under capacity, with beef cattle slaughter averaging 886 head per plant while capacity was 3,121 head per plant.
Although cattle producers have a potential opportunity to capture more of the value-added process by supplying to these emerging markets, finishing cattle adds to production costs meaning a producer would need to receive a high enough premium to make the finishing process profitable.Footnote 2 A potential means to gain premiums is through a state-labeling program. For example, Merritt et al. (Reference Merritt, DeLong, Griffith and Jensen2017) found that consumers would pay 32% more for TCB steak and nearly 44% more for TCB ground beef when consumers were informed that TCB indicates that the animal was born, raised, and harvested in Tennessee and graded USDA Choice or Prime. However, producer participation in such a program might be influenced not only by premium levels, but also the producer's ability to finish cattle and deliver them to slaughter facilities given their resources, desire to participate in a program, willingness to participate in a new market channel, and other factors. Therefore, the objectives of this study are to measure Tennessee cattle producers’ willingness to participate in a program certifying beef as produced in Tennessee and ascertain the factors influencing the amount of beef they would supply to such a program, including premiums, producer demographics, farm characteristics, and attitudes.
2. Literature Review
Producer participation in state-branded programs has been examined in prior research (e.g., Babcock et al., Reference Babcock, Hayes, Lawrence and Clemens2007; Govindasamy et al., Reference Govindasamy, Pingali, Italia and Thatch1998; Velandia et al., Reference Velandia, Clark, Lambert, Davis, Jensen, Wszelaki and Wilcox2014) as has producer adoption of retained ownership contracts (e.g., Franken et al., Reference Franken, Parcell, Patterson, Smith and Poock2010; Pope et al., Reference Pope, Shroeder, Langemeier and Herbel2011). Govindasamy et al. (Reference Govindasamy, Pingali, Italia and Thatch1998) examined New Jersey producers’ participation in the Jersey Fresh Program. Their survey results suggested growers with large farmlands and those who were primarily retailers or wholesalers were less likely to be enrolled in the program. They also found that producers who believed consumers were aware of the program were more likely to be registered in the Jersey Fresh Quality Grading Program. Among the most cited reasons for not participating in the program were not wanting their produce to be inspected, not knowing about the program, and believing the grading logo was not effective in obtaining premium prices. Results from these studies suggest that producers with larger farms and who believe in the program's effectiveness are more likely to participate.
Velandia et al. (Reference Velandia, Clark, Lambert, Davis, Jensen, Wszelaki and Wilcox2014) surveyed Tennessee fruit and vegetable producers regarding their awareness of state programs to promote locally grown foods. Pick Tennessee Products is a state-sponsored program that promotes products produced in Tennessee. They found that younger age, having greater than some high school education, lower percent of income from farming, and attending extension educational events increased the likelihood that a producer was aware of Pick Tennessee Products. Velandia et al. (Reference Velandia, Clark, Lambert, Davis, Jensen, Wszelaki and Wilcox2014) found that among fruit and vegetable growers, higher education, lower percentage of household income derived from farming, higher percent of products sold as fresh, and attendance at university/extension educational events increased the likelihood that the producer would participate in the Pick Tennessee Products program. Producers participating in the program viewed increased sales as the primary benefit from the program. Hence, results from Velandia et al.’s study suggest that higher education, attendance at university/extension educational events, and lower percentage of household income derived from farming had positive influences on participation in the Pick Tennessee Products program.
Pope et al. (Reference Pope, Shroeder, Langemeier and Herbel2011) suggested a producers’ risk aversion affected whether or not they would use retained ownership. Using an ordered probit model, participants were asked to choose from five ordinal choices (1 = never, 2 = seldom, 3 = sometimes, 4 = often, and 5 = always) to describe how they market a calf after weaning with choices of 1 = sell steers at weaning; 2 = background steers, then sell them; or 3 = retain steers through finishing. It was found that the probability that a producer would sell a calf immediately after weaning decreased as risk tolerance increased. Producers who were the most risk averse had about a 60% probability they would often or always sell calves after weaning as opposed to the most risk-tolerant, which only had a 15% probability they would sell calves at weaning. It was also shown that the share of gross farm income was significantly related to retaining ownership.
Franken et al. (Reference Franken, Parcell, Patterson, Smith and Poock2010) used structural equation modeling to trace the path effects of producer characteristics on interest in and actual use of retained ownership. They found cattle quality, as measured by ownership of registered cattle, led to a significant increase in interest in retained ownership. Additionally, a producer's interest in performance-based management, as measured by interest in feedlot and carcass data, was significantly associated with interest in retained ownership.
Babcock et al. (Reference Babcock, Hayes, Lawrence and Clemens2007) created a pilot program to market high-quality beef using a certification mark and the USDA's Process Verified Program to create a geographical indicator for Iowa-80 Beef. The authors hypothesized that a program to differentiate and market very high-quality beef produced in Iowa would allow producers to take greater advantage of price premiums. They concluded that stringent or unique production and/or processing criteria are needed to differentiate beef and other high-value agricultural products.
3. Data and Methods
3.1. Data Collection and Survey
Data for this study were obtained through an online survey of beef cattle producers who participated in the Tennessee Agricultural Enhancement Program (TAEP). The producers in this program are located across the state, with a total of 5,500 beef cattle producers in the sample. An initial pretest was e-mailed to 25 producers in June 2016. In July, a second pretest was e-mailed to 250 producers. Based on pretest results, revisions were made to the survey before distributing the full survey. The pretest participants’ responses were not included in the final survey, nor did they participate in the final survey. In August 2016, the survey link was then e-mailed to the TAEP beef cattle producers who were not included in the pretest. A follow-up reminder e-mail was sent a week after the initial e-mail, and a second reminder e-mail was sent 2 to 3 weeks afterward. All surveys were collected by mid-September 2016. Both the pretests and full surveys were distributed and responses collected through Qualtrics. A copy of the survey, which had full institutional review board approval, is available from the authors upon request. The survey required participants to be primary decision makers of the farm operation and to have produced cattle recently.
The survey began with participants being asked how many head of cattle they managed and marketed in the following activities in 2015: producing calves for immediate sale at weaning, preconditioning (for less than 90 days), backgrounding (for more than 90 days), retaining ownership in a custom feedlot, and finishing cattle. Next, participants were provided information about a hypothetical Tennessee Branded Beef Program (TBBP) that included the benefits and requirements of the program. Participants were asked if they would be willing to participate in a TBBP if profitable given the list of hypothetical requirements (Figure 1). The question was worded as follows: “If profitable, given the requirements listed above, would you be willing to participate in the Tennessee Branded Beef Program?” Responses to this question formed the variable (Participate).

Figure 1. Description of the Hypothetical Tennessee Branded Beef Program
Respondents who answered yes to the willingness-to-participate question were then offered a hypothetical premium level above the standard market price and asked if they would accept this premium to sell cattle through the program (Figure 2). If participants answered yes to this question, they were then asked how many head a year they would supply and the average pounds per head they would supply (in live weight) at that premium. This information was used to calculate Pounds among those who indicated willingness to participate in the TBBP (Participate = 1). If the producer indicated willingness to participate but was unwilling to accept the bid offered, the variable Pounds took on a value of zero.

Figure 2. Example Question for Willingness to Accept a Premium for Tennessee Branded Beef, Amount Would Supply, and Preferred Finishing Method
As noted by Blamey, Bennett, and Morrison (Reference Blamey, Bennett and Morrison1999), “yea-saying” can be problematic in contingent valuation surveys, which then can contribute to overestimation of willingness to pay. They suggest a dissonance minimizing format in which the respondent is allowed to support a program without commitment of dollars. They posit that allowing respondents to express their attitudes in a way that does not require the commitment of dollars can be expected to reduce yea-saying. The initial question regarding willingness to participate in the program (Participate) was designed to enable producers to opt out. Enabling these producers to opt out potentially helps reduce yea-saying bias. It also excludes producers from the premium question who are disinterested in participating in the program.Footnote 3 If these producers were included in the premium question, their zero values would be comingled with producers who were willing to participate in the program but unwilling to supply a nonzero number of Pounds because of the premium offered being too low.
Five different versions of the survey were fielded with each version being the same in every aspect except for the hypothetical premiums for selling through the TBBP. The hypothetical premium levels for participating in the branded program were $3, $5, $7, $9, and $11 per hundredweight (cwt.). These premiums were the amount above a base price of $130/cwt. (Figure 2) that was based on the weekly USDA, Agricultural Marketing Service (2016) five area weighted average price for finished cattle in May 2016. The premium levels were estimated from premiums received by producers who participate in the Certified Angus Beef (CAB) Program (Anderson, Reference Anderson2015; Tatum, Reference Tatum2015). The sample was randomly divided equally among the premium levels.
The survey concluded with participants being asked questions about their farming operation, risk attitudes, demographics, and potential barriers to participating in the TBBP. These questions were included because previous research (e.g., Babcock et al., Reference Babcock, Hayes, Lawrence and Clemens2007; Franken et al., Reference Franken, Parcell, Patterson, Smith and Poock2010; Govindasamy et al., Reference Govindasamy, Pingali, Italia and Thatch1998; Pope et al., Reference Pope, Shroeder, Langemeier and Herbel2011; Velandia et al., Reference Velandia, Clark, Lambert, Davis, Jensen, Wszelaki and Wilcox2014) has shown these factors influence producer participation in state-branded programs and retained ownership contracts.
Participants were also asked how consequential they considered their survey responses to be by answering the following yes or no question: “My responses and those from others responding to the survey will influence the outcome of a Tennessee Branded Beef program.” Research has shown that if survey participants consider their responses to be consequential (e.g., affecting an outcome), then hypothetical bias may be mitigated in a survey (Carson, Groves, and List, Reference Carson, Groves and List2014; Herriges, Kling, and Tobias, Reference Herriges, Kling, Liu and Tobias2010; Interis and Petrolia, Reference Interis and Petrolia2014; Lewis, Grebitus, and Nayga, Reference Lewis, Grebitus and Nayga2016; Li et al., Reference Li, Jensen, Clark and Lambert2016; Vossler and Evans, Reference Vossler and Evans2009).
3.2. Economic Modeling
Studies estimating the adoption of new technologies can be used as a proxy to estimate factors affecting willingness to participate in a new marketing program as well as the intensity of participation in such a program. Tobit models are often used in estimating the effects of variables on crop and/or livestock technologies or management practices adoption (Adesina, Reference Adesina1996; Baidu-Forson, Reference Baidu-Forson1999; Foltz and Chang, Reference Foltz and Chang2002; Jensen et al., Reference Jensen, Clark, Ellis, English, Menard, Walsh and de la Torre Ugarte2007; Qualls et al., Reference Qualls, Jensen, Clark, English, Larson and Yen2012; Rajasekharan and Verraputhran, Reference Rajasekharan and Verraputhran2002; Ransom, Paudyal, and Adhikari, Reference Ransom, Paudyal and Adhikari2003).
For this study, a producer's decision regarding TBBP participation can be divided into stages. The first is willingness to participate in a TBBP if profitable (Participate) given producer demographics, farm characteristics, and producer attitudes. Among those willing to participate, the decision is then the amount of cattle to supply per year to the program in live-weight pounds (Pounds) given premium levels, producer demographics, farm characteristics, and producer attitudes. Therefore, this study assumes that if producers indicate they would not supply any cattle to a TBBP, either (1) they are not willing to participate in a TBBP regardless of profitability (Participate = 0), or (2) they are willing but will not supply cattle at the premium level offered to them (Participate = 1, Pounds = 0). This response pattern follows a Tobit specification with a binary sample selection rule (Cho et al., Reference Cho, Yen, Bowker and Newman2007; Qualls et al., Reference Qualls, Jensen, Clark, English, Larson and Yen2012).Footnote 4 The binary sample selection rule uses a probit model to estimate the willingness to participate in the TBBP decision, while the Tobit model is used to estimate the pounds of cattle supplied to the program given willingness to participate in the program. The outcomes for willingness to participate in the program (Participate) take on a value of 1 if the producer is willing to participate in the TBBP if profitable, and 0 if not willing. If the producer indicates willingness (Participate = 1), then the producer's decision is the amount of cattle the producer would supply into a TBBP in live-weight pounds (Pounds), which ranges from zero to some positive value, given premium levels offered.
Willingness to participate in a TBBP can be expressed as a binary decision. The underlying utility from participating in a TBBP is expressed as
 $$\begin{equation}
Participat{e^{{\rm{*\ }}}} = {\bm{\beta 'x}} + \varepsilon ,
\end{equation}$$
$$\begin{equation}
Participat{e^{{\rm{*\ }}}} = {\bm{\beta 'x}} + \varepsilon ,
\end{equation}$$
where x is a vector of explanatory variables including farm characteristics, producer demographics, and producer attitudes; β is a vector of parameters; and ε is a random error term. The observed indicator of Participate* is whether or not the respondent stated he or she would be willing to participate in a TBBP if profitable where:
 $$\begin{equation}
Participate = \left\{ {\begin{array}{@{}*{1}{c}@{}} {1,\ {\bm{\beta '}}x + \varepsilon >0}\\ {0,\ {\bm{\beta '}}x + \varepsilon \le 0} \end{array}} \right..
\end{equation}$$
$$\begin{equation}
Participate = \left\{ {\begin{array}{@{}*{1}{c}@{}} {1,\ {\bm{\beta '}}x + \varepsilon >0}\\ {0,\ {\bm{\beta '}}x + \varepsilon \le 0} \end{array}} \right..
\end{equation}$$
Given willingness to participate, the live-weight pounds producers would enroll in the program (Pounds) can be modeled as a censored regression conditional upon willingness to participate and expressed as
 $$\begin{equation}
\begin{array}{@{}l@{}} Pounds = {\rm{max}}\left\{ {{\bm{\gamma 'z}} + u,0} \right\}\ if\ {\bm{\beta 'x}} + \varepsilon > 0,\\ {\rm{unobserved}}\ if\ {\bm{\beta 'x}} + \varepsilon \le 0, \end{array}
\end{equation}$$
$$\begin{equation}
\begin{array}{@{}l@{}} Pounds = {\rm{max}}\left\{ {{\bm{\gamma 'z}} + u,0} \right\}\ if\ {\bm{\beta 'x}} + \varepsilon > 0,\\ {\rm{unobserved}}\ if\ {\bm{\beta 'x}} + \varepsilon \le 0, \end{array}
\end{equation}$$
where z is a vector of explanatory variables (premium, producer demographics, farm characteristics, and producer attitudes), γ is a vector of parameters, and u is a random error term.
The error terms (ε, u) are assumed to be distributed as bivariate normal with zero means, variances of (1, σ 2), and a correlation of ρ. If the error terms ε and u are independent such that ρ = 0, then the two sets of parameters (β and γ, σ) are separable and the decisions can be modeled separately as a probit model on Participate (using the whole sample) and a Tobit model on Pounds (using the sample of only willing to participate in a TBBP) with left censoring at zero. The Tobit model assumes everyone is part of the market, including zero values (Blaylock and Blisard, Reference Blaylock and Blisard2005). In the case of this study, it is known that among those willing to participate, zero amounts to be supplied are a result of individuals not being offered a high enough bid to elicit a nonzero response.
However, if there is correlation between the producer willingness to participate in the TBBP (Participate) and the decision of how many pounds to supply to such a program (Pounds), then ρ ≠ 0 and the two equations should be estimated jointly by maximizing the sample likelihood function (Cho et al., Reference Cho, Yen, Bowker and Newman2007). In this case, the likelihood function becomes
 $$\begin{eqnarray}
&=& \mathop \prod _{Participate = 0} [1 - {{\rm{\Phi }}_1}({\beta ^{\rm{'}}}x)] \times {\rm{\ }}\mathop \prod _{Participate = 1,Pounds = 0} {{\rm{\Phi }}_2}({\beta ^{\rm{'}}}x, - \frac{{\gamma 'z}}{\sigma },{\rm{\ }} - \rho ) \nonumber\\
&& \times {\rm{\ }}\mathop \prod _{Participatet = 1,{\rm{\ }}Pounds > 0} \frac{1}{\sigma }{\phi _1}\left( {\frac{{Pounds{\rm{\ }} - {\rm{\ }}{\gamma ^{\rm{'}}}z}}{\sigma }} \right){{\rm{\Phi }}_1} \nonumber\\
&&\times\,\left( {\frac{{\beta 'x{\rm{\ }} + {\rm{\ }}\rho \left( {Pounds{\rm{\ }} - {\rm{\ }}\gamma 'z} \right)/\sigma }}{{{{\left( {1{\rm{\ }} - {\rm{\ }}{\rho ^2}} \right)}^{1/2}}}}} \right),
\end{eqnarray}$$
$$\begin{eqnarray}
&=& \mathop \prod _{Participate = 0} [1 - {{\rm{\Phi }}_1}({\beta ^{\rm{'}}}x)] \times {\rm{\ }}\mathop \prod _{Participate = 1,Pounds = 0} {{\rm{\Phi }}_2}({\beta ^{\rm{'}}}x, - \frac{{\gamma 'z}}{\sigma },{\rm{\ }} - \rho ) \nonumber\\
&& \times {\rm{\ }}\mathop \prod _{Participatet = 1,{\rm{\ }}Pounds > 0} \frac{1}{\sigma }{\phi _1}\left( {\frac{{Pounds{\rm{\ }} - {\rm{\ }}{\gamma ^{\rm{'}}}z}}{\sigma }} \right){{\rm{\Phi }}_1} \nonumber\\
&&\times\,\left( {\frac{{\beta 'x{\rm{\ }} + {\rm{\ }}\rho \left( {Pounds{\rm{\ }} - {\rm{\ }}\gamma 'z} \right)/\sigma }}{{{{\left( {1{\rm{\ }} - {\rm{\ }}{\rho ^2}} \right)}^{1/2}}}}} \right),
\end{eqnarray}$$
where ϕ1 and Φ1 are the univariate standard normal probability density function and cumulative distribution function (cdf), respectively, and Φ2 is the bivariate standard normal cdf.
The probability of the ith producer being willing to participate in the TBBP is then
 $$\begin{equation}
{\rm{Pr}}\left( {Participat{e^{\rm{\ }}} = 1} \right) = {{\rm{\Phi }}_1}({\beta ^{\rm{'}}}x).
\end{equation}$$
$$\begin{equation}
{\rm{Pr}}\left( {Participat{e^{\rm{\ }}} = 1} \right) = {{\rm{\Phi }}_1}({\beta ^{\rm{'}}}x).
\end{equation}$$
The probability of accepting the premium offered, given willingness to participate in the TBBP is
 $$\begin{equation}
\Pr \left( {Participate = 1,{\rm{\ }}Pounds > 0} \right) = {\rm{\ }}{{\rm{\Phi }}_2}({\beta ^{\rm{'}}}x,{\rm{\ }}\frac{{\gamma 'z}}{\sigma },{\rm{\ }}\rho )/{\rm{\ }}{{\rm{\Phi }}_1}({\beta ^{\rm{'}}}x).
\end{equation}$$
$$\begin{equation}
\Pr \left( {Participate = 1,{\rm{\ }}Pounds > 0} \right) = {\rm{\ }}{{\rm{\Phi }}_2}({\beta ^{\rm{'}}}x,{\rm{\ }}\frac{{\gamma 'z}}{\sigma },{\rm{\ }}\rho )/{\rm{\ }}{{\rm{\Phi }}_1}({\beta ^{\rm{'}}}x).
\end{equation}$$
The expected value for Pounds given willingness to participate in the TBBP and accepting the premium offered is
 $$\begin{equation}
E(Pounds|Participat{e_i} = {\rm{\ }}1,{\rm{\ }}Pounds > 0) = \gamma 'z + {\rm{\sigma \ }}{{\rm{\Phi }}_2}({\beta ^{\rm{'}}}x,{\rm{\ }}\frac{{\gamma 'z}}{\sigma },{\rm{\ }}\rho )/{\rm{\ }}{{\rm{\Phi }}_1}({\beta ^{\rm{'}}}x).
\end{equation}$$
$$\begin{equation}
E(Pounds|Participat{e_i} = {\rm{\ }}1,{\rm{\ }}Pounds > 0) = \gamma 'z + {\rm{\sigma \ }}{{\rm{\Phi }}_2}({\beta ^{\rm{'}}}x,{\rm{\ }}\frac{{\gamma 'z}}{\sigma },{\rm{\ }}\rho )/{\rm{\ }}{{\rm{\Phi }}_1}({\beta ^{\rm{'}}}x).
\end{equation}$$
The unconditional expected value of Pounds (live-weight pounds supplied across all producers) is found by multiplying equations (5) and (7).
The names and variable descriptions for the vector x in the Participate equation are shown in Table 1. The names and variable descriptions for the vector z in the Pounds equation are shown in Table 2. A discussion of the variables and associated hypotheses is provided in the following paragraph.
Table 1. Variables in Probit Model for Willingness to Participate in the Tennessee Branded Beef Program (TBBP; Participate)
a Scale: 1 = not willing at all to 10 = very willing to take risks.
Table 2. Variables for Tobit Model of Live Weight of Cattle Would Supply to a Tennessee Branded Beef Program (TBBP) Given Willingness to Participate (Pounds)
a Animal units are calculated as 0.92 × cows + 0.08 × calves + 1.35 × bulls + 0.6 × backgrounder calves + 0.6 × stocker calves + 0.92 × dairy cows + 0.8 × replacement heifers + 0.8 × miscellaneous cattle (Pratt and Rasmussen, 2001).
b Scale: 1 = not a barrier to 5 = complete barrier.
c Scale: 1 = not willing at all to 10 = very willing to take risks.
Based on findings from the studies discussed in Section 2, it is expected that willingness to participate in a TBBP would be positively influenced by higher education levels of producers, younger age, and larger farm size. Hence the variables College, Age, and higher levels of Income are expected to have positives influence on probability of Participate = 1. In addition, previous research found a positive link between attendance at extension meetings and participation in state logo programs. Hence, positive signs would be expected on MasterBQA and Extension in the Participate equation. In addition, prior research has suggested that belief in positive program outcomes may influence participation; hence, the hypothesized sign on Consequentiality is positive. Location near slaughter facilities (Federal) is hypothesized to have a positive influence on willingness to participate because producers nearby may have lower transportation costs. Those backgrounding cattle may be looking for alternatives to add value to their herd, while those already retaining or finishing animals may more easily adjust to an alternative market for some of their finished cattle. Hence, the signs on Background and Retain are hypothesized to be positive. The sign on percent of farm income from beef (%Beef) is hypothesized to be positive because it might be expected that farmers who are more specialized in beef cattle production might be more willing to participate in a TBBP. The sign on Sole cannot be postulated a priori; however, farms with more than one decision maker might be more likely to consider new marketing alternatives. Greater willingness to take on risks in trying new markets (Risk Markets) and also retaining ownership of cattle (Risk Retain) are both expected to positively influence willingness to participate. Beef cattle farmers who are less used to trying new marketing methods might be adverse to participation in a program that would require them to change their marketing practices. Beef cattle farmers who are more risk averse about retaining ownership may be less willing to enter into a program that would require finishing cattle.
For the explanatory variables in the Pounds Tobit model, the premium level (PremiumTBB) is anticipated to have a positive influence on pounds a producer would supply into the program. Larger farms in terms of herd size (AnimalUnits) are anticipated to have a positive effect on Pounds, as is proximity to a federally inspected plant (Federal). Greater number of pasture acres (PastureAcres) reflects the acreage available for on-farm grass or grass/grain finishing of animals, and percent of acres in pasture (%AcresPasture) reflects the specialization of acreage toward pastureland. Both are hypothesized to have positive influences on Pounds. If a producer is backgrounding animals (Background), a next possible step toward value added would be to finish the animals in a TBBP. However, if a producer is already retaining ownership or finishing on farm (Retain), while they might be more prepared for selling cattle into a TBBP, they may already have market arrangements in place with which the TBBP might have to compete for live weight. Greater concerns about potential program requirements of having to change breed of bulls (BarrierBull), retaining ownership through an in-state stocker/feedlot (BarrierRetain), or accepting a price negotiated by a cooperative or marketing alliance (BarrierAcceptPrice) are hypothesized to have negative influences on Pounds. If a producer is already using Angus sires, this could have a negative influence on pounds as the TBBP might in some cases be in competition with CAB premiums. If producers are willing to take on more business risk (Risk), this could likely have a positive influence on Pounds. Furthermore, if producers believe that their responses are Consequential, they may be more willing to indicate supplying a greater number of pounds into the program.
4. Results
4.1. Producer Survey Characteristics
A county-based map of the survey respondents is provided in Figure 3, along with a listing of the top five beef cow inventory counties for the state. A total of 568 producers responded to all questions needed for the analysis of TBBP willingness to participate, and a total of 380 producers stated they would be willing to supply cattle to a TBBP. Table 1 contains the means of the variables used in the probit model of producer willingness to participate in a TBBP given it is profitable (Participate). Table 2 contains the means of the variables used in the Tobit model of live-weight pounds supplied to a TBBP (Pounds). Note that in the probit, Participate was hypothesized to be influenced by producer characteristics, household income, and producer attitudes toward risk, while in the Tobit model, Pounds was hypothesized to be influenced by the premium offered, number of beef animal units and pasture share, current practices including backgrounding or retaining or finishing animals, and use of Angus bull sires, as well as attitudes toward risk and perceived potential barriers of the program.
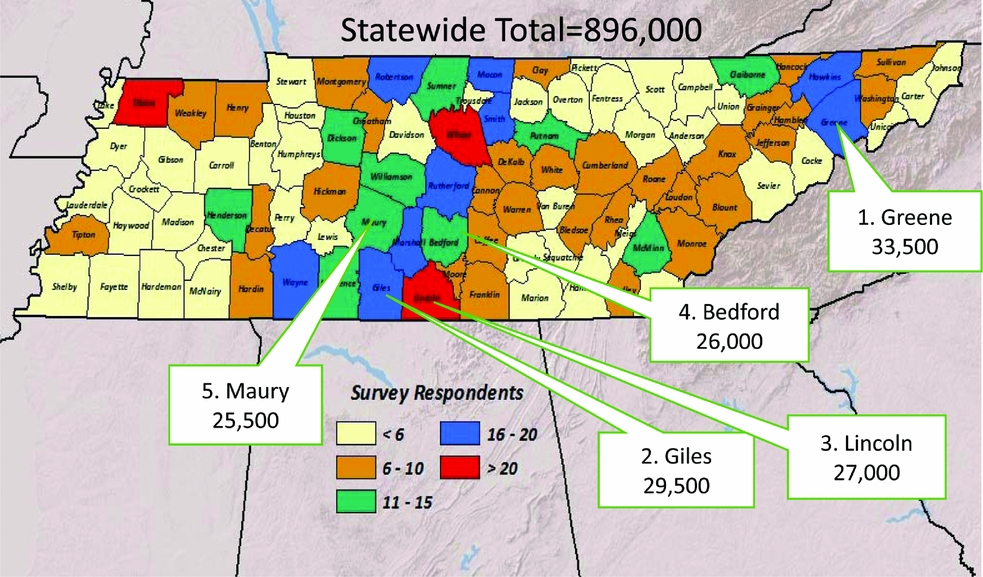
Figure 3. Map of Survey Respondents, by County, and Tennessee's Top Five Counties for Beef Cow Inventory (source: USDA-NASS, 2016).
Notably, nearly 67% of producers expressed willingness to participate in a TBBP if it was profitable (Table 1). On average, producers indicated they would supply 32,329 pounds per year to a TBBP (Table 2).Footnote 5 Assuming the average animal weighs 1,300 pounds, this represents the average farm supplying 25 head of cattle annually. Taking the cumulative total pounds across respondents who were willing to supply cattle to a TBBP, this sums to 12 million pounds of cattle or 9,450 head of cattle supplied to a TBBP annually. By comparison, according to USDA statistics, the state slaughters about 64,900 head in federally inspected facilities annually (USDA-NASS, 2017b).
4.2. Probit Model of Willingness to Participate in a Tennessee Branded Beef Program
The models for producer willingness to participate in a TBBP (Participate) and the pounds producers would supply to a TBBP (Pounds) were initially estimated jointly as a Tobit with a probit sample selection using a conditional mixed process estimator (Roodman, Reference Roodman2011). However, the estimated correlation coefficient on the error terms between the two equations was not significantly different from zero; thus, the models were estimated separately as a probit model on Participate and a Tobit model on Pounds.
The results of the probit model on Participate are shown in Table 3. The likelihood ratio test against an intercept only model indicated the probit model was significant overall. The model correctly classified 72.89% of the observations for Participate.
Table 3. Estimated Probit Model for Willingness to Participate in the Tennessee Branded Beef Program (Participate)Footnote a

a Asterisks (***) = significant at α = 0.01; ** = significant at α = 0.05; * = significant at α = 0.10.
b Income levels compared with a household income of at least $150,000.
c LR CHISQ(15) is the calculated log likelihood ratio statistic testing the model against an intercept-only model and is distributed as chi-square with 15 degrees of freedom.
Older age of the producer (Age) had a negative effect on the probability of a producer being willing to participate in TBBP. For each year of age, the probability of willingness to participate declined by 0.6% (P < 0.01). This result is expected given previous research has found that younger producers are more likely to be aware of producer programs such as Pick Tennessee Products (Velandia et al., Reference Velandia, Clark, Lambert, Davis, Jensen, Wszelaki and Wilcox2014).
As expected, producers who viewed themselves as more willing to take risks to find new markets for beef (RiskMarkets) and producers who were more likely to take risks regarding retaining ownership (RiskRetain) were more likely to be willing to participate in the TBBP. For example, as producers considered themselves one unit more likely to take risks in finding new markets for beef, they were 2.5% more likely to be willing to participate in the TBBP (P < 0.05). Similarly, as producers considered themselves one unit more likely to take risks in retaining ownership of cattle, they were 2.1% more likely to be willing to participate in the TBBP (P < 0.01). These results are consistent with expectations, given one would expect producers who are more willing to retain ownership and more willing to find new markets for beef would also be more likely to participate in a TBBP, and results by Pope et al. (Reference Pope, Shroeder, Langemeier and Herbel2011) who found that as producers had higher risk tolerance levels, they were more likely to retain their calves past weaning.
Although the estimated coefficient and marginal effect on backgrounding (Background) were not significant, they were positive and significant for retaining ownership of cattle or finishing on farm (Retain). This indicates that producers who retain ownership of cattle in feedlots or finish cattle on farm (Retain) were 16.5% more likely to be willing to participate in a TBBP ({< 0.01) than producers who do not retain ownership of cattle or finish cattle on farm. It was expected that producers who retain ownership or already finish on farm would be more likely to be willing to participate in the TBBP than producers who do not; however, the magnitude of this difference in probability of participation was expected to be even greater than 16.5%. Thus, it is possible that those who do not currently finish or retain ownership might also be willing to participate.
Being a college graduate (College), differences in household income (Income50, Income100, Income150), and being a sole (Sole) proprietor did not result in a significant effect on the probability of being willing to participate in the TBBP. Location in a county with proximity to federally inspected slaughter facilities (Federal) also did not significantly affect the probability of being willing to participate in the TBBP. This may suggest that producer willingness to participate is fairly uniform across counties whether near federally inspected slaughter facilities or not. Similarly, the estimated coefficient and marginal effects on percent of farm income from beef (%Beef) were not significant. Use of extension service information (Extension), being Master Beef Producer or Beef Quality Assurance (BQA) certified (MasterBQA), and belief that the producer's survey responses would affect a TBBP (Consequential) did not have significant estimated coefficients or marginal effects.
4.3. Tobit Model of Pounds Supplied to a Tennessee Branded Beef Program
Table 4 presents the results of the Tobit model of pounds supplied to a TBBP. The likelihood ratio test of the Tobit model revealed the model to be significant overall. The percent of nonzero observations for Pounds correctly classified was 79.73%, and the predicted weight was 33,842.32 pounds per farm. The correlation between the predicted and nonzero values of Pounds was 0.612, and the R 2D was 0.374.Footnote 6 The estimated coefficient and marginal effects on the premium (PremiumTBB) were not significantly different from zero. Other variables with no statistically significant effect included Federal and BarrierAcceptPrice. Hence, beef cattle farmers who were willing to participate would supply about the same live weight regardless of proximity to a federally inspected slaughter facility and regardless of how much they viewed cooperative or marketing alliance negotiation of prices as a barrier. However, variables with significantly positive influences on pounds supplied (Pounds) were AnimalUnits, %AcresPasture, Background, Risk, and Consequential. Variables with significantly negative influences include Sole, Retain, BarrierBull, BarrierRetain, and Angus. The marginal effects suggest that for each additional animal unit on the farm (AnimalUnit), producers indicated they would supply 125 more pounds of beef to the TBBP (P < 0.01). A producer backgrounding cattle (Background) positively influenced the pounds that would be supplied to the TBBP by 4,899 pounds (P < 0.05). For each percentage of farmland in pasture (%AcresPasture), the quantity supplied to the TBBP is predicted to increase by 10,356 pounds (P < 0.05). As a producer is more willing to take beef cattle business risks (Risk), he or she is predicted to supply 10,104 more pounds to a TBBP (P < 0.10). If the producer believed survey responses could influence a TBBP (Consequential), this resulted in the number of pounds supplied to the TBBP increasing by 4,888 pounds (P < 0.10).
Table 4. Estimated Tobit Model for Pounds to Be Supplied into the Tennessee Branded Beef Programa

aAsterisks (***) = significant at α = 0.01; ** = significant at α = 0.05; * = significant at α = 0.10.
bLR CHISQ(14) is the calculated log likelihood ratio statistic testing the model against an intercept-only model and is distributed as chi-square with 14 degrees of freedom.
Sole proprietorship (Sole) is predicted to reduce pounds supplied by 6,438. One possible explanation is that sole proprietors may bear risk differently than a partnership or LLC; hence, they may be more cautious about supplying larger amounts of cattle. A producer already retaining cattle or finishing them on farm (Retain) would be willing to supply 4,929 fewer pounds than a producer not already using these practices (P < 0.05). If producers are already finishing on the farm they may have an established program or arrangement into which their cattle are already being sold. Hence, a TBBP could be competing for the head marketed already through an established program or arrangement. In addition, farmers may view more established relationships for finishing (which are currently out of state) as less risky, because current avenues for retaining and finishing cattle in Tennessee are few. Producers using Angus sires on their farm would supply about 6,315 pounds less than a farm not using Angus sires (P < 0.05). This may reflect that producers with Black Angus sires are receiving sufficient premiums through the feeder cattle market or via CAB premiums at the packer level. Perceived barriers of program requirements with negative influences included having to change breed of bulls (BarrierBull) and retaining ownership through an in-state stocker/feedlot (BarrierRetain). Both of these barriers resulted in decreased pounds being supplied to the TBBP (P < 0.01 and P < 0.10, respectively). BarrierBull had the largest marginal effect, with each increase in the level of the perceived barrier decreasing pounds supplied to the TBBP by 2,552 pounds. Although the possible barrier of having to accept a price negotiated by a cooperative or marketing alliance (BarrierAcceptPrice) was considered, the estimated coefficient and marginal effects were not significant.
Although Consequential did not influence willingness to participate in the TBBP, among those willing, it did significantly increase the number of pounds producers would supply (P < 0.10). To further explore the impact of survey consequentiality, several attitudes about the TBBP were compared across consequentiality levels. Attitudes about the TBBP differed across respondents’ belief in survey consequentiality (Table 5). Those who believed their responses would influence a TBBP were more likely to agree that a TBBP would help the local economy and cattle producers’ incomes. However, these respondents also held stronger beliefs that consumers would pay a premium for a Tennessee Branded Beef (TBB) product. Hence, producers believing in survey consequentiality had more positive feelings about the public goods aspects of a TBBP (e.g., helping the economy and producer incomes), but they also thought consumers would be willing to pay premiums for TBB products.
Table 5. Attitudes about a Tennessee Branded Beef (TBB) Program across Consequentiality BeliefsFootnote a
a Asterisks (***) = significant at α = 0.001.
b On a scale from 1 = strongly disagree to 5 = strongly agree.
c On a scale from 1 = not at all likely to 5 = extremely likely. < tex − math/ >
5. Conclusions
Tennessee consumers have stated they are willing to pay a premium for TBB (Dobbs et al., Reference Dobbs, Jensen, Leffew, English, Lambert and Clark2016; Merritt et al., Reference Merritt, DeLong, Griffith and Jensen2017). Therefore, this study evaluated whether Tennessee cattle producers are willing to participate in the TBBP and, among those willing, how many pounds of beef they would supply to such a program. This study also ascertained the factors influencing producer willingness to participate in a TBBP and the amount of beef participants would supply to the program. It was found that 67% of producers surveyed were willing to participate in the TBBP given it was profitable, and among those willing to participate, these producers were willing to supply nearly 33,000 pounds of beef to a TBBP annually.
The results from this study suggest farmer demographics, as well as attitudes toward risks, play a role in influencing willingness to participate in a TBBP. Younger producers, who are more willing take risks in finding new markets, are more likely to be willing to participate in a TBBP. A surprising study finding is that producers willing to participate in a TBBP would supply cattle to a TBBP regardless of the premium level they received. This may be the result of “yea-saying” even though producers were provided with potential requirements of the program (Blamey et al., Reference Blamey, Bennett and Morrison1999). However, future research could provide example finishing cost estimates associated with participation in a TBBP in the survey instrument. This could potentially help diminish yea-saying because this would provide producers with a reference point for answering whether they would accept the premium level offered. Furthermore, cost estimates could serve as an information treatment. In addition, using a broader sample of cattle farmers, beyond those who participate in the TAEP, might provide differing estimates.
Certain program requirements were perceived as barriers that would decrease the amount producers would supply to a TBBP. If producers had to change breed of bulls or retain ownership through an in-state feedlot, these would negatively affect the amount producers would supply. This information could be helpful in designing program requirements for a TBBP. Belief in survey consequentiality positively influenced the number of pounds a producer willing to participate would supply to a TBBP. Producers who believed their survey responses might have an outcome on a TBBP also agreed that a TBBP would help the local economy and farm incomes, and that consumers would pay a premium for TBB.
The presence of Black Angus sires in a herd was significant and negative in predicting the amount of beef a participating producer would supply to a TBBP. This suggests that a TBBP might find it more difficult to recruit more live-weight pounds into the program among herds with Black Angus sires. Thus, for a TBBP to be successful, it is possible that participants in the TBBP would have to receive higher premiums than they currently receive for Black Angus–sired cattle. Because 78% of the sample had Black Angus sires, future research needs to determine if these producers are, in fact, dissuaded from enrolling greater live weight in a TBBP because they are already receiving higher premiums than they perceive they would receive in a TBBP. However, it should be noted that Merritt et al. (Reference Merritt, DeLong, Griffith and Jensen2017) found that Tennessee consumers were willing to pay higher premiums for TCB steak and ground beef than CAB steak and ground beef. In fact, consumers were willing to pay nearly a $1.20/pound more for TCB steak than CAB steak and $0.75/pound more for TCB ground beef than CAB ground beef in the study by Merritt et al. (Reference Merritt, DeLong, Griffith and Jensen2017).
Proximity to a federally inspected slaughter facility did not have a significant effect on producer willingness to participate in the TBBP or the amount of beef participating producers would supply to a TBBP. This suggests that producers who are willing to supply cattle to a TBBP are not deterred from traveling the distances required to market their cattle to such a program. The result also suggests that willingness to participate in and potential supply for a TBBP is geographically spread across the state regardless of proximity to a federally inspected slaughter facility. A possible interpretation is that producers do not consider the existing slaughter infrastructure in the state to be a barrier to the feasibility of a TBBP. This is consistent with Dalton et al. (Reference Dalton, Holland and Hubbs2007) who found there to be excess slaughter capacity in Tennessee.
This research found that 67% of the Tennessee cattle producers surveyed were willing to participate in a TBBP given it was profitable, and, on average, among those willing to participate, each producer was willing to supply nearly 33,000 pounds of beef on average to a TBBP annually. Furthermore, previous consumer research (e.g., Dobbs et al., Reference Dobbs, Jensen, Leffew, English, Lambert and Clark2016; Merritt et al., Reference Merritt, DeLong, Griffith and Jensen2017) found that Tennessee consumers were willing to pay a premium for a TCB product. Together, these results indicate there would be both supply and demand for a state-branded beef product in the state of Tennessee. However, although both Tennessee beef producers and consumers have stated a desire for a state-branded beef product, results should be viewed with caution because it is still unknown whether producers’ and consumers’ stated preferences will align with their revealed preferences.


 Open access