


1. Introduction
Soil fertility and health are determinants for increasing agricultural productivity. In most developing countries where soil degradation is prominent, maintaining good soil fertility is important to boost agricultural production. Soil testing was first introduced to ascertain the conditions of the soils and provide recommendations on how to improve its nutrient components and fertility (Jones and Kalra, Reference Jones and Kalra1992). The process is a cost-effective means to identify soils where nutrients such as nitrogen, phosphorus, and potassium (NPK) are deficient, and must be corrected to attain economically optimum crop yields (Wu and Babcock, Reference Wu and Babcock1998). Soil testing is a tool used to ensure that the additional use of fertilizer and lime improves crop performance and economic benefit without excessive waste or possible adverse environmental effects (Zhang et al., Reference Zhang, Johnson, Krenzer and Gribble1998). It is also seen as an effective way to reduce nonpoint-source pollution from agriculture (Wu and Babcock, Reference Wu and Babcock1998). In the late 1940s, soil testing became an important factor in crop production decision making in the United States (Jones and Kalra, Reference Jones and Kalra1992).
For many years, agriculture in Haiti experienced soil degradation and nutrient depletion that affected crop yields and farmers’ incomes. The direct consequence of soil degradation is a prolonged history of food insecurity in Haiti (Lewis and Coffey, Reference Lewis and Coffey1985; Bargout and Raizada, Reference Bargout and Raizada2013). There is a need for new technologies or inputs with novel attributes that can help to increase agricultural production, reduce production costs, and increase revenue. Soil testing services to farmers is quite relevant in the context of Haiti where soil conditions are unknown and soil nutrient imbalance exists because of the frequent use of the predominant fertilizer formulation 12-12-20 (NPK), irrespective of soil quality or deficiency (Bargout and Raizada, Reference Bargout and Raizada2013). Farmers apply fertilizers randomly without any standards recommendations. This behavior may cause loss of money and result in environmental issues. Thus, soil testing services can help farmers apply the required amount and kinds of supplemental nutrients. As mentioned by Zhang et al. (Reference Zhang, Johnson, Krenzer and Gribble1998), providing farmers with information needed to apply the right amount of nutrients to the soils can save money and protect the environment. Based on this evidence, the U.S. Agency for International Development (USAID) intends to launch the first soil laboratory in the northern region of Haiti. This laboratory will provide services to farmers and nongovernmental organizations (NGOs) in the region.
However, the sustainability of this laboratory will depend on farmers’ economic incentives and their ability to pay for the soil testing services. We believe that farmer support is essential for the long-term sustainability of the laboratory. Thus, it is important to investigate farmers’ willingness to pay (WTP) for soil testing services. Following Liu and Zhang (Reference Liu and Zhang2011), we hypothesize that farmers would be more willing to pay for the soil testing services if they have higher valuation of the services. Additionally, we are interested to find out the factors that affect their WTP for soil tests. These factors are important in popularizing the process among farmers. Several studies investigate the WTP for environmental goods and services as well as factors driving the WTP. These studies have focused, in most cases, on the consumer side of the valuation of goods and services (Alfnes et al., Reference Alfnes, Guttormsen, Steine and Kolstad2006; Boys, Willis, and Carpio, Reference Boys, Willis and Carpio2014; Huffman et al., Reference Huffman, Shogren, Rousu and Tegene2003; Nandi et al., Reference Nandi, Bokelmann, Gowdru and Dias2016; Sriwaranun et al., Reference Sriwaranun, Gan, Lee and Cohen2015; Xu and Wu, Reference Xu and Wu2010). However, few studies have focused on producers’ valuation of goods and services. In the field of agribusiness, Roe and Antonovitz (Reference Roe and Antonovitz1985) studied the WTP for information under risk, while Patrick (Reference Patrick1988) investigated farmers’ WTP for crop insurance. Studies by Whitehead, Hoban, and Clifford (Reference Whitehead, Hoban and Clifford2001), Budak, Budak, and Kaçira (Reference Budak, Budak and Kaçira2010), and Yegbemey et al. (Reference Yegbemey, Yabi, Heubach, Bauer and Nuppenau2014) researched farmers’ WTP for agricultural extension services. WTP for novel technologies or inputs were also studied by Kenkel and Norris (Reference Kenkel and Norris1995), Hudson and Hite (Reference Hudson and Hite2003), Basarir, Sayili, and Muhammad (Reference Basarir, Sayili and Muhammad2009), and Lillo et al. (Reference Lillo, Acuña, Vásquez, Mena and Rodríguez2014). These studies have provided background on producers’ WTP for acquiring information on agricultural inputs either in developed or developing countries. They also provided methodological guidelines on farmers’ valuation of goods and services, which were used in our study.
In the literature, we found two studies that focused on farmers’ valuation of soil testing. Liu and Zhang (Reference Liu and Zhang2011) examined the factors influencing Chinese farmers’ willingness to adopt soil testing technology. Using a double-bounded dichotomous choice contingent valuation method (CVM), they found that farm size, land distribution pattern, and type of crop grown; gender, age, and education level; and usage of private lending affect farmers’ willingness to adopt soil testing technology. Glendenning, Babu, and Asenso-Okyere (Reference Glendenning, Babu and Asenso-Okyere2011) focused on farmers’ WTP for soil testing in southern India. Their results indicated that farmers who have tested their soil and followed the advice of the soil testing service provider had a higher valuation of the service. These two studies gave an insight into farmers’ WTP for soil testing. Our study is similar to those listed previously and provides evidence of farmers’ valuation of soil testing in northern Haiti. The general objective of this study is to generate the demand-side information from farmers who use the laboratory. The specific objectives are two-fold: (1) to estimate the mean farmers’ WTP in the study area and (2) to identify the determinants that affect farmers’ WTP for soil testing services.
The remainder of the article proceeds by providing a theoretical framework in Section 2, giving an overview of methods used to measure WTP in the Section 3, describing the data collection procedures in the Section 4, presenting the results and discussion in the Section 5, and presenting some conclusions and policy implications in Sections 6 and 7, respectively.
2. Theoretical Framework
Following Hudson and Hite (Reference Hudson and Hite2003), we hypothesize that soil testing services would have an effect on farmers’ profits as a result of soil fertility improvement or cost reduction from precision in fertilizer application. The theoretical framework is derived from producer theory. Let us assume that farmers maximize profit and face a perfectly competitive input and output market. The individual farmer produces a product Y to be sold on the market. So he/she faces the following maximization problem:
 $$\begin{equation}
{\rm{Max}}\ {\rm{\Pi }} = {P_y}Y - C\left( {Y,r,{\bm{q}}} \right),
\end{equation}$$
$$\begin{equation}
{\rm{Max}}\ {\rm{\Pi }} = {P_y}Y - C\left( {Y,r,{\bm{q}}} \right),
\end{equation}$$
where Π is the profit function, Py is the price of output Y, and C(Y, r, q) is the cost function of the individual farmer. The cost function can be defined as the solution of the following problem:
 $$\begin{equation}
\begin{array}{@{}l@{}} {\rm{Min}}\ C = rX\\ {\hbox{Subject to }}\,Y = f\left( {X,q} \right) \end{array},
\end{equation}$$
$$\begin{equation}
\begin{array}{@{}l@{}} {\rm{Min}}\ C = rX\\ {\hbox{Subject to }}\,Y = f\left( {X,q} \right) \end{array},
\end{equation}$$
where r is a vector of input prices, X is a vector of input quantities, f(X, q) is the production function of Y, and q is a vector of input quality levels—here soil quality because of the soil testing service. The level of q is fixed exogenously; thus the profit and the cost functions are conditional on q. Py, r, and q produce the optimal level of output, Y(py, r, q), and input, X(Y, r, q), which generate the cost function C(Y, r, q) and the indirect profit function Π (py, r, q).
The variation in profit attributable to change in q from q 0 to q 1 yields the following expression:
 $$\begin{equation}
d = {\rm{\Pi \ }}\left( {{p_y},r,{q^1}} \right) - {\rm{\Pi \ }}\left( {{p_y},r,{q^0}} \right) = F\left( {{p_y},r,{q^1},{q^0}} \right).
\end{equation}$$
$$\begin{equation}
d = {\rm{\Pi \ }}\left( {{p_y},r,{q^1}} \right) - {\rm{\Pi \ }}\left( {{p_y},r,{q^0}} \right) = F\left( {{p_y},r,{q^1},{q^0}} \right).
\end{equation}$$
This expression represents the maximum amount of money a farmer is willing to pay for improvement in fertilizer efficiency leading to soil fertility and quality enhancement. This amount theoretically depends on output price, input prices, and the expectation in soil quality improvement. The equation could be extended to include socioeconomic and farm management factors and yields the following model:
 $$\begin{equation}
{d_i} = F\left( {{p_{yi}},{r_i},q_i^1,q_i^0,{X_i}} \right),
\end{equation}$$
$$\begin{equation}
{d_i} = F\left( {{p_{yi}},{r_i},q_i^1,q_i^0,{X_i}} \right),
\end{equation}$$
where Xi stands for socioeconomic and demographic characteristics of the ith farmer.
3. Measuring Farmers’ Willingness to Pay
The value of goods and services is measured based on the importance of the goods and services for consumers and their preferences and choices. Consumer preferences are evaluated by the amount they are willing to pay for the goods or services. Thus, the WTP for goods or services is defined as the maximum price people are willing to pay for goods or services (Wertenbroch and Skiera, Reference Wertenbroch and Skiera2002; Yegbemey et al., Reference Yegbemey, Yabi, Heubach, Bauer and Nuppenau2014). This technique is increasingly used in the absence of a real market where consumers reveal how much they are willing to give up to obtain a good or service (Lofgren et al., Reference Lofgren, Thanh, Chuc, Emmelin and Lindholm2008).
Methods for valuation include stated and revealed preferences. The stated preference (SP) method estimates the monetary value of goods and services by asking people how much money they are willing to pay for a particular good or service, or how much they are willing to accept as compensation if the services were to be eliminated (Birol and Das, Reference Birol and Das2010; Boxall et al., Reference Boxall, Adamowicz, Swait, Williams and Louviere1996; Rasul, Reference Rasul2009). Two most common methods are used in this category: the CVM and the choice experiment model. Revealed preference (RP) methods differ from SP methods in that they use people's actual behavior in real markets, rather than their conjectured behavior in hypothetical markets. The RP method uses information about a marketed commodity through a complementary commodity to infer the value of a related, nonmarketed commodity (surrogate or proxy) market (Rasul, Chettri, and Sharma, Reference Rasul, Chettri and Sharma2011). Methods used for valuation may depend on time and money constraints.
In this study, the CVM was used. CVM is a survey-based methodology that simulates a market in which farmers are exposed to information on new goods or services and make decisions about their WTP (Chee, Reference Chee2004; Zapata and Carpio, Reference Zapata and Carpio2014). This method was first used by Davis (Reference Davis1963) who designed the market to assess the economic value of recreational possibilities of Maine's forests. CVM is considered flexible and adaptive to some valuation tasks that other techniques cannot handle (Padi, Awuah-Addor, and Nunfam, Reference Padi, Awuah-Addor and Nunfam2015). It has been widely used by studies in the fields of environmental and health economics (Cho et al., Reference Cho, Yen, Bowker and Newman2008; Cho, Newman, and Bowker, Reference Cho, Newman and Bowker2005; Hudson and Hite, Reference Hudson and Hite2003; Jin et al., Reference Jin, Guo, Mao, Zhou and Cheng2016; Nkansah, Dafor, and Essel-Gaisey, Reference Nkansah, Dafor and Essel-Gaisey2015; Whitehead, Reference Whitehead1995; Yegbemey et al., Reference Yegbemey, Yabi, Heubach, Bauer and Nuppenau2014). However, because CVM uses a hypothetical market, the main issue is whether people are actually willing to pay what they claim they will pay. The CVM has been criticized for its inability to deliver reliable and accurate estimates of the WTP (Diamond and Hausman, Reference Diamond and Hausman1994) and for many biases include strategic bias, design bias, hypothetical bias, and operational bias (Padi, Awuah-Addor, and Nunfam, Reference Padi, Awuah-Addor and Nunfam2015; Pearce and Turner, Reference Pearce and Turner1990). A study by Loomis (Reference Loomis2011) widely discussed the different approaches used to mitigate the hypothetical bias that is common in CVM studies. These approaches include ex ante methods such as cheap talk and ex post approaches such as certainty follow-up statements. These approaches produced various effects on the WTP for goods and services. Given the fact that no soil testing services exist in northern Haiti, we decided to use the CVM in this study. To reduce the different biases, we used an approach that is described in Section 4.4.
4. Material and Methods
4.1. Study Area
Data were collected in northern Haiti within AVANSE (Appui a la Valorisation du potentiel Agricole du Nord, pour la Securite Economique et Environnementale)/USAID project intervention areas (Figure 1). The Northern Corridor of Haiti extends 70 km along the region's Route National 6 and connects about 600,000 people. The project covers a wide area on the Northern Plain. A number of small farmers cultivate lands on degraded soils on the plains and slopes.
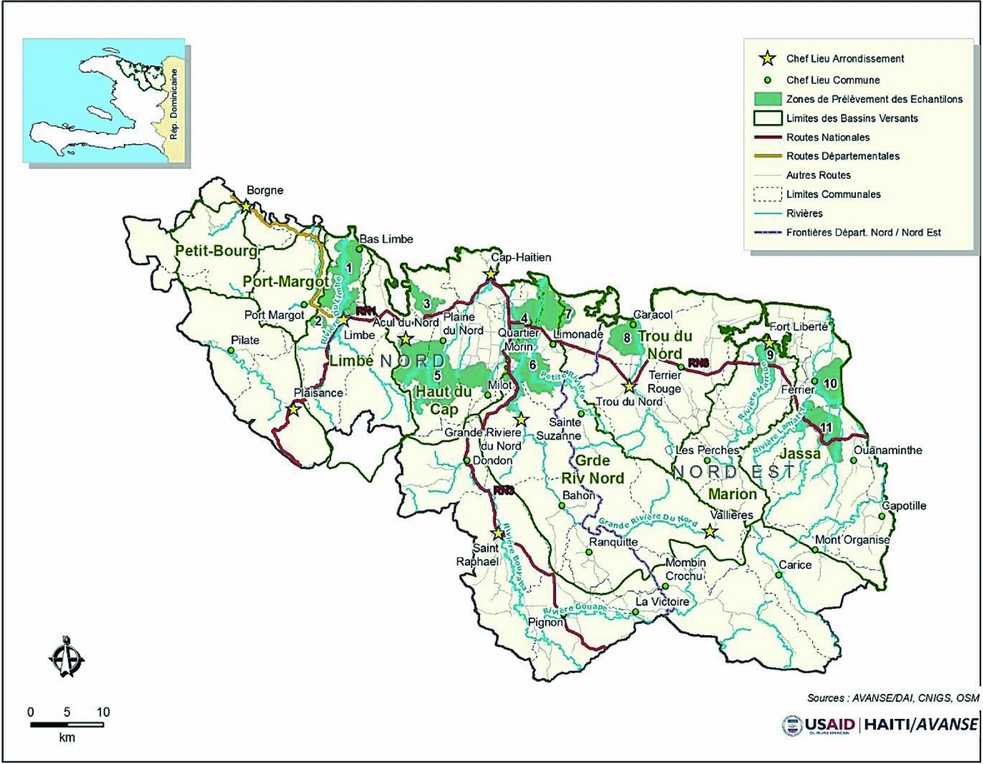
Figure 1. Project Intervention Areas (source: DAI Global LLC [Development Alternatives Incorporated, 2014])
4.2. Data Collection
Data collection involved three steps. In the first step, 20 interviewers who spoke Haitian Creole were recruited and trained from March 16 to 17, 2016, on data collection procedure and questionnaire administration. Interviewers were briefed on objectives of the survey, sample design, the selection of respondents within households, methods of conducting a survey, respondent bias minimization, and survey questionnaire techniques. Participants also received training on basic rules for avoiding the introduction of bias into the survey and measures of soliciting unbiased information from farmers. Interviewers practiced mock interviews among themselves and discussed problems and questions that arose. Trainees also administered the questionnaire to other students involved in agriculture. Trainees received information on the ethical conduct of personal interviews.
The second step consisted of pretesting the questionnaire with farmers in close-by villages to ensure that the questions were well formulated. As a result of the pretesting, some questions were deleted or modified.
In the third step, the enumerators went in the field from May 16 to June 3, 2016, to collect data. The fieldwork was supervised by the graduate research assistant who conducted field visits to observe the data collection and make sure it was done well.
4.3. Sampling Method
A multistage approach was used to select farmers participating in the study. In the first stage, we purposefully selected 17 localities within the project intervention areas. In the second stage, we randomly selected farmers from the list of enrolled project participants in each zone who were participating in the project. The list was provided by the project officer.
In some instances, when farmers’ names provided by the project officer were not found on the Excel spreadsheet, a snowball sampling method was employed to add farmers to the sample. Snowball sampling relies on referrals from initial subjects to generate additional subjects or find replacements. Thus, farmers on the list made referrals to nearby farmers as replacements for those who were not present or not found. The AVANSE/USAID project implemented a pilot program on soil testing to farmers. This program consisted of collecting 400 soil samples from farmers who were involved in the project. Those samples were analyzed for free, and the testing results were released to participant farmers during the survey as a means of encouraging participation in the survey. Thus, our survey sample also included some of those farmers who participated in the free soil testing program. In total, 456 farmers were interviewed.
4.4. Survey Instrument
A structured questionnaire allowed the collection of information related to farm household socioeconomics and demographics data, knowledge and perception on soil testing services, and WTP for soil testing. The questionnaire was translated and administered in Haitian Creole to ensure that farmers understood the content of the questionnaire.
Questionnaires were close ended and were administered through informal interviews. Figure 2 shows the structure of the WTP questions. The WTP values obtained from a structured questionnaire can be proposed either in a descending or ascending order. The descending order has been shown to generate bias estimates and give a higher WTP average price. The ascending order, on the other hand, has produced the opposite result (Bennett, Brennan, and Kearns, Reference Bennett, Brennan and Kearns2003; Brennan, Reference Brennan1995; Garbarino and Slonim, Reference Garbarino and Slonim1995; Monroe, Reference Monroe2003). Though each ordering comes with its own biases (Breidert, Hahsler, and Reutterer, Reference Breidert, Hahsler and Reutterer2006), the findings of the small number of studies have consistently shown a positive effect for presenting prices in descending order (Bennett, Brennan, and Kearns, Reference Bennett, Brennan and Kearns2003). The reason for the choice of this approach as opposed to the approaches used in the literature is that soil testing is not now well known in the study area and farmers are not used to paying for the services. We also chose the descending order because we were told that farmers in the area are accustomed to receiving subsidized goods, and we were warned by the interviewers and the agricultural officers that farmers would be willing to accept the least possible payment if given such a choice. We chose to guide them after explaining properly the benefits of soil testing and describing the impact on agricultural productivity. Four questionnaires were dropped from the data set for inconsistency and incompleteness of information.
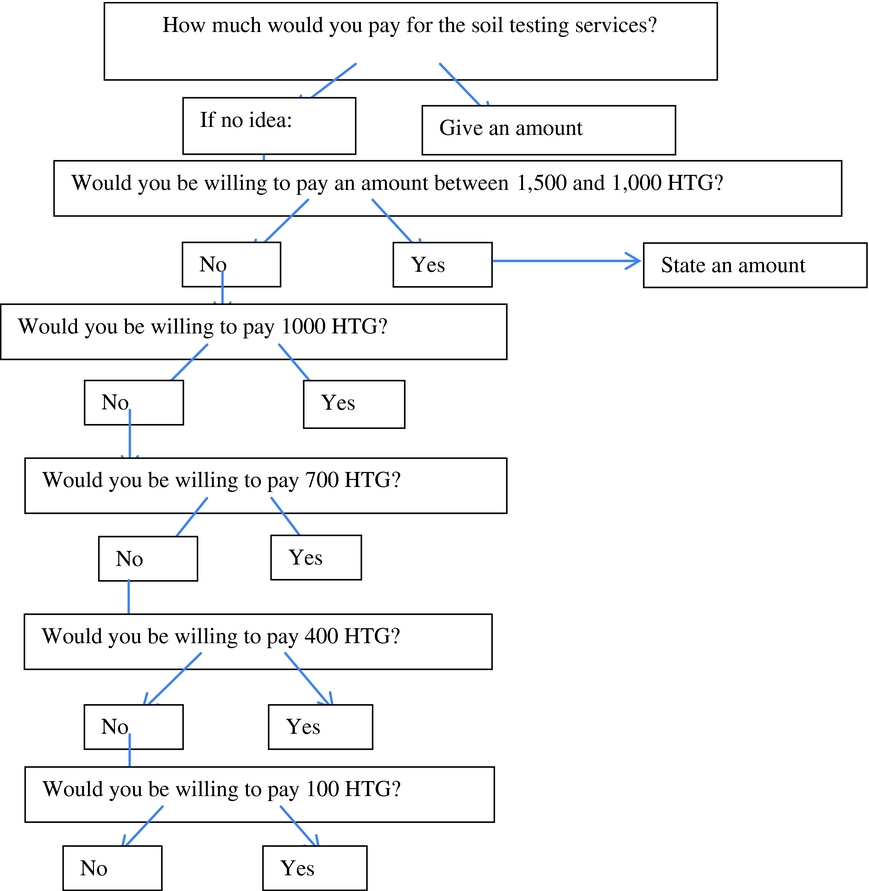
Figure 2. Structure of Willingness-to-Pay Questionnaire
Descriptive statistics were used to evaluate farmers’ socioeconomic characteristics. Interval regression was used to determine the factors affecting the WTP for soil testing services.
4.5. Empirical Modeling
Figure 2 shows the structure of the WTP responses. An analysis of the responses revealed that the distribution of stated WTP is skewed; some respondents state a zero WTP (about 6% of respondents); other respondents state a WTP different from most of the respondents (outliers) (about 4%); and respondents’ WTP tends to concentrate (“heap”) around certain values, 24% of values around 100 Haitian gourdes (HTG; 1 U.S. dollar [USD] = 62 HTG), 24% of WTP values around 400 HTG, and 19% around 1,000 HTG (Figure 3). According to Lofgren et al. (Reference Lofgren, Thanh, Chuc, Emmelin and Lindholm2008), these issues arise in many WTP studies. Different methods have been used to deal with these issues. Aristizabal (Reference Aristizabal2012) showed how the log-normal model is used to deal with the skewness. In that case, the zero WTP and the outliers are excluded. The heap effect suggests that their stated WTP represents a certain interval, rather than a precise amount (Lofgren et al., Reference Lofgren, Thanh, Chuc, Emmelin and Lindholm2008). Torelli and Trivelato (Reference Torelli and Trivellato1993) have shown that this behavior, if not considered, may disguise true relationships. To account for these issues mentioned previously and assuming that the WTP lies between intervals (Lofgren et al., Reference Lofgren, Thanh, Chuc, Emmelin and Lindholm2008; Yang, al., Reference Yang, Hu, Mupandawana and Liu2012), we use the interval regression model. The WTP values were grouped into the following intervals: [0–100[, [100–400[, [400; 700[, [700–1,000[, and [1,000; +∞[. Supposing that y*i represents the true value of the WTP, which is unobserved, the specification of the model can be written as follows:
 $$\begin{equation}
y_i^* = {X_i}\beta + {\varepsilon _i},
\end{equation}$$
$$\begin{equation}
y_i^* = {X_i}\beta + {\varepsilon _i},
\end{equation}$$
where β represents the parameters to be estimated, Xi is the set of independent variables, and εi is the error term, which is assumed to have mean zero and be normally distributed. The interval regression estimates the probability that a latent variable y*i exceeds one threshold but is less than another threshold—that is, it estimates the probability of the latent variable lying in a certain interval (Cawley, Reference Cawley2008; Kpade et al., Reference Kpade, Mensah, Fok and Ndjeunga2016). Therefore, the likelihood contribution of the individual is as follows:
 $$\begin{equation}
\begin{array}{@{}l@{}} L = \mathop \prod \limits_{{y_i} = 1} {\rm{\Phi }}\left( {\frac{{\ln 100 - \beta {x_i}}}{\sigma }} \right)\mathop \prod \limits_{{y_i} = 2} \left[ {{\rm{\Phi }}\left( {\frac{{\ln 400 - \beta {x_i}}}{\sigma }} \right) - {\rm{\Phi }}\left( {\frac{{\ln 100 - \beta {x_i}}}{\sigma }} \right)} \right] \ \mathop \prod \limits_{{y_i} = 2} \left[ {{\rm{\Phi }}\left( {\frac{{\ln 700 - \beta {x_i}}}{\sigma }} \right)} \right. \\ \qquad -\,\left. {{\rm{\Phi }}\left( {\frac{{\ln 400 - \beta {x_i}}}{\sigma }} \right)} \right]\,\mathop \prod \limits_{{y_i} = 2} \left[ {{\rm{\Phi }}\left( {\frac{{\ln 1,000 - \beta {x_i}}}{\sigma }} \right)}\right.\\ \qquad -\, \left. {{\rm{\Phi }}\left( {\frac{{\ln 700 - \beta {x_i}}}{\sigma }} \right)} \right] \mathop \prod \limits_{{y_i} = 2} \left[ {1 - {\rm{\Phi }}\left( {\frac{{\ln 1,000 - \beta {x_i}}}{\sigma }} \right)} \right]. \end{array}
\end{equation}$$
$$\begin{equation}
\begin{array}{@{}l@{}} L = \mathop \prod \limits_{{y_i} = 1} {\rm{\Phi }}\left( {\frac{{\ln 100 - \beta {x_i}}}{\sigma }} \right)\mathop \prod \limits_{{y_i} = 2} \left[ {{\rm{\Phi }}\left( {\frac{{\ln 400 - \beta {x_i}}}{\sigma }} \right) - {\rm{\Phi }}\left( {\frac{{\ln 100 - \beta {x_i}}}{\sigma }} \right)} \right] \ \mathop \prod \limits_{{y_i} = 2} \left[ {{\rm{\Phi }}\left( {\frac{{\ln 700 - \beta {x_i}}}{\sigma }} \right)} \right. \\ \qquad -\,\left. {{\rm{\Phi }}\left( {\frac{{\ln 400 - \beta {x_i}}}{\sigma }} \right)} \right]\,\mathop \prod \limits_{{y_i} = 2} \left[ {{\rm{\Phi }}\left( {\frac{{\ln 1,000 - \beta {x_i}}}{\sigma }} \right)}\right.\\ \qquad -\, \left. {{\rm{\Phi }}\left( {\frac{{\ln 700 - \beta {x_i}}}{\sigma }} \right)} \right] \mathop \prod \limits_{{y_i} = 2} \left[ {1 - {\rm{\Phi }}\left( {\frac{{\ln 1,000 - \beta {x_i}}}{\sigma }} \right)} \right]. \end{array}
\end{equation}$$

Figure 3. Distribution of Farmers’ Willingness to Pay for Soil Testing Services, North Haiti Farm Survey 2016
The empirical models of equation (5) can be written as follows:
 $$\begin{equation}
\begin{array}{@{}l@{}} {\rm{WTP}} = {\beta _0} + {\beta _1}AGE + {\beta _2}GEND + {\beta _3}EDUC + {\beta _4}GROUP + {\beta _5}OWN\\
\quad \quad \quad +\, {\beta _6}COCOA + {\beta _7}BAN + {\beta _8}RICE + {\beta _9}FERT*RICE + {\beta _{10}}MARCH \\
\quad \quad \quad +\, {\beta _{11}}SLOPE + {\beta _{12}}\ HHSIZE + {\beta _{13}}CONTACT + {\beta _{14}}FARMSIZE \\
\quad \quad \quad +\, {\beta _{15}}EXP + {\beta _{16}}PARTST + {\beta _{17}}SOILT + {\beta _{18}}INCOME\\ \quad \quad \quad + {\beta _{19}}CREDI + {\beta _{20}}FERT + {\varepsilon _i}. \end{array}
\end{equation}$$
$$\begin{equation}
\begin{array}{@{}l@{}} {\rm{WTP}} = {\beta _0} + {\beta _1}AGE + {\beta _2}GEND + {\beta _3}EDUC + {\beta _4}GROUP + {\beta _5}OWN\\
\quad \quad \quad +\, {\beta _6}COCOA + {\beta _7}BAN + {\beta _8}RICE + {\beta _9}FERT*RICE + {\beta _{10}}MARCH \\
\quad \quad \quad +\, {\beta _{11}}SLOPE + {\beta _{12}}\ HHSIZE + {\beta _{13}}CONTACT + {\beta _{14}}FARMSIZE \\
\quad \quad \quad +\, {\beta _{15}}EXP + {\beta _{16}}PARTST + {\beta _{17}}SOILT + {\beta _{18}}INCOME\\ \quad \quad \quad + {\beta _{19}}CREDI + {\beta _{20}}FERT + {\varepsilon _i}. \end{array}
\end{equation}$$
In the literature, several studies use the interval regression model to examine factors affecting the WTP for goods and services. Lofgren et al. (Reference Lofgren, Thanh, Chuc, Emmelin and Lindholm2008) applied interval regression to measure people's WTP for health insurance in rural Vietnam. The interval regression has been useful to solve the problems of zero answers, skewness, outliers, and the heaping effect present in their data set. Yang et al. (Reference Yang, Hu, Mupandawana and Liu2012) also employed interval regression to analyze consumer WTP for fair trade coffee in China. More recently, the interval regression served as a method of analysis for cotton farmers’ WTP for pest management services in northern Benin by Kpade et al. (Reference Kpade, Mensah, Fok and Ndjeunga2016).
Explanatory variables included in our model are presented in Table 1. Several studies have discussed the factors influencing farmers’ WTP for technologies (Basarir, Sayili, and Muhammad, Reference Basarir, Sayili and Muhammad2009; Hudson and Hite, Reference Hudson and Hite2003; Hite, Hudson, and Intarapapong, Reference Hite, Hudson and Intarapapong2002; Kenkel and Norris, Reference Kenkel and Norris1995; Lillo et al., Reference Lillo, Acuña, Vásquez, Mena and Rodríguez2014). These factors include age of the farmer, gender, farm size, educational level, income, group membership, access to credit, experience in agriculture, and contact with extension services.
Table 1. Explanatory Variables

a Types: C, continuous; I, indicator; O, ordinal.
Source: Survey, Auburn University, 2016.
5. Results and Discussion
5.1. Sociodemographic Characteristics of Farmers
Table 2 shows farmers’ sociodemographic characteristics. Out of 452 respondents, 81.86% were male and 18.14% were females with an average age of 47 years. Interviewees had an average of 6 years of schooling, 60.18% had up to primary-level education, 18.80% had up to secondary-level education, 2.22% had up to tertiary-level education, and 18.80% had not attended school before. The average household size was 6.
Table 2. Farmers’ Socioeconomic Characteristics and Agricultural Resources
Source: Survey, Auburn University, 2016.
Access to agricultural resources is fundamental for increasing agricultural productivity. We evaluate farmers’ access to agricultural resources by gathering information on land tenure, fertilizer use, access to credit, group membership, farm size, and contact with extension services. About 76% of farmers surveyed owned their land. These results are similar to those of the baseline survey conducted by the AVANSE M&E (Monitoring and Evaluation) team in 2014. As mentioned in several studies (Ghei, Reference Ghei2009; Kokoye et al., Reference Kokoye, Tovignan, Yabi and Yegbemey2013; Yegbemey et al., Reference Yegbemey, Yabi, Heubach, Bauer and Nuppenau2014), secure property rights could be used as an incentive in investing in agriculture.
About two-thirds of Haiti is mountainous. However, in the study only 7% of the lands cultivated by famers in our samples were located on hillsides. Fertilizers remain an important input in agriculture. In Haiti, the intensity of fertilizer use is low, given reasons such as lack of supply, financial means, and lack of knowledge on soil components and nutrients. Among the farmers surveyed, about 37% apply fertilizers. The majority are rice farmers (95%) as shown in Figure 4. It is common practice in the study area to apply fertilizers on rice. This practice is being reinforced with the intervention of the AVANSE project that facilitates access to fertilizers through its voucher program. The voucher program subsidizes 60% of the fertilizer cost to farmers. Access to credit is quite limited in northern Haiti as mentioned by several studies (Development Alternatives Incorporated, 2014; Molnar et al., Reference Molnar, Kokoye, Jolly, Shannon and Huluka2015). In our study area, only 17.92% of farmers have access to credit to finance their farming activities.

Figure 4. Fertilizer and Compost Utilization, Northern Haiti Farm Survey, 2016
Group membership helps farmers to share information on agriculture and/or other activities they practice. About 56% of farmers belong to a farmers’ group or association that handles issues regarding agriculture. Contact with institutions or extension services are also key resources for agricultural development education. We found that 60% of farmers have contact with at least one institution or extension service. Nearly 47.7% of farmers have access to market for inputs and to sell their products. The average farm size is 1.03 hectares per household. Farmers have an average of 14 years of experience in agriculture.
Soil texture refers to the percent by weight of sand (particles between 0.05 and 2.0 mm), silt (0.002–0.05 mm), and clay (<0.002 mm) in a soil sample. It indicates how easily a soil can be cultivated. Soils high in sand are easier to cultivate and are termed light, whereas soils that are difficult to cultivate and high in clay are called heavy. Soil texture also affects nutrient holding capacity, with clay soils having more surface area on which to retain plant nutrients. As shown in the Table 2, 13% of farmers believed that their soil texture was sandy; 46%, clay; 40%, sandy and clay; and 1%, soil with relatively high percent of gravel.
Looking at the distribution of farmers by categories of income; most of the farmers (48%) earn more than 6,000 HTG (1 USD = 62 HTG) a year.
5.2. Factors Affecting Farmers’ Willingness to Pay for Soil Testing Services
5.2.1. Farmers’ Willingness to Pay for Soil Testing Services
We obtained information on farmers’ WTP by asking how much they were willing to pay for soil testing services if these services were available to them. The results show that farmers are willing to pay an average of 503 HTG, an equivalent of 7 USD per test for the soil testing services throughout the regions. This value is less than the average amount (10 USD) charged by the Oklahoma Cooperative Extension Service's Soil, Water and Forage Analytical Laboratory for routine pH analysis and lime recommendation (Sikora Buffer), NO3-N, and soil test P and K by Mehlich 3. Table 3 shows the WTP for soil testing services in different regions. This value varies from the northeast region to the north region.
Table 3. Farmers’ Willingness to Pay for Soil Testing, North Haiti Farm Survey 2016
Source: Survey, Auburn University, 2016.
5.2.2. Estimation Results from Interval Regression
We estimate the interval model to determine the factors affecting farmers’ WTP for soil testing services. The results shown in Table 4 reveal that the farmers’ educational level, whether they have access to credit, their gender, their belonging to a farmers’ group, whether they have contact with extension services or any institution, whether their soils are sandy and clays, their income level, whether they grow rice or banana and rice, if they participate in the AVANSE soil testing program, and their farm size are strong predictors of farmers’ WTP.
Table 4. Interval Regression Model of Farmers’ Willingness to Pay for Soil Testing in Northern Haiti
Note: Significant at *P < 0.10, **P < 0.05, ***P < 0.01. LR, likelihood ratio.
Source: Authors’ estimations.
Farmers’ educational level is positive and statistically significant at the 5% significance level. Farmers who have been to school are willing to pay a positive amount for acquiring information on their soils.
Access to credit is significant and positive. This means farmers who have access to credit offer more for the soil testing services. This result is consistent with several studies related to willingness to pay for or adopt novel agricultural inputs (Omondi, Mbogoh, and Munei, Reference Omondi, Mbogoh and Munei2014; Yegbemey et al., Reference Yegbemey, Yabi, Heubach, Bauer and Nuppenau2014).
Male farmers show higher WTP compared with their female counterparts. Agriculture in Haiti is dominated by male heads of households, and our sample is composed of about 82% men. Several studies have shown that males have a higher WTP for technologies compared with females (Liu and Zhang, Reference Liu and Zhang2011; Yegbemey et al., Reference Yegbemey, Yabi, Heubach, Bauer and Nuppenau2014). This is often justified by the fact that males in most of the developing world have greater access to resources than females.
Farmers who belong to a group are willing to pay less than those who do not. This result contradicts the general opinion according to which group membership is expected to assist farmers to acquire information on technologies and novel inputs (Tiamiyu, Akintola, and Rahji, Reference Tiamiyu, Akintola and Rahji2009). Given that soil testing services are not well developed in the region, group membership might create a dependence and readiness to expect a subsidy for soil testing. This might explain farmers’ behavior in this model.
Farmers who have contact with agricultural extension services or any other institutions are willing to pay more than those who do not. The role of extension services is to provide information on agricultural technologies and practices to farmers. It helps farmers to increase their production or living conditions. Arinloye et al. (Reference Arinloye, Linnemann, Hazelaar, Omta, Coulibaly, van Boekel, Bijman and Bitzer2016) indicated that contact with extension services is a positive factor in pineapple farmers’ WTP for market information received by mobile phone in Benin. Fadare, Akerele, and Toritseju (Reference Fadare, Akerele and Toritseju2014) and Yu et al. (Reference Yu, Nin-Pratt, Funes and Gemessa2011) also found a positive relationship between access to extension services and the adoption of agricultural technology. In the context of Haiti, we would not argue that extension services provide farmers with information on soil testing services because extension institutions do not provide training on soil testing. However, farmers who have contact with extension services or any other institutions are already exposed to various kinds of knowledge on agriculture, which confers to them the ability to comprehend the benefit of soil testing services and being willing to pay more.
Farmers whose soils are sandy and clay are willing to pay less than those whose soils are not. Soil texture generally affects the root zones, which determine the above-ground plant growth production, and is determined by the proportion of sand, silt, and clay present in the soils. Sandy clay soils seem to improve soil quality. According experiments done by Ismail and Ozawa (Reference Ismail and Ozawa2007), the yields of the crops were increased by 2.5 compared with the control treatment. Therefore, we might conclude that farmers whose soils are sandy clays might not value soil testing as much as those whose soils are not.
The type of household, based on the crops or the combination of crops grown, is also a determinant of farmers’ WTP for soil testing services. Farmers who grow only rice are willing to pay more than those who do not. As shown in Figure 5, rice farmers are willing to pay 591 HTG compared with banana and cocoa farmers who are willing to pay 491 HTG and 348 HTG, respectively. Similarly, farmers who grow rice and bananas are willing to pay more. One of the main benefits we discussed with farmers is the ability of the soil testing services to provide information on appropriate fertilizer use.

Figure 5. Willingness to Pay (WTP) by Crop, Northern Haiti Farm Survey, 2016
In the case of Haiti, this information is nonexistent, and farmers apply fertilizer randomly without standard soil fertilizer requirements. Therefore, given that rice farmers apply fertilizers to their fields, they might be interested to know about the fertilizer requirements for their crops.
About 37% of farmers in our data set apply chemical fertilizers. However, among them, 95% of rice farmers use chemical fertilizer (Figure 4).
According to our results, farmers who earn income of 2,001–4,000 HTG (category 2) and more than 6,000 HTG (category 4) are willing to pay a significant and positive amount of money. However, farmers who earn more than 6,000 HTG are willing to pay more for soil testing than others. This is understandable as cash is needed to pay the cost of the services. These results suggest that there is an income effect on the decision about the amount of money farmers are willing to pay. In order to cross check this result, we use box plots and run the Kruskal-Wallis test. Figure 6 shows the side-by-side box plot of farmers’ WTP by income categories. These plots reveal that the average WTP varied across income category. Farmers with high income of more than 6,000 gourdes are willing to pay the highest amount (586 HTG). The Kruskal-Wallis test showed that there is a statistically significant difference in the WTP between the four categories of income group, χ2 = 6.8, P < 0.0006. Therefore, income has a positive impact on the amount of money farmers are willing to pay for soil testing services. This result is consistent with that of Ulimwengu and Sanyal (Reference Ulimwengu and Sanyal2011) who found that the income of a farmer influences the willingness of the farmer to pay for agricultural services. This result suggests that farmers with limited resources will not be able to afford the cost of soil testing services.

Figure 6. Willingness to Pay and Farmers’ Income, Northern Haiti Farm Survey, 2016
As the farm size increase, farmers are willing to pay more for the soil testing services. This result suggests two explanations. First, farmers with large farms have more income or financial power to afford soil testing services. Second, they might be willing to pay more in order to know the status of their soils for efficient production. Positive relation between farm size and the adoption of agricultural technologies has been demonstrated in the following studies: Liu and Zhang (Reference Liu and Zhang2011) found that farm size has a statistically significant positive relationship with the willingness to adopt soil testing technology, and Adrian, Norwood, and Mask (Reference Adrian, Norwood and Mask2005) also found that farm size influences the willingness to adopt and pay for agricultural technologies.
Farmers who participated in the soil testing program by AVANSE/USAID offer more, which might result from the tangible results they got from the experience of providing their soil sample.
6. Conclusions
Increasing agricultural productivity in Haiti requires innovative tools to help farmers achieve their goals. Soil testing appears to be one tool that can provide farmers with necessary information to increase the yields of their crops. In prelude to the installation of a soil testing laboratory in northern Haiti, we researched factors that affect farmers’ WTP for soil testing services in northern Haiti. By taking into account zero answers, skewness, outliers, and the heaping effect of the data, we used an interval regression model. This model revealed that various factors affect the amount to be paid for soil testing services. These factors include farmers’ educational level, access to credit, gender, belonging to a farmer’ group, whether they have contact with extension services or any institution, whether their soils are sandy or clay, income level, whether they grow rice or banana and rice, if they participate in the AVANSE soil testing program, and farm size. In the design of the WTP questions, we proposed prices in a descending order. This strategy might lead to bias estimates and high average WTP and constitutes a limitation of this study. However, the results of the study provide the following policies that can be used to inform decision makers on farmers’ WTP.
7. Policy Implications
The study provides information on the existing potential for the establishment of a laboratory in northern Haiti. However, the sustainability of this laboratory will depend on various factors identified in this study. The first seemly important and significant factor across models is income or financial means. A price payment schedule for the soil testing should be designed in such way that farmers are able to afford it, given that the study reveals high-income farmers or those with access to financial resources are willing and able to pay more for the soil testing services. Male farmers are also willing to pay more because they have access to more resources than their female counterparts. Another way to help farmers is to provide a subsidy to support the pricing policy that will be put in place or to provide credit access to farmers. NGOs might also provide support to their farmers by helping them to pay for soil testing analysis.
One major issue to be solved before designing any pricing policy is to inform farmers about the importance of soil testing service for increasing their yields. The investigation suggests that farmers are not well informed or educated on soil testing benefits. We propose that the laboratory include an extension component that will help farmers to better apprehend the usefulness of the soil testing services and the interpretation of the results. In addition, NGOs and development projects working with farmers should include a training module to explain soil testing benefits to farmers to raise awareness.


 Open access