


1. Introduction
The agricultural sector in the Democratic Republic of the Congo (DRC) is still struggling to cope with postindependence political and structural instability. Agricultural output fell between 1970 and 1980 because of Zaïrianisation, a policy implemented by President Mobutu’s government that nationalized all private companies, including those in the agricultural sector. Agricultural output and food security continued to decline with an economic crisis in the 1990s when the DRC faced what Akitoby and Cinyabuguma (Reference Akitoby and Cinyabuguma2004, p. 7) call “the grip of an unprecedented circle of hyperinflation, currency depreciation, increasing dollarization and financial disintermediation, declining savings, deteriorating economic infrastructure, and broad-based output decline.” The war between 1996 and 2006 compounded the economic collapse (Smoes, Reference Smoes2012; Tollens, Reference Tollens2004).
In the DRC, like in most low-income countries, agriculture is one of the primary sources of employment and revenue. Improving agriculture, the backbone of most African economies, can be the catalyst for poverty reduction and can improve livelihoods across the entire continent (Gates and Gates, Reference Gates and Gates2015). For the DRC specifically, improving agricultural productivity and incomes also has the potential of reducing the vulnerability of the poorest of the poor. Vulnerable youth in the DRC have historically been predisposed to join armed groups or to leave villages for illegal mining opportunities, which mutually fuel civil conflicts keeping the country in the poverty cycle. Herderschee, Kaiser, and Samba (Reference Herderschee, Kaiser and Samba2012) state that improving agricultural productivity is one of the best ways to combat the DRC’s extreme poverty. Given the high incidence of food insecurity and the fact that increased agricultural productivity has the potential to reduce poverty, the government of the DRC has begun to focus on investing in the agricultural sector.
DRC citizens and the agricultural community are still recovering from an almost 20-year conflict that brought violence, insecurity, displacement, political upheaval (Famine Early Warning Systems Network [FEWS NET], 2015), and increased poverty and food insecurity throughout the country. Perhaps no group is more affected than women, who are the backbone of the DRC’s agricultural sector. This is partially because slash-and-burn agricultural practices destroy forests, requiring women to venture farther from home to cultivate land. The additional travel, a direct consequence of slash-and-burn, exposes women to increased risk including sexual assault as they have to travel farther from home for agricultural production. Thus, empowering farmers to increase productivity by educating them to use conservation agriculture (CA), a more sustainable alternative to slash-and-burn, could contribute to reducing female vulnerability, alleviate food insecurity, and fight poverty while being ecologically sustainable.
Moreover, educating women, specifically, in CA could help reduce some burdens that years of civil unrest has caused for women in the agricultural communities of the DRC. First, it would allow for the reduction of labor, in that women would not have the arduous task of plowing or clearing the field (slash-and-burn) to plant new crops. Second, by staying closer to their homes and not having to travel to find virgin forests to clear, CA could reduce the chance that a woman would encounter physical and/or sexual violence. Rebuilding the agricultural sector in the DRC will be complicated and time consuming but must be holistic in nature to ensure a sustainable (environmental, social, and economic) future. Because of women’s key role in the agriculture sector, programs that educate women in CA practices in the DRC have the ability to make positive social, ecological, and economic changes.
In the DRC’s National Agriculture Investment Plan under the Comprehensive Africa Agriculture Development Programme, officially known under the French acronym PNIA, the government of the DRC committed, in 2013, to focus on the enhancement of agricultural productivity in a sustainable manner, taking into consideration the environmental stress from slash-and-burn agriculture and the pivotal role women play in productive agriculture (Ministère de l’Agriculture et du Développement Rural, 2013). According to Kassam, Mkomwa, and Friedrich (Reference Kassam, Mkomwa and Friedrich2017), “CA is defined as a management system based on three interlinked principles which are applied in a mutually reinforcing manner: (i) continuous no or minimum physical soil mechanic disturbance (ii) maintenance of permanent soil mulch cover, and (iii) crop diversification in space and time”
As an innovative farming practice, CA was introduced in the DRC and piloted in 2009 in the Maniema province (Fig. 1) by Catholic Relief Services (CRS) and its partners through a $2–million Howard G. Buffet Foundation–funded program named “Kulima Pasipo Kutipula Udongo: Improving Agricultural Productivity through No-Tillage Agriculture in Maniema Province,” also known as the “NTA project.” CA was promoted by the NTA project as a potential solution to the issue of slash-and-burn agriculture and its negative externalities on women farmers and the ecosystem throughout central and eastern DRC. First, the reduction of slash-and-burn can reduce the agricultural work burden on women, as they do not have to travel continuously farther distances to cultivate fertile land. Second, reducing the distance women have to travel to farm also reduces their chances of being put in vulnerable situations, which are a by-product of the ongoing conflicts in central and eastern DRC. In a holistic sense, CA can be viewed as a viable concept for sustainable agriculture because of its potential comprehensive benefits in economic, environmental, and social aspects of sustainability (Derpsch, Reference Derpsch2007).
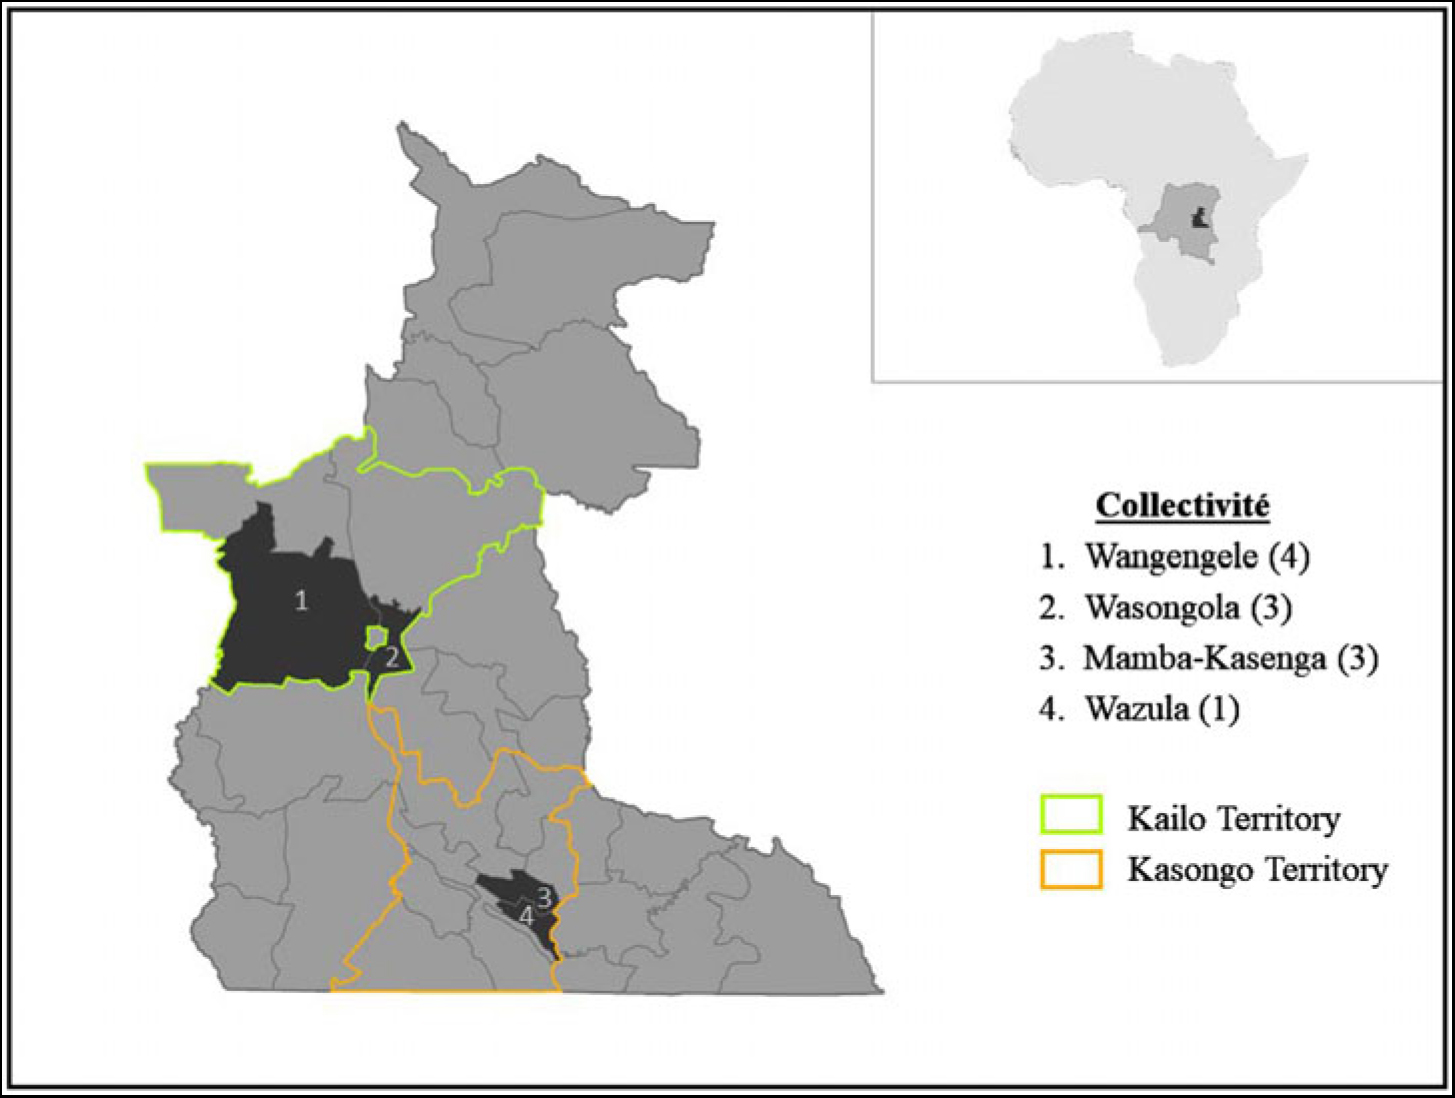
Figure 1. Study area of Maniema province, Democratic Republic of the Congo, used in analysis.
The economic benefits of CA are valued in terms of farmers’ time and labor saved as compared with traditional slash-and-burn practices common in the DRC (CRS, 2012, 2015). CRS (2015) found that farmers who adopted CA in Maniema spent 50% less time weeding their plots compared with nonadopters. The reduction of weeding is a direct result of fewer weeds attributed to a thick layer of mulch covering the ground (a practice encouraged in CA in the DRC). Another economic benefit is the potential of enhanced yields (Conservation Agriculture Group at Cornell University, 2015; Lalani et al., Reference Lalani, Dorward and Holloway2017). According to the Food and Agriculture Organization of the United Nations (FAO, 2019), the agronomic benefits of CA are mainly soil structure improvement and an increase in organic matter, which ultimately result in more fertile land. As a result, water and nutrients are used more efficiently and can potentially preserve the soil while also increasing farm production (FAO, 2019). Increased fertility with organic matter can both increase revenue (through higher yields) and decrease costs (reducing the need for inorganic fertilizer). The environmental benefits, mostly resulting from mulching and the reduction of deforestation attributed to slash-and-burn, are soil protection against erosion and carbon sequestration, which makes CA a candidate for climate-smart agriculture (Mkomwa et al., Reference Mkomwa, Kassam, Friedrich, Shula, Kassam, Mkomwa and Friedrich2017).
This study used primary data collected in 2015 by CRS for the ex post evaluation study of the NTA project. The objective of this study was first to estimate the factors that drove adoption of CA in the DRC via the NTA project. Additionally, this study set out to explore how female adoption compared with male adoption rates, given that the project was targeted at vulnerable female farmers (household heads who were widows, single women, or separated/divorced because of consequences of DRC conflicts and poverty). Further, this research illustrates what, if any, benefits farmers derived through the adoption of the CA practices.
Because human capital can be transferred, the research also aimed to estimate the perceived benefits to producers who may have adopted CA but did not receive formal training from CRS and to compare those with the perceived benefits of farmers who actually received formal training—that is, to capture if there were any spillover effects of the formal training. The study is the first of its kind for the DRC because CRS has been the pioneer of CA in the country. Its relevance for agricultural research and development goes from policy design to implementation, takes into consideration the key role of gender within DRC agriculture, and fits in the current themes of sustainability and climate change. In a poor, postconflict country continuing to struggle with food insecurity and malnutrition such as the DRC, this study provides important information to policy makers, nongovernmental organizations (NGOs), and conservationists about why people adopt CA and what the perceived benefits are for those who do.
2. Literature review
A considerable amount of literature has been published on CA all over the world. The literature discussed subsequently focuses on studies conducted in Africa on factors driving adoption of CA, presents the benefits of adopting this practice, and sketches its adoption theory for the DRC. On the other hand, it was necessary at this step to start by providing peripheral information on the particular context of the DRC. With that in mind, this section first outlines the relationships between the DRC agriculture sector and its political disturbance, the specific role of women, and the slash-and-burn practice, respectively.
2.1. Political conflict in the DRC
The poverty level in the DRC has been exacerbated by 10 years of civil discord. From 1996 to 2006, the country faced what Reyntjens (Reference Reyntjens2009) calls “the Great African War,” which both directly and indirectly involved 13 African nations, national and foreign militias, and rebel groups. The U.S. Agency for International Development (USAID) determined that more than 17 years of conflict in the eastern DRC, an area including the provinces of Maniema and South and North Kivu, and the former provinces of Katanga and Orientale, has led to the depletion of much of the area’s resources and thwarted the country’s development plan (USAID, 2014). Otchia (Reference Otchia2014) asserted that the agriculture sector in the DRC suffers from a lack of “development strategies,” combined with the consequences of conflict, which has led to widespread food insecurity in many parts of the country.
Throughout all the civil conflicts and political instability since 1996, there has been one constant in the DRC: food insecurity. Tollens (Reference Tollens2003) claimed that food insecurity in the DRC is the consequence of poverty brought on by civil conflict. From 1961 to 2000, the DRC experienced a decrease of 34% in daily caloric intake and 37% in daily protein intake (Tollens, Reference Tollens2003). The decreases in caloric and protein consumption are a consequence of civil and political unrest as well as a lack of investment in agricultural productivity enhancements. Compounding matters, since the early 2000s, the DRC has had one of the world’s highest internal displacement rates because of the aforementioned civil conflicts (Akakpo, Randriamamonjy, and Ulimwengu, Reference Akakpo, Randriamamonjy and Ulimwengu2014; Norwegian Refugee Council and Internal Displacement Monitoring Centre, 2017). As of February 2018, it was estimated that approximately 4.6 million people were experiencing food insecurity, 2 million children were acutely malnourished, and 4.5 million people were internally displaced in the DRC (United Nations Office for the Coordination of Humanitarian Affairs, 2018), which is nearly 6% of the DRC population.
2.2. Women in the DRC agriculture sector
Women represent the largest sector of the agricultural workforce in the DRC; however, they are also some of the most vulnerable members (International Monetary Fund [IMF], 2013; USAID, 2014). Of all the participants in the agricultural community, the Ministère de l’Agriculture et du Développement Rural (2010) considers women as the most important contributors because of their primary roles in agricultural production and commitment to food security at both the household and community levels. In 2014, the DRC’s Demographic Health Survey reported that agriculture is the primary occupation for 58% of all women in the DRC, with this percentage increasing to 66% for women between 45 and 49 years old who have more than five children (Ministère du Plan et Suivi de la Mise en OEuvre de la Révolution de la Modernité, Ministère de la Santé Publique, 2014). In rural areas, the same report found that 77% of women are involved in agriculture. The Ministère de l’Agriculture et du Développement Rural (2010) recognized that women are also among the first victims of the country’s long past of political and social instability. Herderschee, Kaiser, and Samba (Reference Herderschee, Kaiser and Samba2012) reported that women in the DRC were “disadvantaged relative to men,” a situation that was only intensified by civil conflicts, despite some recent progress to reduce that inequality. A 2014 report by the USAID found that women face many types of discrimination, exploitation, and exclusion in their communities throughout the DRC (USAID, 2014). Rural women in the DRC are exposed to higher levels of poverty and food insecurity and are more likely to fall victim to the DRC’s ongoing civil strife.
2.3. Slash-and-burn agriculture in the DRC
Agricultural productivity decreased by 60% in the DRC from 1960 to 2006 because of political instability and farmers abandoning production because of civil strife (IMF, 2013). The weakening of the agriculture extension system throughout the DRC impeded the dissemination of best management practices, leading to reduced agricultural productivity, decreased earnings, and increased food insecurity (World Bank, 2013). Slash-and-burn agriculture, a common farming practice in the DRC that consists of slashing the vegetation and burning its residues to create new fertile farmland, is still widely implemented in the DRC today. Many farmers in sub-Saharan Africa, even those who do not practice slash-and-burn, choose to feed crop residue to livestock rather than leave it in the fields, thus hampering soil fertility. Slash-and-burn has detrimental effects on land, accentuates deforestation (United Nations Environment Programme, 2011), and also contributes to the degradation of aquatic ecosystems and biodiversity (Programme Management Unit, National Institute of Agricultural Extension Management, 2016). A 2009 CRS study found that in the province of Maniema, slash-and-burn agriculture makes women more vulnerable to sexual assault, as it continuously forces them to walk farther from their village to the farm, which increases their workloads and inherently exposes them to an increased possibility of rape. Almost 3.5 million women have been raped or experienced partner sexual violence between 2000 and 2010 in the DRC (Peterman, Palermo, and Bredenkamp, Reference Peterman, Palermo and Bredenkamp2011).
2.4. Factors driving CA adoption
In their study, Wisdom et al. (Reference Wisdom, Chor, Hoagwood and Horwitz2014) compiled a meta-analysis of 20 theories of innovation adoption. The authors found that constructs of leadership, operational size and structure, innovation fit with norms and values, and attitudes/motivation toward innovations each were mentioned in at least half of the theories they analyzed, though there were no consistent definitions of measures for these constructs. They found that these theories confirmed that adoption is a process that moves from preadoption, in which staff within an organization become aware of an innovation and access information with which to make a decision, to established adoption, where the organization decides whether to proceed with and commit to the innovation (Frambach and Schillewaert, Reference Frambach and Schillewaert2002; Greenhalgh et al., Reference Greenhalgh, Robert, MacFarlane, Bate and Kyriakidou2004). They also found that theories of adoption were driven by mechanisms within the contexts of sociopolitical (gender, age, etc.) and external influences (financial incentives and accreditation standards), organizational characteristics (leadership support and social climate), innovation characteristics, staff/individual characteristics, and client characteristics (readiness and need for change). These theoretical drivers of innovation adoption were used in conjunction with empirical studies of CA adoption to help determine the causal effect of adoption CA in DRC.
Early empirical studies around agricultural innovations received the attention of scholars in developing countries because farmers in these countries rely on subsistence agriculture and most of these technologies aimed to improve yields and increase farmers’ revenue (Feder, Just, and Zilberman, Reference Feder, Just and Zilberman1985). Feder, Just, and Zilberman (Reference Feder, Just and Zilberman1985) also reported that, although adoption results were not uniform, innovations have been brought to farmers in developing countries through development projects that attempted to abate adoption constraints. In Malawi, South Africa, eSwatini, Tanzania, and Zimbabwe, CA was introduced and promoted between 1998 and 2008 by national governments, research centers, and NGOs to enhance smallholder farmers’ crop productivity in response to drought and soil erosion (Chisenga, Reference Chisenga2015; Gilbert, Reference Gilbert2013; Kassam et al., Reference Kassam, Friedrich, Shaxson and Pretty2009; Mavunganidze et al., Reference Mavunganidze, Madakadze, Mutenje and Nyamangara2013; Mlenga and Maseko, Reference Mlenga and Maseko2015; Ntshangase, Muroyiwa, and Sibanda, Reference Ntshangase, Muroyiwa and Sibanda2018). Feder, Just, and Zilberman (Reference Feder, Just and Zilberman1985) identified and compared techniques used in existing CA adoption studies. For example, some adoption studies, like those using chi-square contingency tables, failed to raise the quantitative importance of explanatory forces; others used correlations analysis that produced only qualitative information about explanatory factors; and still others (like ordinary least squares regression) limited their scope on decision of adoption and forgot its intensity. Thus, exploring adoption as a dichotomous dependent variable appears to be the most appropriate modeling technique. That being said, logit and probit models have been identified as the most robust methodological framework (Feder, Just, and Zilberman, Reference Feder, Just and Zilberman1985; Feder and Umali, Reference Feder and Umali1993).
In the 1980s, investigations around the adoption of agricultural technologies, especially soil conservation practices such as CA, seemed to agree that farm size, education, financial wealth, and, in certain ways, age and risk perception drive adoption decisions (Ervin and Ervin, Reference Ervin and Ervin1982; Feder, Just, and Zilberman, Reference Feder, Just and Zilberman1985; Nowak, Reference Nowak1987). Table 1 illustrates a summary of some of the previous literature on the drivers of theoretical/emperical adoption of innovation/CA. Knowler and Bradshaw (Reference Knowler and Bradshaw2007) grouped the factors driving CA adoption into four categories: farmer and farm household characteristics, farm biophysical characteristics, farm financial/management characteristics, and other exogenous factors. There are specific factors related to the farm, farmer, technology, and institutions that play a role in the adoption of soil conservation practices (Liu and Huang, Reference Liu and Huang2013). Many studies have found that the drivers of adoption are specific to each country/region/village and need to be analyzed as such (Corbeels et al., Reference Corbeels, de Graaff, Ndah, Penot, Baudron, Naudin and Andrieu2014; Knowler and Bradshaw, Reference Knowler and Bradshaw2007; Parvan, Reference Parvan2011; Thierfelder, Bunderson, and Mupangwa, Reference Thierfelder, Bunderson and Mupangwa2015).
Table 1. Summary of literature on the theoretical and empirical drivers of conservation agriculture (CA) adoption

2.5. Benefits of CA
The literature is rich with studies that find the benefits of CA are not instantaneous and demonstrate that CA is a response to climate change and farmers’ vulnerability, CA reduces GHG emissions, and CA provides better ecosystem functioning and services (Derpsch et al., Reference Derpsch, Friedrich, Kassam and Hongwen2010; Kassam et al., Reference Kassam, Friedrich, Shaxson and Pretty2009). The potential benefits of CA would be particularly important for regions affected by drought throughout Africa, as CA has the potential to hold subsurface moisture more efficiently (Palm et al., Reference Palm, Blanco-Canqui, DeClerck, Gatere and Grace2014). CA meets smallholder farmers’ need to spend less time on agricultural production (per unit of land), because it reduces intensive tasks such as tillage and weeding, and, as a result, more time is available to diversify their livelihoods (Friedrich and Kienzle, Reference Friedrich and Kienzle2008).
Focusing on the impact of CA on food security, Mango, Siziba, and Makate (Reference Mango, Siziba and Makate2017) demonstrated that CA did not change the food consumption score in Zimbabwe and Malawi but significantly improved the food consumption score in Mozambique. In Brazil, an FAO study that considered CA an improved cropland management technology reported an increase in average productivity and farm net income for maize, beans, bananas, and cassava in 2010 because of CA (Branca et al., Reference Branca, McCarthy, Lipper and Jolejole2011). A study in Mozambique found that CA provided better crop returns to smallholder farmers, especially the poorest, when intercropping was also integrated (Lalani, Dorward, and Holloway, Reference Lalani, Dorward and Holloway2017). Numerous studies comparing conventional tillage with CA in South Africa showed better maize yields under CA (Sithole, Magwaza, and Mafongoya, Reference Sithole, Magwaza and Mafongoya2016). Although the literature is rich with examples of CA advantages, nothing is reported on how CA could affect producers in the DRC. As such, the following sections will describe CA training provided in DRC and the subsequent drivers of adoption and perceived impacts of CA.
3. Research site and data
3.1. Maniema province
The research study took place in Kailo and Kasongo territories in the Maniema province in the DRC, where seven and four villages, respectively, were sampled (Fig. 1 and Table 2). The province had a population of 1,682,451 people in 2014, where 70% of the population is rural, and 60% and 65% of the women and men are involved in agriculture, respectively (Ministère du Plan et Suivi de la Mise en OEuvre de la Révolution de la Modernité, Ministère de la Santé Publique, 2014; Omasombo et al., Reference Omasombo, Nsanda, Akilimali, Kabala, Tabu, Mpene and Laghmouch2011). The studied area was chosen by CRS within the NTA project’s area of implementation because it included heterogeneous agroecological regions (the forest and the savannah). This is important because the Maniema province has diverse growing conditions and, as such, could provide heterogeneous drivers of adoption of CA.
Table 2. Number of farmers interviewed per village in 2015 by the Catholic Relief Services (CRS)

Source: CRS (2015).
3.2. Research data
The data used for this study were collected in 2015 by CRS for an ex post evaluation study conducted 3 years after NTA project closure in 2012. CRS (2015) used a structured household survey questionnaire to interview farmers in Kailo and Kasongo territories, where the NTA project was implemented from 2009 to 2012. The project identified participants as being farmers meeting the following selection criteria: willingness to participate in the project; being identified as among the poorest 25% of the community in terms of land, assets, income, and socioeconomic opportunities; and cultivating effectively a piece of land. With these minimum criteria met, priority was given to female headed households. The household survey targeted both NTA project participants and nonparticipants. Based on a population size of 5,800 farmers who participated in the NTA project in the two targeted territories, CRS utilized a random stratified sampling method to select 225 households for the interviews (CRS, 2015). Table 2 presents the number of interviewees at the village level for the two territories.
4. Model specifications
A reasonable approach of exploring CA adoption and its perceived benefits would have been to highlight when a farmer adopted CA and for how many years CA was/has been implemented. Our data limitations preclude this line of inquiry. The research data from CRS show that adoption occurred before their 2015 field survey: it is almost certain the adoption decision happened during the implementation of the NTA project between 2009 and 2012. The observations on the farmer characteristics are those observed in 2015 (the time of data collection).
The sample size is 225, which does not yield enough observations to accurately identify the underlying distribution of the randomness in the parameters. That said, the subsample selection is valid for the purposes at hand. We use two general specifications for the adoption models (Table 3) and the perceived benefits models (Table 4). The first criterion is region (models 2–5 in Table 3 and models 9 and 10 in Table 4), and the second criterion is farmer-training status (models 6–8 in Table 3 and models 11 and 12 in Table 4). The agroecological characteristics vary between the two regions in the research area. In their seminal work on adoption of agricultural innovations, Feder and Umali (Reference Feder and Umali1993) presented “agroclimatic environment” as the most significant determinant of locations’ differences in adoption rates, and Fuglie and Kascak (Reference Fuglie and Kascak2001) found that heterogeneity of land quality affected the pattern of technology diffusion. A priori, identical reactions (coefficients) were not expected from given independent variables in both regions, and the results confirm this. Also, we would expect that being trained increases the probability of adopting as borne out by comparing adoption rates for trained and untrained farmers.
Table 3. Marginal effects of factors influencing conservation agriculture (CA) adoption

Notes: *** P < 0.001,** P < 0.01,* P < 0.05, ˙ P < 0.10. AIC, Akaike information criterion; MPR, McFadden pseudo-R 2.
Table 4. Marginal effects for perceived benefits of conservation agriculture (CA) adoption

Notes: *** P < 0.001, ** P < 0.01, * P < 0.05, ˙ P < 0.10. AIC, Akaike information criterion; MPR, McFadden pseudo-R 2.
4.1. Modeling CA adoption
In order to provide the rationale behind this study’s way of modeling CA adoption, this section provides a description of independent variables followed by logit models used.
4.1.1. Independent variables
For this study, a CA adopter was defined as a farmer living in the research area, who applied the three CA principles (no-tillage, crop rotation, and mulching), and whose farm was observed by the surveyor and determined to be in compliance with CA by CRS. The following drivers were hypothesized to explain CA adoption in the DRC.
Savannah is a dummy variable used to test for location (agroecological zone) effect of CA adoption in the DRC. This variable takes the value 1 for Kasongo territory, meaning the farm is located in the savannah, and 0 for farms in the Kailo territory (forest). Lee (Reference Lee2005, p. 1327) recommends a regional approach in promoting farming technologies such as CA because they are “location-specific” and address “niche-type constraints faced by farmers.” Palm et al. (Reference Palm, Blanco-Canqui, DeClerck, Gatere and Grace2014) also support Lee’s recommendation in a study showing the influence of CA on ecosystem services in sub-Saharan Africa and South Asia.
Farm size is continuous and accounts for the farmer’s total plot size. Studies have shown farm size influences CA adoption and can be positive, negative, or neutral (Knowler and Bradshaw, Reference Knowler and Bradshaw2007). In Lesotho, Malawi, and South Africa, for instance, it was found that farm size had a direct effect on CA adoption decision making (Bisangwa, Reference Bisangwa2013; Chisenga, Reference Chisenga2015; Ntshangase, Muroyiwa, and Sibanda, Reference Ntshangase, Muroyiwa and Sibanda2018). As statistical differences in farm sizes between adopters and nonadopters were reported, this study added farm size in a regression framework.
Age of the household head in years is a continuous (integer) variable and is hypothesized to affect CA adoption. In the DRC, where life expectancy is estimated to be about 60 (World Bank, 2019), 67.8% of the population is less than 25 years old (Ministère du Plan et Suivi de la Mise en OEuvre de la Révolution de la Modernité, Ministère de la Santé Publique, 2014). Ntshangase, Muroyiwa, and Sibanda (Reference Ntshangase, Muroyiwa and Sibanda2018) showed a positive influence of age on CA adoption in South Africa.
Household size is a continuous (integer) variable representing the household size: the total number of family members living in the farmer’s home. Household size might provide a demographic influence on CA adoption. The average household size in the DRC is 5.3 (Ministère du Plan et Suivi de la Mise en OEuvre de la Révolution de la Modernité, Ministère de la Santé Publique, 2014). Ntshangase, Muroyiwa, and Sibanda (Reference Ntshangase, Muroyiwa and Sibanda2018) found that in South Africa, household size influences CA adoption as larger households adopt more.
Training is a dummy variable used to isolate the influence of the complete CA training provided by the NTA project. This variable takes the value 1 for farmers trained in CA and 0 for untrained farmers. Lacking proper CA knowledge is reported among the barriers to CA adoption (Derpsch, Reference Derpsch2007; Giller et al., Reference Giller, Witter, Corbeels and Tittonell2009; Kassam et al., Reference Kassam, Friedrich, Shaxson and Pretty2009). In the agriculture sector, farmers mostly have access to knowledge through the extension service, which is not necessarily the case in the DRC, where nongovernment agriculture programs promoted CA. Like all volunteer opportunities, there is the possibility that CA training may have selection bias associated with it.
Literacy is a dummy variable that takes the value 1 for literate farmers and 0 for illiterate farmers. Farmers’ education may have a positive, negative, or neutral influence on CA adoption (Knowler and Bradshaw, Reference Knowler and Bradshaw2007). In this study, literacy is used as a proxy for education. In the DRC, 15% of women compared with 4% of men have no formal education (Ministère du Plan et Suivi de la Mise en OEuvre de la Révolution de la Modernité, Ministère de la Santé Publique, 2014). Studies have shown a positive influence of women’s education on food security (Penders and Staatz [2001], Smith and Haddad [2002], and Webb and Lapping [2002], as cited by Napoli, Reference Napoli2011).
Female nonmarried (vulnerable) is a dummy variable taking the value 1 for a female, nonmarried farmer, and 0 for any other farmer. This variable was defined to comply with the NTA project goal, to help vulnerable women, and also to cross-check this CRS targeting approach influence on CA adoption. Fifty-one percent of NTA project participants were women, and 30% were widows (CRS, 2015). According to CRS (2015), the “single women and widower” pointed to labor-saving as their key incentive to adopt CA. Female labor is important in central DRC as agriculture is the main activity for 6 out of 10 women in the Maniema province in the DRC (Ministère du Plan et Suivi de la Mise en OEuvre de la Révolution de la Modernité, Ministère de la Santé Publique, 2014).
Farmers’ group is a dummy variable taking the value 1 for farmers who are members of a farmers’ group and 0 for farmers not in a farmers’ group. In Malawi, membership in a farmers’ group has been reported as a driver of CA adoption (Chisenga, Reference Chisenga2015). Bisangwa (Reference Bisangwa2013) argues that CA has advantages that increase social capital through farmers’ groups, when listing his benefits of CA adoption in Lesotho. According to Silici (Reference Silici2009), social interactions within and between farmers groups increase farmers’ knowledge and access to innovative information and so affected CA adoption in Lesotho. In the DRC, where the government extension service has historically been underinvested in, the farmers’ group approach is considered an alternative.
Accessed credit is a dummy variable that takes the value 1 if the farmer had accessed credit and 0 for the farmers who had not accessed credit. An important delineation needs to be made between those who had access to credit and those who accessed credit. The data set used in this study only asked participants if they accessed credit and did not identify those who may have access to credit but were either turned down or did not apply for it. Access to credit is cited as a constraint and/or a determinant to CA adoption (Bisangwa, Reference Bisangwa2013; Chisenga, Reference Chisenga2015; Giller et al., Reference Giller, Witter, Corbeels and Tittonell2009, Reference Giller, Corbeels, Nyamangara, Triomphe, Affholder, Scopel and Tittonell2011; Ntshangase, Muroyiwa, and Sibanda, Reference Ntshangase, Muroyiwa and Sibanda2018; Thierfelder, Bunderson, and Mupangwa, Reference Thierfelder, Bunderson and Mupangwa2015).
4.1.2. Logit models
For this study, CA adoption is considered as the choice made by a farmer to apply all three components of CA technology (no-tillage, crop rotation, and mulching) simultaneously. The farmer “faces a pair of choices” and chooses one outcome—in this case, to adopt or not to adopt (Greene, Reference Greene2012). The dependent variable, adopt, is a binary response. A logit model was used to explore how independent variables affect the probability of CA adoption occurrence (Mlenga and Maseko, Reference Mlenga and Maseko2015). The probability for an individual farmer (i) adopting CA can be modeled as follows (Greene, Reference Greene2012):
 $$Prob{\mkern 1mu} (adop{t_i} = 1|{{\bf{x}}_i}) = {\rm{ }}{{e({{{\bf{x'}}}_i}\beta )} \over {1 + {\rm{ }}e({{{\bf{x'}}}_i}\beta )}} = F({{\bf{x'}}_i}{\mkern 1mu} \beta ),$$
where x i is a vector of the independent variables listed in Table 5, β is the parameter vector reflecting the changes in x i on the probability, and F is the logistic function taking on values strictly between 0 and 1. The marginal effects on the probability of adopting for changes in the independent variables are computed with the mfx package (Fernihough, Reference Fernihough2014) in RStudio (RStudio Team, 2016) using the formulas in Greene (Reference Greene2012) where the appropriate computation is applied to continuous independent variables and binary independent variables.
Table 5. Variables description and hypotheses

A variety of model specifications are estimated to establish the robustness of the findings. Four different versions (models 2–5 in Table 3) of the full-sample model are estimated. In addition, our a priori belief—backed up by empirical evidence shown subsequently—is that the parameter vector, β, is not constant across all observations. Consequently, models using samples that are subsets of the full sample are estimated. Such a sorting gives more precise insights into farmers’ behavior. These different perspectives looking at CA adoption lead to eight analytical models given subsequently.
The full-sample model (model 1 in Table 3) was specified to provide a baseline model without considering the regional context. In most of the eight models, the vector x i includes all variables except savannah and villages selected by the researchers, so that the most basic full-sample model can be written as
 $$Prob\left( {adop{t_i} = 1{\rm{|}}{{\bf{x}}_i}} \right) = F\left( {\matrix{
{{\beta _0} + {\beta _1}ag{e_i} + {\beta _2}household{\mkern 1mu} siz{e_i} + {\beta _3}farm{\mkern 1mu} siz{e_i}} \cr
{ + {\beta _4}trainin{g_i} + {\beta _5}literac{y_i} + {\beta _6}female\;nonmarrie{d_i}} \cr
{ + {\beta _7}farmersgrou{p_i} + {\beta _8}accessed{\mkern 1mu} credi{t_i}} \cr
} } \right).$$
$$Prob\left( {adop{t_i} = 1{\rm{|}}{{\bf{x}}_i}} \right) = F\left( {\matrix{
{{\beta _0} + {\beta _1}ag{e_i} + {\beta _2}household{\mkern 1mu} siz{e_i} + {\beta _3}farm{\mkern 1mu} siz{e_i}} \cr
{ + {\beta _4}trainin{g_i} + {\beta _5}literac{y_i} + {\beta _6}female\;nonmarrie{d_i}} \cr
{ + {\beta _7}farmersgrou{p_i} + {\beta _8}accessed{\mkern 1mu} credi{t_i}} \cr
} } \right).$$
The agroecological zone model (model 2 in Table 3) was specified to illustrate farmers’ behavior based on their agroecological zones (savannah or forest region) in the research area, where a farm is located in the savannah or in the forest. The vector xi in equation (1) here includes all variables in equation (2) plus a binary for zone (savannah), where the binary is 1 if the observation is from the savannah.
The village-level model (model 3 in Table 3) allows farmers’ behavior to vary by village-level differences. The selected villages are in four different collectivités, meaning four ethnic groups. This cultural-locational aspect may play a role in CA adoption. The vector x i in equation (1) here includes all variables of equation (2) with 10 additional binaries to designate the village where the observation was taken. Enombe-Brigade was the baseline village.
The savannah region model (model 4 in Table 3) was specified to model savannah farmers’ behavior. Only data collected in the savannah (Kasongo territory) are utilized in estimation. The forest region model (model 5 in Table 3) was specified to model forest farmers’ behavior. Only data collected in the forest (Kailo territory) are utilized in estimation.
The trained group model (model 6 in Table 3) was specified to model farmers’ behavior after being trained in CA by the NTA project. Model (6) is similar to (1) but uses a subset of the sample that includes only trained farmers. The untrained group model (model 7 in Table 3) was specified to model how untrained farmers behave. Model (7) uses the subset of observations of untrained farmers. The vector x i , as given in equation (1), excludes the variables female nonmarried and literacy in model (7). For untrained farmers, there is very little variability in the dependent variable adopt but also little variability in literacy and female nonmarried, indicating that, for this sample of untrained farmers, literacy and female nonmarried are not significantly related to CA adoption decisions.
The full-sample without training model (model 8 in Table 3) was specified as (1) but omits training. The purpose was to determine if the parameters of other variables change when CA training received from the NTA project is omitted. The focus is to show how farmers’ behavior on the entire research area is affected by training. Some variations would be expected in coefficient estimates from their counterparts in equation (2). So, this helps us understand the full effect of training both through its direct effect, β 4, and its indirect effect via the changes in the other coefficients without training in the model.
4.2. Modeling the perceived benefits of CA
Farmers were asked about their perceptions of CA benefits and the study objective to determine what forces affect these perceptions. The method employed is similar to econometric studies that explored agricultural technology adoption in West Africa. In Burkina Faso, Guinea, and Sierra Leone, Adesina and Zinnah (Reference Adesina and Zinnah1993) and Adesina and Baidu-Forson (Reference Adesina and Baidu-Forson1995) showed that the way farmers perceived improved varieties was an incentive to adopt them. Farmers’ perceptions are subjective, and, therefore, it is hard to explain how they are formed. Modeling the perceived benefits of CA for farmers in the province of Maniema is a practical attempt to learn and explain their individual behavior in this part of the DRC. From field experience, smallholder farmers do not accept or believe in an innovation until they have benefited from it or seen how it benefits their peers.
The following subsections frame the way this study modeled perceived benefits by describing the independent and dependent variables followed by the ordered logit models used.
4.2.1. Independent variables
The perceived benefits of CA were observed in 2015, three years after the completion of the NTA project in the research area. Adopt and savannah are the two targeted variables that explain the variation in farmers’ perceptions of the various benefits of CA. The purpose here is to quantify how perceptions vary as a result of whether farmers adopted CA and whether agroecological conditions operate alone or interact with CA adoption in explaining farmers’ behavior. According to CRS (2015), “improving food security, [an] increase in revenue, and payment of school fees” were the key incentives for CA adoption. The dependent variables in Section 4.2.2 were used to measure farmers’ perceptions of CA benefits.
4.2.2. Dependent variables
Reliability of income from CA is a response to the question, “Is the income that you have obtained from CA reliable?” The respondent was required to respond if he or she thought his or her income from CA was “not reliable at all,” “less reliable,” “somehow reliable,” or “very reliable” in relation to not using CA. This structure restricted and ordered the answer making reliability of income from CA an ordinally ranked variable. A study by Thierfelder, Bunderson, and Mupangwa (Reference Thierfelder, Bunderson and Mupangwa2015) in Southern Africa that explored CA and smallholder farmers’ perceptions showed that CA adoption led to an increase in farmers’ household income. The present study used farmers’ perceptions of income reliability to assess the benefit of adopting CA.
Land under CA is a response to the question, “Did the amount of land you farm under CA increase after the end of the NTA project?” The respondent was required to choose if the farmland under CA had “increased,” remained “static,” or “decreased.” This structure restricted and ordered the answer, making this variable ordinally ranked. Land under CA is described as the farmland on which CA is applied. It allows for an approximation of CA expansion on household farms from a smallholder farmers’ perspective. Ntshangase, Muroyiwa, and Sibanda (Reference Ntshangase, Muroyiwa and Sibanda2018) noted a decrease in farm size because of CA adoption. The present study aimed to check the perception of CA expansion in terms of increased land farmed.
Food security status is a response to the question, “What is your current (2015) food security status compared to your food security status in 2012?” The respondents were required to say if they thought their food security status has “decreased,” “stagnated,” or “improved.” This response structured results in an ordinally ranked variable. Thierfelder, Bunderson, and Mupangwa (Reference Thierfelder, Bunderson and Mupangwa2015) showed that CA adoption led to increases in farmers’ household food security. The present study also used farmers’ perceptions to assess the benefit of adopting CA on food security status.
4.2.3. Ordered logit models
To explain perception levels as a function of adoption and region, an ordered logit model is appropriate for the three dependent variables in Table 5. According to Greene (Reference Greene2012) with an ordered logit model someone “reveals the strength of [his/her] preference with respect to a single outcome.”
The probability for an individual farmer (i) to select alternative j in 1, 2, …, j – 1 can be modeled following Cameron and Trivedi (Reference Cameron and Trivedi2005):
 $$Prob{\rm{}}\left( {{y_i} = j{\rm{|}}{{\bf{x}}_i}} \right) = {\rm{}}Prob{\rm{}}\left( {{\alpha _{j - 1}}{\rm{}} < y_i^{\rm{*}}{\rm{}} \le {\rm{}}{\alpha _j}{\rm{}}} \right){\rm{}} = {\rm{}}F\left( {{\rm{}}{\alpha _j} - {\bf{x}}_i^{\rm{'}}\beta } \right) - F\left( {{\alpha _{j - 1}} - {\bf{x}}_i^{\rm{'}}\beta } \right){\rm{}}$$
where y represents one of the dependent variables (reliability of income from CA, land under CA, or food security status) and y
*, an index model with single latent variable, represents the starting point $\left( {{y_i}^* = {{\bf{x}}_i}\prime \beta + {u_i}} \right)$
. Given j alternatives for a particular y, the α
j
are the thresholds between alternatives, x
i
is a vector of regressors (adopt and savannah), and F is a logistic function. Marginal effects are computed in RStudio as given by the oglmx (Caroll, Reference Caroll2017) and erer (Sun, Reference Sun2016) packages, which accommodates the binary nature of adopt and savannah. Equation (3) was adapted to five models from three different perspectives (all research area, agroecological zones, and training status) to examine the effect of CA adoption on each of the dependent variables. The five analytical models are (1) the full-sample model (2) the savannah-region model (3) the forest-region model (4) the trained-farmers model, and (5) the untrained-farmers model.
$\left( {{y_i}^* = {{\bf{x}}_i}\prime \beta + {u_i}} \right)$
. Given j alternatives for a particular y, the α
j
are the thresholds between alternatives, x
i
is a vector of regressors (adopt and savannah), and F is a logistic function. Marginal effects are computed in RStudio as given by the oglmx (Caroll, Reference Caroll2017) and erer (Sun, Reference Sun2016) packages, which accommodates the binary nature of adopt and savannah. Equation (3) was adapted to five models from three different perspectives (all research area, agroecological zones, and training status) to examine the effect of CA adoption on each of the dependent variables. The five analytical models are (1) the full-sample model (2) the savannah-region model (3) the forest-region model (4) the trained-farmers model, and (5) the untrained-farmers model.
The full-sample model (model 9 in Table 4) estimates the influence of CA adoption and the agroecological context on the benefits perceived by farmers in terms of reliable income, CA farmland expansion, and food security at the household level for the entire pooled data set. Each of the dependent variables (reliability of income from CA, land under CA, and food security status) is regressed on adopt and savannah.
The savannah-region model (model 10 in Table 4) isolates the influence of CA adoption only in the savannah region on the benefits perceived by farmers in terms of reliable income, CA farmland expansion, and food security. Each dependent variable is regressed on adopt. The forest-region model (model 11 in Table 4) estimates the influence of CA adoption only in the forest region on the benefits perceived by farmers for the three dependent variables.
The trained-farmers model (model 12 in Table 4) illustrates the influence of CA adoption and the agroecological context on the benefits perceived by CA adopters for the three dependent variables. Each dependent variable is regressed on adopt and savannah using only observations from trained farmers. The untrained-farmers model (model 13 in Table 4) is identical to model (12) but uses observations solely from untrained farmers. This model estimates perceived benefits of CA adoption only for untrained farmers.
Table 5 summarizes the independent and dependent variables used for model specification and the hypothesized outcomes for each independent variable, based on previous literature.
5. Results and discussion
5.1. Summary of descriptive statistics
To better understand farmers’ characteristics, we computed descriptive statistics stratifying by CA adoption (indicating they applied CA on their farms when they were interviewed), CA training (indicating they were formally trained in CA practices by CRS’s NTA project), and the two main agroecological zones (savannah and forest regions), as displayed in Table 6. Grouping the data between CA adopters and nonadopters indicated statistically significant differences (P < 0.10) between farm size, household size, proportions of farmers trained, living in the savannah, female nonmarried, members of farmers’ groups, and those who had accessed credit (Table 6). Age and literacy of the household head for the two categories were found to be statistically the same. Between trained and untrained farmers, statistical differences were found between household size, farmers who adopted CA, proportion of the sample living in the savannah, proportion of the sample who were members of farmers’ groups, and proportion of the sample who had accessed credit. Farm size, age and literacy of the household head, and nonmarried female farmers were found to be statistically equivalent between subsamples. Between farmers living in villages located in the savannah and those living in the forest, statistical differences were noted for those who adopted CA, who were trained, who were literate, who were nonmarried females, and who had accessed credit.
Table 6. Farmers’ characteristics based on conservation agriculture (CA) adoption, training, and agroecological zones

a t-Test applied to assess differences.
b Chi-square test to assess differences.
Notes: Significance ** P < 0.01, * P < 0.05, * P < 0.10 for differences between adopters and nonadopters, trained and untrained farmers, and farmers living in forest and savannah.
5.2. CA adoption
The findings of this study on CA adoption are presented and discussed in the two following steps: a section summarizing models results and a section in which the effects seen on CA adoption from the factors in this research are interpreted.
5.2.1. Results of CA adoption modeling
There were two major drivers in the logit model that influence CA adoption: the effect of regional context (location) and the effect of CA training (farmer trained or untrained). First, the location effects on adoption were explored in the logit framework by segmenting the overall sample four different ways (models 2–5) in Table 3, which presents the marginal effects of each variable on the probability of adoption. Alternative specifications of the effect of CA training on CA adoption are addressed in models (6), (7), and (8) in Table 3. Our primary criterion for comparing models is the McFadden pseudo-R 2 (MPR) because sample sizes vary among some models, making comparisons by Akaike information criterion between models invalid for model pairs with an unequal number of observations.
The full-sample model (model 1) in Table 3 is the baseline model for CA adoption. Model (1) has an MPR of 0.459, which is clearly surpassed by models (2) and (3) (MPR 0.504 and 0.561) that include fixed effect(s) by region or village. For the purposes of policy recommendations, models (4) and (5) are to be preferred over model (1). A likelihood ratio test with model (1) as the null hypothesis is rejected (P < 0.018) in favor of models (4) and (5). This implies that the model coefficients vary across the two regions. Training clearly influences CA adoption positively in models (1) to (5) with coefficient P values less than 0.001 except for model (4) (P < 0.05). Models (6), (7), and (8) are clearly inferior to models (1) to (5) in MPR, emphasizing that training is a pivotal variable. Models (6) and (7), which do not include training, give the expected result that some variables are significant for the trained farmers’ model, but none are significant for untrained farmers. Because the collinearity problems necessitated not estimating the coefficients of female nonmarried and literacy for model (7), it was not possible to compute a likelihood ratio test. The lack of significance in model (7) is partially because of a small sample (n = 44) and low adoption rate (14%). We conclude training is a relevant independent variable, making models (4) and (5) superior to models (6), (7), and (8).
The agroecological zone model (model 2) adds the predictor savannah, which is positive and significant (P < 0.001). A farmer located in the savannah is 26.5% more likely to adopt CA than farmers located in the forest, ceteris paribus. This further implies that there are unobserved parameters (independent variables not included in the model) that make adoption more attractive in the savannah. Thus, as we see in models (4) and (5), the homogeneity between the regions is rejected.
Across all eight models, the coefficients of age, farm size, household size, and literacy are statistically insignificant at the 0.05 significance level. The insignificance of age is consistent with Knowler and Bradshaw (Reference Knowler and Bradshaw2007), who showed that in many cases the influence of age on CA adoption is typically insignificant regardless of the method of analysis used. Several studies (e.g., Knowler and Bradshaw, Reference Knowler and Bradshaw2007; Mavunganidze et al., Reference Mavunganidze, Madakadze, Mutenje and Nyamangara2013; Ntshangase, Muroyiwa, and Sibanda, Reference Ntshangase, Muroyiwa and Sibanda2018) find varying signs for farm size. Given that farm size is only marginally significant in one of the eight models, farm size appears not to be an important factor influencing CA adoption in the DRC. The insignificance of household size provides no support that smaller households may be more likely to adopt CA because CA is potentially labor saving. Instead of household size, Knowler and Bradshaw (Reference Knowler and Bradshaw2007) modeled “family labor” and found it positively influences CA adoption. Literacy is largely insignificant across all models, with only models (5) (6), and (8) marginally significant (P < 0.10). CRS (2015) also reported that “there was no significant association between CA adopters and the level of education.” In our study, the proportion of literate farmers in the forest is significantly (P < 0.10) higher than in the savannah, but farmers in the forest are less likely to adopt CA. Other opportunities provided in the forest region may have a positive relationship with farmers’ education.
The following discussion focuses on the effect of CA on variables statistically significant at P < 0.05 in at least one of the models. These are training, female nonmarried, farmers’ group, and accessed credit.
5.2.2. Factors influencing CA adoption
As shown in Table 3, training has a robust and statistically significant (P < 0.05) effect on CA adoption in all five models where it is included. A farmer who received CA training from the NTA project is 69% more likely to adopt CA if he/she lives in the forest, 52% in the savannah, and 75% at the village level. These findings are consistent with Bisangwa (Reference Bisangwa2013) and Ntshangase, Muroyiwa, and Sibanda (Reference Ntshangase, Muroyiwa and Sibanda2018), who demonstrated that CA training positively influenced CA adoption in Lesotho and South Africa, respectively. A similar result is also reported by Chisenga (Reference Chisenga2015), who claimed that, in Malawi, “access to farmer training on CA” had a positive influence on CA adoption. Note that not all CA adopters were trained, which practically suggests there must be many lessons learned from NTA project field experience about promotion and education about CA.
Female nonmarried is negatively related to CA adoption in all seven models where it is included. Among the four models where female nonmarried is significant at P < 0.05, its effect ranges from a 42-percentage-point decline in participation to a 35-percentage-point decline. The CRS targeting strategy in the implementation of the NTA project was to prioritize “female-headed households” (CRS, 2009), while giving particular attention to vulnerable women (widows, single-women, or separated/divorced because of consequences of DRC conflicts and poverty). Female nonmarried includes CRS-targeted vulnerable women farmers. In Maniema province, where 60% women are involved in agriculture as reported by the 2014 Demographic Health Survey, the vulnerability of women is a result of many issues, such as poverty, a weak health care system, low education, bad governance, and consequences of conflicts. While assessing gender roles within farmers’ communities in the NTA project targeted area, CRS (2009) highlighted two issues faced by women: the volume of work allocated to women on a daily basis and the weak involvement of women in decisions concerning the management of household resources. With all this in mind, the finding that female nonmarried farmers are less likely to adopt CA provides important information on how to possibly reprioritize a future approach to getting vulnerable women to adopt CA. The current approach was not effective (relative to getting vulnerable women to adopt), and as such, a new strategy differing by agroecological zone could be undertaken because female nonmarried is not significant in the savannah model.
As illustrated in Table 3, farmers’ group has a positive and statistically significant effect in six of eight models. It significantly (P < 0.01) affects CA adoption in the forest region (model 5) and the village-level perspective (model 3); however, it is not significant (P > 0.10) in the savannah model (model 4). A farmer in the forest model is 42% more likely to adopt CA if he/she is a member of a farmers’ group. For the entire research area, the same farmer is 36% more likely to adopt (models 1 and 3). Farmers’ group is similar to what Knowler and Bradshaw (Reference Knowler and Bradshaw2007) call membership in an organization, such as a producers’ organization, and is considered as an exogenous factor that positively influences CA adoption. Chisenga (Reference Chisenga2015) and Ntshangase, Muroyiwa, and Sibanda (Reference Ntshangase, Muroyiwa and Sibanda2018) found that farmers’ group increased CA adoption. Besides the social capital a farmers’ group brings to smallholder farmers’ communities, it is also a strong platform for learning and sharing information where extension service is low.
Accessed credit is significant in six of the eight models. It is significant (P < 0.10) in the forest region (model 5) and the village-level model (P < 0.01) (model 3), whereas it is not significant (P > 0.05) in the savannah model (model 4). Model (4) suggests savannah farmers may have better income opportunities that reduce the importance of accessing a credit line. From model (5), a farmer in the forest is 28% more likely to adopt CA if he/she has accessed credit, and the same farmer in the village model is 23% more likely to adopt. Ntshangase, Muroyiwa, and Sibanda (Reference Ntshangase, Muroyiwa and Sibanda2018) and Chisenga (Reference Chisenga2015) showed that limited access to credit reduced CA adoption by smallholder farmers in South Africa and Malawi, respectively, while Gilbert (Reference Gilbert2013) recommended improving access to credit, as it can contribute toward increasing the level of income that has a positive influence on CA adoption in Tanzania. CRS (2015) brought credit services into the research area with the Savings and Internal Lending Communities (SILC) approach between 2009 and 2012. SILC groups provided credit to smallholder farmers “to purchase farm supplies – seeds and tools – albeit in small proportions” (CRS, 2015). The results of this study suggest that improving financial options for low-income farmers could be a useful approach to support CA adoption in the DRC.
5.3. Benefits perceived by CA adopters
Farmers utilize the products of agricultural research, and their subjective preferences for characteristics of new agricultural technologies can affect their adoption decisions (Adesina and Baidu-Forson, Reference Adesina and Baidu-Forson1995). For the smallholder farmers in the Maniema province, CA is a new practice in their milieu. The first part of this research explored various factors influencing CA adoption. This second part of the study estimated the perceived benefits of adopting CA. The research hypothesis is that the willingness to adopt CA is motivated by the way farmers perceive the benefits they derive from this technology. Positive perceptions of CA create more opportunity for CA dissemination in rural communities.
Farmers’ perception of CA benefits was assessed using ordered logit models as functions of CA adoption and region (forest vs. savannah). We modeled three perceived benefits: reliability of income from CA, area of land under CA, and food security status. For each of these benefits, five ordered logit models were estimated by varying the sample composition with adopt and savannah as the independent variables. The marginal effects on how smallholder farmers perceived CA benefits are displayed in Table 4. The marginal effects show that CA adoption leads to higher, usually statistically significant levels of income reliability in models (9) to (11) and higher levels of food security in models (9) to (12). Region and adoption are not significant (P < 0.05) in any of the models for explaining increased levels of land under CA. Across all five models, CA adoption is associated with higher perceptions of income reliability and food security status. Additionally, increases in perceptions of income reliability and food security status are higher in the savannah area. Partitioning the sample by trained and untrained showed little statistical significance for either adopt or savannah.
5.3.1. Reliability of income from CA
In Table 4, models (9), (10), and (11) illustrate how in the forest and the savannah, CA adoption itself affects farmers’ perception of a reliable income. In comparing the coefficients on CA in models (9), (10), and (11), it appears the effect of CA on perceptions of reliability of income from CA do not vary substantially by region (savannah or forest). In the forest (model 10), the four preference levels for a reliable income from CA are highly significant (P < 0.01), with negative effects for the three lower levels (“not reliable,” “less reliable,” and “somehow reliable”) and a positive effect for the highest level (“very reliable”). Model (10) in Table 4 indicates that CA adopters’ probability of perceiving “very reliable” income rises by 0.37 relative to nonadopters. In Table 4, model (10) shows CA adopters’ probability of getting a “somehow reliable,” “less reliable,” and “not reliable” income decreases, respectively, by 0.095, 0.078, and 0.196 compared with nonadopters. In the savannah (model 11), three levels of preferences for a reliable income from CA are highly significant (P < 0.01), with negative effect on the two lower levels (“not reliable” and “less reliable”) and positive effect for the highest level (“very reliable”). Model (11) in Table 4 indicates CA adopters’ probability of perceiving “very reliable” income rises by 0.49 relative to nonadopters. In Table 4, model (11) shows CA adopters’ probability of getting “less reliable” and “not reliable” income decreases, respectively, by 0.146 and 0.289 compared with nonadopters. Having a “somehow reliable” income is insignificant in the savannah. In the savannah, CA adopters’ probability of a very reliable income is 0.49 higher than for nonadopters. In the forest, this difference in probability between adopters and nonadopters is 0.37, although the difference between the regions (0.12) is not statistically significant.
5.3.2. Food security status
In Table 4, models (10) and (11) indicate that the marginal increases because of CA adoption do not differ substantially between regions (savannah and forest). This is particularly true for the coefficients of “increased.” In the forest (model 10), the three levels of the food security responses are statistically significant (P < 0.10). Model (10) in Table 4 implies, in the forest, CA adopters’ probability of perceiving “increased” food security status rises by 0.26 relative to nonadopters. In the savannah, model (11), the three levels of the food security responses are statistically significant (P < 0.05), implying greater perception of food security in the savannah. In both regions, the forest and the savannah, farmers believe that their decision to adopt CA leads to a better food security status.
6. Summary, conclusion, and recommendations for further research
The DRC’s abundance of natural resources is not reflected in its people’s well-being and the country’s overall economic performance. Despite its challenges, both endogenous and exogenous, the agriculture sector in the DRC has the potential to make an economic difference both at the microlevel (household) and macrolevel (economy wide) and could be able to play a significant role in the country’s growth and development. One method for unlocking economic growth potential in the DRC is to elevate women in agriculture, as they are more involved in agriculture than men.
In an effort to assist vulnerable women, this study analyzed the innovative CA practice promoted by the CRS’s NTA project in the province of Maniema in the DRC. The NTA project set out to teach the community to practice CA, which could reduce the need for slash-and-burn agriculture and enhance the use of fallows and old farmlands because doing so could ensure that women can farm close to their homes. This study used farm-level data from CRS to estimate the drivers of CA adoption and the benefits obtained by adopters and is the first to do so for the DRC. We found that being an unmarried female reduces the probability of adopting CA. This suggests CRS might try to change its approaches to fostering adoption to be more appealing to nonmarried females. Targeting vulnerable women who are part of a farmers’ group or who also have accessed credit may increase the number of vulnerable women who would adopt CA in the future. One approach might be to expand the availability of credit for nonmarried women. There is a need to explore more about the challenges and opportunities of empowering women in agriculture from their cultural and contextual perspectives.
Participation in farmers’ groups was related to greater CA adoption, especially in the forest area, suggesting that greater farmer cohesion could lead to more adoption. Producers who accessed credit had a higher CA adoption rate than those who did not. A CA program aimed to increase access to credit options could increase CA adoption in poor farmers’ communities. Based on these results, future research is warranted on the important link between the lack of credit (or the difficulty faced by small-scale producers to obtain it) in low-income countries and the adoption of new agricultural technology. It would appear from this study that those producers not obtaining credit have lower likelihoods of CA adoption, which could ultimately increase food insecurity and poverty and slow the transformation of agriculture in the DRC from one of slash-and-burn to a system that provides more ecosystem services. Regionality led to some differences in the effects of various factors. Future work might fashion approaches appropriate to the agricultural zones because CA adoption varied with region, even within local communities. CA training clearly increases adoption. Efforts specifically focused on CA training for nonmarried women might pay high dividends.
This study approached the exploration of CA benefits in terms of farmers’ perception of specific gains that resulted from CA. The results of ordered logit modeling suggest that farmers who adopted CA perceive income reliability and food security. The perception of increased land holdings was not related to adoption or region. These findings suggest emphasizing increased income and food security as a result of adopting CA.
Analysis of the factors driving CA adoption in Africa is still in its infancy. Future work may focus on the differences in adoption between specific crops, between land tenure (owned vs. collective/tribal), and general soil fertility. Further, an important theme for CA, in general, would be to study those who adopted CA but then abandoned it. Studying the factors of adoption and then rejection could help policy makers formulate a more holistic strategy for long-term CA adoption. This work is a first step to a more holistically sustainable agricultural approach to subsistence farming in the DRC. The results of this study provide future CA projects with valuable information on what the drivers of adoption are and what the perceived benefits of adoption are perceived to be. Future research and CA projects can more precisely focus on specific groups of producers in the DRC based on location, gender, and access to credit and farmers’ groups to both increase and emphasize food and income security. This study is part of a large social and economic puzzle that the DRC faces; results from this study can help put some pieces of that puzzle together.
Author ORCIDs
Lawton Nalley, 0000-0002-6718-8189


 Open access