


1. Introduction
Cattle production in Ecuador uses about 68% of the agricultural land; however, it only accounts for about 11% of agricultural gross domestic product, reflecting both low levels of productivity and competitiveness (Castillo, Reference Castillo2015). In fact, the Ecuadorian beef sector is characterized by several inefficiencies along the supply chain, which leads to the provision of low-quality beef. On the demand side, beef consumption in Ecuador is low (about 10 kg per person per year) compared with other beef-producing countries on the continent, like Argentina (63 kg), Brazil (36 kg), and the United States (26 kg; Castillo, Reference Castillo2015). There is also relatively low demand for high-quality beef, likely because of the absence of information and education on beef quality and very low levels of beef imports (as a result of stringent import protection policies)Footnote 1 that do not allow beef consumers to have access to beef from high-quality producing countries.
The need to modernize the beef cattle sector has been recognized by the Ecuadorian government, which has executed various cattle production and processing improvement programs, including programs related to animal breeding, pasture management, animal health, and animal slaughtering at municipal slaughterhouses (Ministerio de Agricultura y Ganadería [MAG], 2013). A main motivation to undertake these programs was the policy objective of exporting beef products.Footnote 2 As we will describe more in depth in the next section, beef production in Ecuador is not currently of export quality. Nevertheless, this governmental interest in the sector has brought awareness about the challenges of the Ecuadorian beef sector, especially with regard to the production of quality beef products.
Changes in consumer preferences and food quality perceptions in developed countries have had a strong influence in both policies and market institutions (Hobbs, Reference Hobbs2003). We posit that consumers interests’ and perceptions are likely to become more important in policy and market initiatives as income and education increase in developing countriesFootnote 3 and could even play an important role as drivers of beef quality improvements. This study explores the current and potential demand for high-quality beef in Ecuador. Specific objectives of this article include (1) to evaluate Ecuadorian consumers’ perception, knowledge, and experiences regarding beef quality; (2) to assess Ecuadorian consumer preferences for intrinsic and credence (extrinsic) beef attributes that imply better management of the beef supply chain (animal welfare, sanitary control, traceability, and meat maturation); and (3) to evaluate the effect of educational information on Ecuadorian consumer preferences for beef quality characteristics.
This article contributes to the demand literature by evaluating consumer demand for intrinsic and credence attributes for beef products in the context of a developing country. Some of the same concerns prevalent among beef consumers in high-income countries such as food safety (Latvala, Reference Latvala2010), animal welfare (Schnettler et al., Reference Schnettler, Vidal, Silva, Vallejos and Sepúlveda2009), and environmental degradation (McAlpine et al., Reference McAlpine, Etter, Fearnside, Seabrook and Laurance2009), among others, have started to become of interest to consumers in middle- and low-income countries (e.g., Rojas, Stuardo, and Benavides, Reference Rojas, Stuardo and Benavides2005). However, there is a gap in the literature regarding evolving consumer preferences for food products in middle- and low-income countries.
The study provides information that can be used by the beef industry to guide its production, marketing, and food safety efforts. The results of this study are also aimed to guide public policy by assessing the potential impact on beef demand of quality certification programs and consumer-oriented educational campaigns about beef production practices as they relate to beef quality attributes.
In the following section, we will review in more depth the situation of the beef sector in Ecuador. In Section 3, we state the hypotheses of the study. Section 4 presents a brief literature review. In Section 5, we describe our methodology and data collection. Section 6 shows our results and discussion, and Section 7 concludes.
2. The Ecuadorian beef sector
The structure of beef cattle production in Ecuador has experienced dramatic changes in the last 10 years. Several adverse facts, including the drop in cattle prices, the increase in input prices, and unfavorable public policies have caused many large- and medium-sized cattle owners to go out of business or to downsize their cattle farms. Nowadays, according to Agrocalidad (personal communication, MAG, February 2015), 90% of cattle farmers are small herd owners (less than 50 heads). This type of producer holds cattle among other farming activities, and for them, owning cattle is less about optimizing profit and more about the social benefits of cattle ownership (e.g., link to a traditional way of life and use of cattle as a form of savings or even social status). Consequently, animal sales are sporadic and not necessarily at optimum weight or value but at times of most economic need (Castillo, Reference Castillo2015). To ensure regular supply and throughput, the meat processing industry and the service sectors (restaurants and supermarkets) rely on intermediaries that collect the animals from farms and transport them to cattle markets or directly to slaughterhouses. These intermediaries can be of different operational scales, and there can be more than one intermediary between production and slaughter, hence increasing opportunities for losses and damages that are later reflected in the quality of the meat (Castillo, Reference Castillo2015).
Most slaughterhouses in Ecuador are publicly owned and operated (86%); they are controlled by municipalities that usually subsidize slaughter rates resulting in the crowding out of competition from the private sector. Intermediaries that bring animals to the municipal slaughterhouses sell them to authorized wholesalers, who after the slaughtering distribute the meat to their different clients (e.g., restaurants, butchers, and supermarkets), including other intermediaries in meat distribution. Thus, slaughterhouses do not have a very active role in the supply chain because they only offer a service to wholesalers. Therefore, there is a disconnection between cattle production, slaughtering, and beef distribution. Moreover, the service provided by municipal slaughterhouses tends to be of low quality. For example, only 4% of bovine slaughterhouses in the provinces with the highest number of cattle slaughtered (Guayas, Santo Domingo, and Manabí) had, at the time of this research, been given an official status of “approved for functioning” by the Ecuadorian Ministry of Agriculture.
In short, the long beef value chain makes the connection between producer and consumer difficult. In addition, there is lack of knowledge about beef quality on the consumer end of the chain. Both of these factors do not provide the appropriate setting for quality production.
3. Hypotheses
Based on the aforementioned analyses, we can see that there is ample room for quality improvements in the Ecuador beef sector. We formulated three hypotheses for the study, which point toward the role that consumers might have in the improvement of beef quality.
H1: Ecuadorian beef consumers are not completely satisfied with the quality of local beef.
H2: Ecuadorian consumers are willing to pay for credence beef attributes such as animal welfare, food safety standards, and maturation.
H3: If consumers are educated (thorough educational information) about the importance of credence attributes and their relation to intrinsic attributes, their demand (i.e., willingness to pay) for high-quality attributes will increase.
4. Literature review
Information about quality plays a critical role in consumers’ demand for food products. Studies have found that consumers consider both intrinsic and extrinsic quality cues at the time of purchase. Cues are the information that the consumers have available to form their quality expectations (Grunert, Bredahl, and Brunso, Reference Grunert, Bredahl and Brunso2004). In the case of beef, intrinsic cues relate to physical characteristics of the meat (e.g., fat content and color), whereas extrinsic cues are about external characteristics of the product like price, packaging, brand name, and place of purchase, among others.
For many products and services, there are also attributes that cannot be observed, nor can they be evaluated after normal use of the product, despite being of concern to the consumer (Darby and Karni, Reference Darby and Karni1973). The use of hormones during production and the type of feed, animal welfare, and food safety are examples of such attributes in the case of beef. These types of attributes are called credence attributes or credence qualities to differentiate them from search quality (cues available at the time of purchase) and experience quality (perceived only after consumption; Becker, Reference Becker2000; Darby and Karni, Reference Darby and Karni1973). As noted by De Groote et al. (Reference De Groote, Narrod, Kimenju, Bett, Scott, Tiongco and Gitonga2015), the uncertainty regarding credence attributes can be lowered by information—for example, labels reflecting tests passed and quality certifications (banners and brochures are also ways to provide this type of information). Information on credence attributes is also regarded in the literature as a type of extrinsic cue or extrinsic attribute. As found by Bredahl (Reference Bredahl2004), extrinsic attributes can help consumers to form their expectations about beef quality.
After the occurrence of multiple meat safety crises and the growing societal concern for the animals and the environment, there has also been an increasing interest among consumers, especially in developed countries, regarding credence attributes. As a result, many studies have tried to identify the most important or most valued attributes in the minds of consumers so as to suggest the type of information that would be most useful to them and that would increase their demand for beef. Bernués, Olaizola, and Corcoran (Reference Bernúes, Olaizola and Corcoran2003) studied the relevance of several extrinsic quality cues of red meat in regions of five European countries and found animal feed and origin as the most important extrinsic attributes, followed by animal welfare and environmentally friendly production. Animal feed was found to be regarded by consumers as an indicator of beef safety. Although beef origin has been found to be a cue for meat safety by other authors, Bernués, Olaizola, and Corcoran (Reference Bernúes, Olaizola and Corcoran2003) were not able to establish such a relationship and instead link origin to local identity. Animal welfare and environmentally friendly production were found to be associated with concerns about meat safety, nutrition, and health.
Mennecke et al. (Reference Mennecke, Townsend, Hayes and Lonergan2007) studied the role of intrinsic and extrinsic characteristics on U.S. consumers’ attitudes toward beef and found that region of origin is the most important beef attribute, followed by animal breed, traceability, and animal feed. Latvala (Reference Latvala2010) investigated consumers’ willingness to pay (WTP) for increased beef quality information (food safety and origin, among other attributes) in Finland. This author found that about 73% of her respondents were indeed willing to pay for additional information, suggesting that there is not enough information on beef credence attributes on the markets.
Schnettler et al. (Reference Schnettler, Vidal, Silva, Vallejos and Sepúlveda2009) reviewed the literature related to the relevance of animal welfare in consumer preferences in different European Union countries and evaluated its importance to Chilean consumers. The literature review indicated that the reasons European consumers are concerned about animal welfare go from ethical reasons to more individual concerns regarding beef quality. Moreover, although animal welfare concerns have been growing, in some European countries its importance is secondary to other extrinsic or intrinsic attributes. In the case of Chile, Schnettler et al. (Reference Schnettler, Vidal, Silva, Vallejos and Sepúlveda2009) found that, among the three attributes analyzed, meat origin (domestic vs. imported) has the highest importance for the consumers, followed by information on animal welfare and prices. WTP for information on animal welfare was positive but very small. These results are consistent with Rojas, Stuardo, and Benavides (Reference Rojas, Stuardo and Benavides2005) who suggested that animal welfare was not yet a major concern on the American continent. Rojas, Stuardo, and Benavides (Reference Rojas, Stuardo and Benavides2005) found that the main factor leading to the adoption of animal welfare regulations in American countries is actual or potential participation in beef exports to certain markets where animal welfare is of importance.
Beriain et al. (Reference Beriain, Sánchez and Carr2009) carried out a study incorporating hedonic rating (a taste panel), buying intention, and WTP for beef from two different regions. These authors worked with three scenarios, each one with a different level of information (blind scores; animal feeding and muscle fat content information; and animal feeding, muscle fat content, and geographic origin information). They investigated the effect of information on consumers’ buying intention and WTP and found that Spanish consumer acceptance increases as more information is made available to them. They concluded that, even though intrinsic attributes (like juiciness and tenderness) play a key role in product ratings, extrinsic attributes also play a key role and can be decisive in influencing consumers’ choice. They also suggested that, although information (extrinsic cues) could counterweigh deficiencies in intrinsic attributes, improvements in the intrinsic characteristics can be exploited by relating them to extrinsic values, such as geographic origin.
Although not related to beef demand and attributes, it is important to mention some recent studies that evaluate the impact of information in good valuation via discrete choice experiments. For example, Mattea et al. (Reference Mattea, Franceschinis, Scarpa and Thiene2016) and Johnston, Holland, and Yao (Reference Johnston, Holland and Yao2016) evaluate the effect of alternative visual information for the valuation of landslide reduction programs and riparian restoration, respectively. Both studies found WTP estimates to be dependent on information.
In summary, the literature review indicates that in addition to intrinsic beef attributes, credence attributes are important determinants of consumers’ demand for beef; however, the relative importance of these attributes varies from country to country and has been evolving through time. As credence attributes cannot be observed, information about the attributes is of key importance. The amount of information provided to consumers when using stated preference methods has been found to affect WTP estimates. Finally, only very few studies have evaluated the demand for beef quality attributes in developing countries.
5. Methodology and data collection
Data collection for this study followed a mixed-methods approach including qualitative (step 1) and quantitative (step 2) methods. The qualitative phase of the study included two focus groups of beef consumers. Results of the qualitative phase were used for the development of a survey instrument for the second phase. Focus groups’ discussions centered on consumers’ understanding of beef quality, the attributes they take into consideration when purchasing beef, and their attitude toward paying higher prices for beef with guaranteed better quality. Consumers were also asked to prioritize a list of intrinsic and extrinsic attributes based on the literature review and discussions with experts.
Results from the first focus group were used to refine the list of attributes provided to the participants in the second focus group. Credence attributes presented to the focus groups’ participants were animal welfare, food safety, traceability, meat maturation, breed, and age of the animal. Other credence attributes mentioned in the literature such as animal feed and the use of hormones were not included because most beef cattle in Ecuador are raised on pastures and the use of hormones is not a common practice. Geographic origin was not included because beef imports are not significant in Ecuador. Also, environmental considerations were not included because they did not stand out as an important concern during the focus groups’ discussions.
5.1. Survey design and implementation
The survey was organized into four parts that collected information about households: (1) socioeconomic demographic characteristics; (2) consumption of beef products; (3) knowledge, opinions, and experiences about beef quality; and (4) responses to two sequential stated choice experiments to assess their preferences for intrinsic and credence attributes (see Table 1). Questions in part 3 of the survey were designed to test hypothesis 1. The choice experiments in part 4 were developed to test hypotheses 2 and 3.
Table 1. Beef attributes selected for the study (intra-attributes in parentheses)

a In this case, they all refer to credence attributes.
The survey was administered in person to 547 randomly selected households in the cities of Guayaquil and Santo Domingo during 2016. Guayaquil is the largest city in the country and is located in the coastal region. This city also accounts for 20% of total national beef expenditures, according to data from the 2011–2012 national survey on income and expenditures of rural and urban households (ENIGHUR). Santo Domingo is a middle-sized city located in the foothills of the Andes. It has special participation in the beef supply chain of Ecuador because it has the largest cattle market in the country.
The survey was directed to middle-income households,Footnote 4 and the interviewed person was the household member in charge of making beef purchases. Because the quality of beef experienced at consumption can also be altered by the way the meat is prepared (Grunert, Bredahl, and Brunso, Reference Grunert, Bredahl and Brunso2004), this study concentrates only on fresh meat purchased at the market for cooking at home.
5.2. Choice experiments’ design
The survey instruments included two sequential choice experiments for all consumers. Each choice experiment included multiple choice scenarios. The first choice experiment mirrors the current situation where consumers only observe and use intrinsic attributes and price for the selection of beef products. The second choice experiment also included information about credence attributes, in addition to price and intrinsic attributes, to reflect the potential scenario where consumers receive this additional information. Moreover, the second experiment included two levels of information provided to two randomly selected consumer groups: basic and more advanced information about the credence attributes.
The first choice experiment included only two intrinsic attributes (color and texture) and the price of “top round” beef cuts.Footnote 5 Beef consumers were asked to select between two product profiles (choice scenario) that differ across the intrinsic characteristics and price. Consumers could also choose a neither option. A total of six choice scenarios were given to each consumer in the first choice experiment. The color attribute included three levels (intra-attributes): dark red, bright red, and pale. The texture attribute included two levels: few muscle fibers and visible muscle fibers. The price attribute included four potential prices: $2.86/lb., $3.60/lb., $4.45/lb., and $5.31/lb.Footnote 6 These price levels were defined based on a sample of prices from 12 retail locations (supermarkets, meat supermarkets, municipal markets, and convenience stores) collected in Guayaquil and Santo Domingo between March and August 2016. The overall average value of prices during the period was $4.05. Average prices in Santo Domingo were about 8% lower. Therefore, price levels in the experiment were set by using price values about 10% and 30% above and below the average observed prices in both cities ($4.05).
The second experiment included the same intrinsic attributes as in the first experiment, the price levels, as well as the credence attributes (sanitary control, meat maturation, animal welfare, and traceability), which were selected based on the results of the focus groups and expert interviews. The levels for each credence attribute were the presence or absence of the attribute. As in the case of the first choice experiment, consumers were asked to select between two products that differ across the intrinsic and credence characteristics and price. Consumers could also choose a neither option. They were given a total of eight choice scenarios in this choice experiment. Figure 1 shows an example of one of the choice scenarios presented to the consumers.Footnote 7 With this second experiment, we expected to see how consumers value information on credence attributes (i.e., information that signals better-quality beef, hypothesis 2) and if consumer preferences for these intrinsic attributes change when being exposed to this type of information.
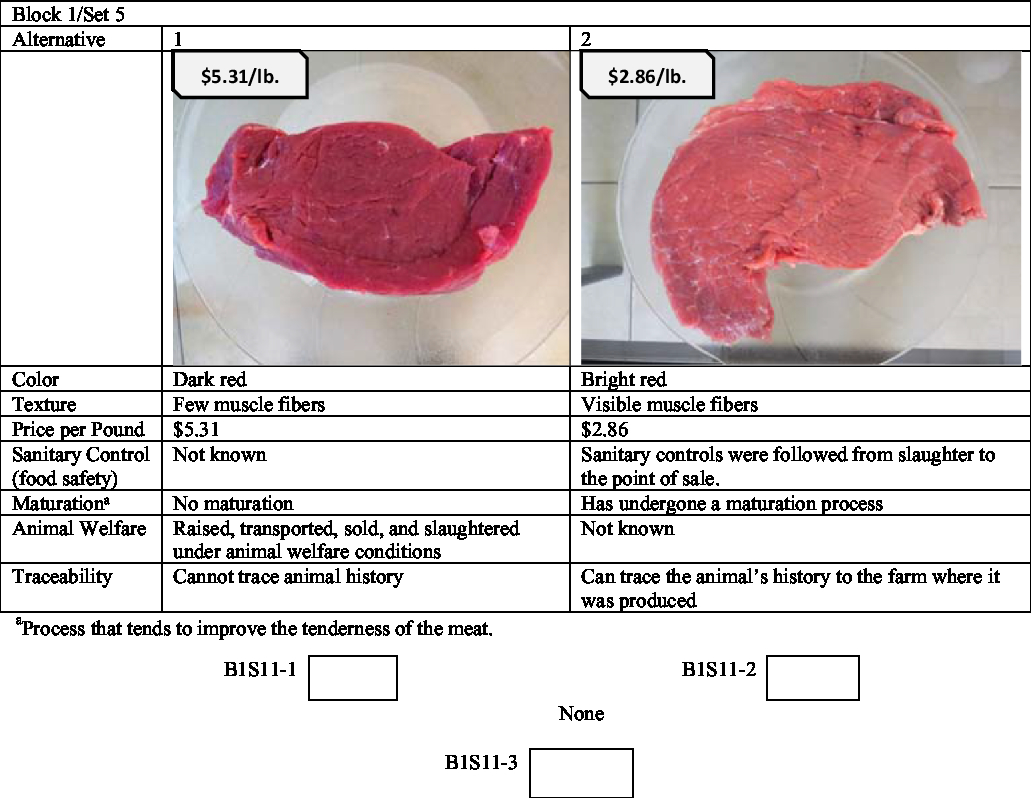
Figure 1. A scenario of the second choice experiment.
We also introduced a variation to the second choice experiment to evaluate the effect of education on preferences for the credence attributes. One-half of the sample of consumers was shown the credence attributes with only basic information about such attributes. This was done for the purpose of reflecting the situation of places where they have appropriate labels, but where consumers do not necessarily understand what that information means. The other half of the sample was provided educational information related to the credence attributes. The purpose of this variation is to test the effect of educational information on consumers’ WTP for credence attributes (hypothesis 3). The educational information included a brief explanation of each credence attribute and the links between the attribute and the effect it might have on beef quality. Details on this information are in the Appendix (Figure A1).
SAS software was used to create the experimental question design. The combination of all attributes and levels for the first experiment resulted in a total of 24 (4 × 3 × 2) possible product profiles and 276 possible choice scenarios (C224), where $C_n^r$
denotes the number of unordered subsets (i.e., combinations) of n objects taken r at a time (Hogg, Tanis, and Zimmermann, Reference Hogg, Tanis and Zimmermann2001). The number of product profiles and choice scenarios for the second experiment was 384 (4 × 3 × 2 × 2 × 2 × 2 × 2) and 73,536 (C2384), respectively. Hence, fractional factorial designs were applied to choose 18 choice scenarios for the first experiment and 24 for the second experiment by comparing the D-efficiency for each combination of choice scenarios. Finally, the designs were blocked into three different versions of the questionnaires where each respondent was offered only six choice scenarios in the first experiment and eight choice scenarios in the second experiment.
$C_n^r$
denotes the number of unordered subsets (i.e., combinations) of n objects taken r at a time (Hogg, Tanis, and Zimmermann, Reference Hogg, Tanis and Zimmermann2001). The number of product profiles and choice scenarios for the second experiment was 384 (4 × 3 × 2 × 2 × 2 × 2 × 2) and 73,536 (C2384), respectively. Hence, fractional factorial designs were applied to choose 18 choice scenarios for the first experiment and 24 for the second experiment by comparing the D-efficiency for each combination of choice scenarios. Finally, the designs were blocked into three different versions of the questionnaires where each respondent was offered only six choice scenarios in the first experiment and eight choice scenarios in the second experiment.
5.3. Data analysis and models
Choices made by survey respondents were modeled assuming a random utility model. The utility of each choice depends on the identified product attributes (price and intrinsic and credence beef attributes). For consumer i choosing between C alternatives in choice occasion t, the utility of choice c (Uict) is the following:Footnote 8
 $${U_{ict}} = {V_{ict}} + {e_{ict}},$$(1)
where i = 1, …, I; c = 1, …, C; t = 1, …, T. V ict is the portion of utility related to the identified product attributes, and e ict reflects the effect of factors not included in V ict (e.g., consumers’ knowledge, perceptions, etc.). It is further assumed that e ict is i.i.d. (independent and identically distributed), and distributed extreme value and the variance of e ict can differ across consumers, so  $Var\left( {{e_{ict}}} \right) = k_i^2\left( {{{{\pi ^2}} \over 6}} \right),$
where K
i
is a scale parameter corresponding to consumer i. Intuitively, this consumer-specific scale parameter reflects the variability of utility across choice situations for each consumer because, for example, unobserved factors can differ across choice situations (Train and Weeks, Reference Train, Weeks, Scarpa and Alberini2005).
$Var\left( {{e_{ict}}} \right) = k_i^2\left( {{{{\pi ^2}} \over 6}} \right),$
where K
i
is a scale parameter corresponding to consumer i. Intuitively, this consumer-specific scale parameter reflects the variability of utility across choice situations for each consumer because, for example, unobserved factors can differ across choice situations (Train and Weeks, Reference Train, Weeks, Scarpa and Alberini2005).
Assuming a linear functional form for the parameters in the deterministic component of utility, and specifying utility as separable in price, p ict , and nonprice attributes, X ict , equation (1) can be rewritten as follows:
 $${U_{ict}} = - {\alpha _i}{p_{ict}} + {{\bf{\beta '}}_i}{{\bf{X}}_{{\rm{ict}}}}{\rm{ + }}{{\rm{e}}_{{\rm{ict}}}},$$(2)
where β i and α i are individual-specific utility parameters corresponding to the nonprice and price attributes, respectively. Dividing equation (1) by the scale parameter k i results in a new error term (ϵ ict) with constant variance  $({{{\pi ^2}} \over 6})$
that corresponds to the traditional indirect utility model in preference space (Train and Weeks, Reference Train, Weeks, Scarpa and Alberini2005):
$({{{\pi ^2}} \over 6})$
that corresponds to the traditional indirect utility model in preference space (Train and Weeks, Reference Train, Weeks, Scarpa and Alberini2005):
 $${U_{ict}} = - ({\alpha _i}/{k_i}){p_{ict}} + {\rm{ (}}{\bf \beta} /{k_i}{\rm{)}},{X_{ict}} + ({e_{ict}}/{k_i}) = - {\gamma _i}{p_{ict}} + {\rm{ }}{\tau '_i}{X_{ict}} + {\varepsilon _{ict}}.$$(3)
 Because the WTP for an attribute is the ratio of the attribute’s coefficient to the price coefficient,
Wi
=
τi
/γi
, equation (3) can be reparameterized if we multiply and divide
τi
by ${\gamma _i}({\rm{i}}.{\rm{e}}.,{{{\gamma _i}} \over {{\gamma _i}}}{\tau _i} = {\gamma _i}{w_i})$
:
${\gamma _i}({\rm{i}}.{\rm{e}}.,{{{\gamma _i}} \over {{\gamma _i}}}{\tau _i} = {\gamma _i}{w_i})$
:
 $${U_{ict}} = - {\gamma _i}{p_{ict}} + ({\gamma _i}{W_i})'{X_{ict}} + {\varepsilon _{ict}},$$(4)
which is called the model in WTP space, and
Wi
is the vector of WTP values for all the attributes (Train and Weeks, Reference Train, Weeks, Scarpa and Alberini2005). We adopted the model in WTP space instead of the model in preference space because this approach tends to fit the data better and results in more plausible estimates of the WTP values for the nonprice attributes (Scarpa, Thiene, and Train, Reference Scarpa, Thiene and Train2008).Footnote 9 Given the assumption that each ϵict
is i.i.d. extreme value, the probability that consumer i chooses alternative c in choice occasion t, conditional on the coefficient vector ${\theta _i} = [{\gamma _i}{W'_i}]'$
, is (Revelt and Train, Reference Revelt and Train1998):
${\theta _i} = [{\gamma _i}{W'_i}]'$
, is (Revelt and Train, Reference Revelt and Train1998):
 $${P_{ict}}\left( {{\theta _i}} \right) = {\rm{ }}{{{e^{{{\rm{V}}_{ict}}({\theta _i})}}} \over {\sum\nolimits_c {{e^{{V_{ict}}({\theta _i}),}}} }}$$(5)
where ${V_{ict}}({\theta _i}) = - {\gamma _i}{p_{ict}} + ({\gamma _i}{W_i})'{X_{ict}}$
Furthermore, conditional on
θi
, the probability of consumer i’s observed sequence of T choices is then (Train, Reference Train1998):
${V_{ict}}({\theta _i}) = - {\gamma _i}{p_{ict}} + ({\gamma _i}{W_i})'{X_{ict}}$
Furthermore, conditional on
θi
, the probability of consumer i’s observed sequence of T choices is then (Train, Reference Train1998):
 $${S_i}\left( {{\theta _i}} \right) = {\prod _t}{\rm{ }}{P_{ic(i,t)t}}\left( {{\theta _i}} \right),$$(6)
where c(i,t) denotes the specific alternative c that consumer i selects in choice occasion t. The coefficient vector θi is unobserved for each consumer i and varies in the population with density f( θi |Γ) where the parameters of the distribution of θi are Γ. Thus, the unconditional probability of the observed choice sequence (i.e., the mixed logit choice probability) is as follows:
 $${P_i}\left( \Gamma \right) = \smallint {\rm{ }}{S_i}({\theta _i})f({\theta _i}|\Gamma )d{\theta _i}.$$(7)
The log-likelihood function for all n consumers is LL(Γ) = ∑ i ln Pi (Γ). Estimation was carried out using simulated maximum likelihood procedures using STATA software (Rigby and Burton, Reference Rigby and Burton2006; Train, Reference Train1998, Reference Train2003). Regarding the distribution of the coefficients in θi , the price coefficient was specified to be lognormal, and the WTP distributions for all nonprice attributes were assumed to be normal.
5.4. Testing differences in willingness-to-pay coefficients across experiments and groups of respondents with varying information levels
Estimation of model coefficients was carried out combining respondents’ data from the first and second experiments. This approach allow us to test for differences in WTP coefficients both across the sequential choice experiments (as the credence attributes are included in the product profiles in addition to the intrinsic attributes) and across groups of consumers with different information about the credence attributes. Denoting the vector of intrinsic attributes as aict and the vector of credence attributes as Zict, the complete vector of nonprice attributes used for model estimation is ${X_{ict}} = {\rm{ }}{\left[ {{{a'}_{ict}}{{a'}_{ict}}x{d_{exp2}}{{z'}_{ict}}x{d_{exp2}}{{z'}_{ict}}x{d_{exp2}}x{d_{information}}} \right]^\prime }$
. In addition to the vector of intrinsic attributes
aict
,
Xict
includes an interaction between the intrinsic attributes and a dummy variable for the second experiment (d
exp2)
${X_{ict}} = {\rm{ }}{\left[ {{{a'}_{ict}}{{a'}_{ict}}x{d_{exp2}}{{z'}_{ict}}x{d_{exp2}}{{z'}_{ict}}x{d_{exp2}}x{d_{information}}} \right]^\prime }$
. In addition to the vector of intrinsic attributes
aict
,
Xict
includes an interaction between the intrinsic attributes and a dummy variable for the second experiment (d
exp2) ${a'_{ict}}x{d_{exp2}}$
, and an interaction between credence attributes and the second experiment dummy
${a'_{ict}}x{d_{exp2}}$
, and an interaction between credence attributes and the second experiment dummy ${z'_{ict}}x{d_{exp2}}.\,{X_{ict}}$
. also includes an interaction between the credence attributes, the second experiment dummy and a dummy variable (d
information
) to differentiate households that received additional information regarding the credence attributes:
${z'_{ict}}x{d_{exp2}}.\,{X_{ict}}$
. also includes an interaction between the credence attributes, the second experiment dummy and a dummy variable (d
information
) to differentiate households that received additional information regarding the credence attributes: ${z'_{ict}}x{d_{exp2}}x{d_{information}}$
. The vector of intrinsic attributes
aict
, is included by itself and interacted with the dummy for the second experiment because these attributes were present in both experiments. The vector of credence attributes
zict
is only included interacted with the dummy for the second experiment because these attributes were not included in the first experiment. Similarly, the information dummy is only interacted with
${z'_{ict}}x{d_{exp2}}x{d_{information}}$
. The vector of intrinsic attributes
aict
, is included by itself and interacted with the dummy for the second experiment because these attributes were present in both experiments. The vector of credence attributes
zict
is only included interacted with the dummy for the second experiment because these attributes were not included in the first experiment. Similarly, the information dummy is only interacted with ${z'_{ict}}$
and d exp2 as the information was only presented after the first experiment and focused on the credence attributes.
${z'_{ict}}$
and d exp2 as the information was only presented after the first experiment and focused on the credence attributes.
The corresponding complete vector of WTP coefficients in this specification, ${W_i} = [w{a'_i}w{a'_i}_{_,\,exp2}w{z'_i}_{,\,exp2}wzin{f'_i}_{_{,\,}exp{\bf{2}}}]'$
, includes WTP coefficients for credence attributes in the first experiment
${W_i} = [w{a'_i}w{a'_i}_{_,\,exp2}w{z'_i}_{,\,exp2}wzin{f'_i}_{_{,\,}exp{\bf{2}}}]'$
, includes WTP coefficients for credence attributes in the first experiment ${a'_{ict}}$ $(wa'_{i})$
, the interaction terms
$(wa'_{i})$
, the interaction terms ${a'_{ict}}x{d_{exp2}}(w{a'_i}_{,exp{\bf{2}}}),{z'_{ict}}x{d_{exp2}}(w{z_{i,exp{\bf{2}}}})'$
and
${a'_{ict}}x{d_{exp2}}(w{a'_i}_{,exp{\bf{2}}}),{z'_{ict}}x{d_{exp2}}(w{z_{i,exp{\bf{2}}}})'$
and ${z'_{ict}}x{d_{exp2}}$ $x{d_{information}}(wzin{f'_{i,exp{\bf{2}}}});w{a'_i}$
represents WTP values for the intrinsic attributes in the first experiment,
$x{d_{information}}(wzin{f'_{i,exp{\bf{2}}}});w{a'_i}$
represents WTP values for the intrinsic attributes in the first experiment, ${w'_{i, exp2}}$
reflects differences in WTP values for the intrinsic attributes in the second experiment relative to the first experiment,
${w'_{i, exp2}}$
reflects differences in WTP values for the intrinsic attributes in the second experiment relative to the first experiment, $w{z'_{i, exp2}}$
is the WTP values for the credence attributes which were only presented in the second choice experiment, and
$w{z'_{i, exp2}}$
is the WTP values for the credence attributes which were only presented in the second choice experiment, and $wzin{f'_{i,exp2}}$
represents differences in WTP for the credence attributes among the group of respondents that received additional information relative to the group that only received basic information in the second experiment.
$wzin{f'_{i,exp2}}$
represents differences in WTP for the credence attributes among the group of respondents that received additional information relative to the group that only received basic information in the second experiment.
The use of the combined data from both experiments generates three options for the specification of the price coefficient (γi in equation 4). The alternative specifications are considered to evaluate changes in the price coefficient across experiments, as well as the sensitivity of the results to different assumptions regarding these coefficients. The first option assumes a constant price coefficient (γi = αi/ki ) for the first and second choice experiment:Footnote 10, Footnote 11
 $${U_{ict}} = - {\gamma _i}({p_{ict}}x{d_{exp1}} + {p_{ict}}x{d_{exp2}}) + {\rm{ }}{\left( {{\gamma _i}{W_i}} \right)^\prime }{{\bf{X}}_{ict}} + {\varepsilon _{ict}},$$(8)
where the dummy d exp1 differentiates data from first experiment. The price coefficient in this specification is estimated using information from both experiments. The other two specifications include, in addition to the price term pict , interactions between the price and dummies for the second (equation 9) and first experiment (equation 10):
 $${U_{ict}} = - {\gamma _{i,exp1}}{p_{ict}} + ({\gamma _{i,exp1}}{r_{i,exp2}}){p_{ict}}x{d_{exp2}} + {\rm{ (}}{\gamma _{i,exp1}}{W_{iexp1}})'{{\bf{X}}_{ict}} + {\varepsilon _{ict}},$$(9)
 $${U_{ict}} = - {\gamma _{i,exp2}}{p_{ict}} + ({\gamma _{i,exp2}}{r_{i,exp1}}){p_{ict}}x{d_{exp1}} + ({\gamma _{i,exp2}}{W_{iexp2}})'{{\bf{X}}_{ict}} + {\varepsilon _{ict}},$$(10)
where the coefficient γi,expk denotes the price coefficient for the kth experiment (k = 1, 2); ri,expk = γi,expj / γi,expk ∀j≠k, the ratio between the price coefficient for the jth and kth experiment (j = 1, 2); and W iexpk denotes WTP coefficients based on the kth experiment price coefficient. Note that whereas equation (8) assumes and imposes a constant price coefficient for both experiments, equations (9) and (10) allow for the estimation and testing for differences in price coefficients across models but use only one price coefficient for the estimation of WTP coefficients: equation (9) uses the price coefficient from the first experiment, and equation (10) uses the price coefficient from the second experiment.
5.5. Factors affecting consumers’ willingness to pay for beef attributes
The analyses of the relationship between consumers’ WTP values for the beef attributes and consumers’ characteristics were carried out using a two-step approach. In the first step, we estimated individual consumers’ WTP values for each beef attribute. In the second step, we used regression analyses to explore the association of consumer-related factors and beef attributes’ WTP values. Estimation of individual consumers’ WTP values is based on an application of Bayes’s rule. More specifically, the density of each θi (which includes the WTP coefficients) conditional on the individual’s sequence of choices and the population parameters is given by (Hess, Reference Hess2007; Revelt and Train, Reference Revelt and Train1999):
 $$h\left( {{\theta _i}|\Gamma } \right) = {{{S_i}\left( {{\theta _i}} \right)f\left( {{\theta _i}|\Gamma } \right)} \over {{P_i}\left( {{\rm{ }}\Gamma } \right)}},$$(11)
so the expected value of θi is given by
 $$E({\theta _i}|\Gamma ) = \smallint {\rm{ }}{\theta _i}h({\theta _i}|\Gamma ),$$(12)
and the simulated approximation to the individual vector of values for the attributes is therefore
 $$\hat E({\theta _i}|\Gamma ) = {{\sum\nolimits_r {{\theta ^r}} {S_i}\left( {{\theta ^r}} \right)} \over {\sum\nolimits_r {{S_i}} ({\theta ^r})}},$$(13)
where
θr is the rth draw from the population density f(
θi
|Γ), and Si θr is the probability of individual i’s sequence of choices. Estimated parameters $\hat \Gamma $
were used instead of the parameters Γ (Hess, Reference Hess2007). The stability of the estimated Ê(
θi
|Γ) values was verified using various sizes for the number of sample draws. The empirical results are based on 1,000 draws.
$\hat \Gamma $
were used instead of the parameters Γ (Hess, Reference Hess2007). The stability of the estimated Ê(
θi
|Γ) values was verified using various sizes for the number of sample draws. The empirical results are based on 1,000 draws.
Regarding the regression analyses, we used the following random effect regression model for the credence attributes (Campbell, Reference Campbell2007):
 $$WT{P_{ia}} = {c_a} + {\bf{z}}_{\bf{i}}^{'}{\bf{b}} + {u_n} + {e_{ia}},$$(14)
where WTPia is the ith household WTP for attribute a (i.e., a = sanitary control, meat maturation, animal welfare, traceability). ca and b are coefficients, Zi is a vector of household-related factors, un is a household-specific random error, and eia is an idiosyncratic error term. This approach accounts for the panel nature of the data and provides estimates of (average) marginal effects of factors on the WTP values for a group of attributes. Households’ factors in Xi included households’ characteristics as well as variables related to knowledge, perceptions, and experiences regarding beef production and consumption (Mennecke et al., Reference Mennecke, Townsend, Hayes and Lonergan2007).
6. Results and Discussion
6.1. Summary of sociodemographic characteristics
A female was the person in charge of food purchases in 78% of surveyed households, although this percentage is larger in the case of Santo Domingo (see Table 2). The level of education of the females in the sample was in most cases high school (61%), followed by a bachelor’s degree (32%). In the case of men, the majority had a bachelor’s degree (56%), followed by 34% who had only a high school education. Furthermore, and consistent with census data (Instituto Nacional de Estadísticas y Censos [INEC], 2010), the level of education is higher among respondents from Guayaquil than among those from Santo Domingo (Table 2). Average household size was four members in both cities (Table 2), similar to the 2010 census average (3.80 for Guayaquil and 3.86 for Santo Domingo).
Table 2. Description and summary statistics of respondents’ characteristics and knowledge, experience, and perceptions

6.2. Consumption of beef products
Summary statistics show that 80% of the households consume beef at least once a week (Table 2). When asked about the cuts of beef purchased most frequently, 44% of respondents gave among their answers, cuts such as “soft meat,” “filleted meat,” and “meat with bone,” among others that do not correspond to actual beef cuts. This percentage is much larger in Santo Domingo (64%) than in Guayaquil (24%), in spite of the fact that cattle farming and slaughtering are much more important components of Santo Domingo’s economy.Footnote 12 This reveals the lack of a culture on beef cuts even among those closer to the beef cattle sector. Moreover, the smaller percentage values in Guayaquil may be because of the higher levels of education and the presence of larger supermarkets and high-end meat stores in this city relative to Santo Domingo. For those who did answer actual beef cut names, the most popular beef cuts are outside round and tenderloin (both 19%), followed by top round (16%), rump (13%), ribs (12%), and loin (10%). However, there are differences between the two cities. In Guayaquil, top round is the most popular cut (26%), whereas in Santo Domingo it is both tenderloin and outside round (16% each).
Average monthly beef expenditure per household is $38 for the whole sample, but this average is larger in Guayaquil ($42/month) than in Santo Domingo ($33/month) attributable in part to higher meat prices in Guayaquil. The most visited places of purchase are supermarkets in Guayaquil (33% of the sample), followed by meat supermarkets (23%), and then by municipal markets (20%). On the other hand, municipal markets are the preferred outlet in Santo Domingo (47%), followed, although not closely, by supermarkets (23%) and then by small meat markets (18%; Table 2).
6.3. Knowledge, opinions, and experiences about beef quality
Only 7% of respondents indicated that they would like to increase beef consumption, but they do not consume more because of concerns about the health effects of beef consumption (50%) and high price (24%; see Table 2 for results differentiated by location). With respect to the group of households that would not like to increase beef consumption (93%), the main reasons for this were health concerns about beef consumption (58%), satisfaction with current levels of consumption (37%), and current health problems (21%). For both groups of individuals (those wanting and not wanting to increase beef consumption), concerns for animal welfare, the environmental impact of the cattle business, and dissatisfaction with local beef attributes were not among the most commonly cited reasons limiting beef consumption.
Regarding expectations for future consumption, 72% of the sample think their beef consumption will remain the same in the future, 24% think it will decrease, and only 3% expect it to increase. For those who expect beef consumption to decrease in the future, the most popular reasons were again concerns about the health effects of beef consumption (53%) and current health problems (49%).
The majority of survey respondents perceive the quality of the beef they consume as good or very good (about 79% of consumers), about 20% perceive its quality as fair, and only 1% of the respondents perceive its quality as bad or very bad. This is so, despite the fact that a large proportion of households (52%) have experienced disappointments when purchasing beef (either sometimes or oftentimes have ended up purchasing tough meat), and that 62% have avoided purchasing beef because they did not like the beef available at the first place they visited. These results are very similar across cities (Table 2).
Overall, these results do not support hypothesis 1 and a likely explanation for this is that, as noted earlier, Ecuadorian consumers do not have much knowledge about good-quality beef. These results also suggest that the relatively low per capita beef consumption in Ecuador does not seem to be driven by a poor overall quality perception of beef, but rather by a perception of beef as not very healthy: 61% of our sample expressed health concerns about beef consumption as reasons limiting either their current or future consumption.
In terms of households’ knowledge about beef credence attributes, the majority of survey respondents (at least 60%) were not very familiar with any of them. Traceability is the concept respondents seem to be the least familiar with (71% do not know anything about it), followed by meat maturation (61%). On the other hand, sanitary control shows the largest percentage of familiarity because 72% are familiar with this concept (Table 2).
About 90% of the respondents agreed that a quality certification (e.g., of sanitary control or animal welfare) would stimulate producers and wholesalers to improve the quality of beef. With respect to the most trusted institutions to provide quality certifications, a majority of households indicated they are more confident in international private organizations (about 53% indicated they are very confident about these institutions) compared with local private organizations (45%) and national government organizations (34%). Results are similar between the two cities, except for trust in a governmental institution, which is much lower in the case of Guayaquil (24% vs. 44% in Santo Domingo).
6.4. Mixed logit model results
The results of our baseline mixed logit estimation results (model 1), based on equation (9) and that uses the price coefficient of experiment 1, are shown in Table 3.Footnote 13 This model was selected as it resulted in the highest log-likelihood value among the three models considered and also generated the most plausible and conservative estimates of the mean of the WTP distributions. The model with the combined price coefficient (equation 8) resulted in WTP mean coefficients about twice as large (in absolute value) as those obtained with equation (9). The model using the second experiment price coefficient (equation 10) resulted in WTP mean coefficients that were about five times larger (in absolute value) than those obtained using equation (9). The overall relative magnitude of the nonprice coefficients was nonetheless consistent across models.Footnote 14
Table 3. Results of the mixed logit model in willingness-to-pay (WTP) space

Notes: Asterisks (***, **, and *) indicate significance the 1%, 5%, and 10% level, respectively. ASC, alternative specific constant.
a dexp2 is a dummy variable denoting the second experiment.
b dinformation is a dummy variable identifying households that received additional information about credence attributes.
c All the coefficients of nonprice attributes correspond to parameters (mean and standard deviation) describing the distribution of WTP values for the attributes.
Table 3 also includes a restricted version of model specification (model 1) without interactions between all the credence attributes included in experiment 2 and the dummy variable to differentiate households that received additional information regarding the credence attributes (sanitary control, meat maturation, animal welfare, and traceability). A log-likelihood ratio test was used to compare the restricted model (model 2) with the unrestricted model (model 1), where the restricted model hypothesizes no effect of additional information on consumers’ WTP for the credence attributes. The null hypothesis that the restrictions are valid was rejected ; thus, this provides evidence that information efforts can affect WTP values for credence attributes.
Focusing on the parameters of the interactions between intrinsic attributes and the experiment 2 dummy (d expe2 ) (in models 1 and 2), all the parameters are significant at the 0.05 level. Moreover, the magnitude of the coefficients suggests a reduction in the absolute value of the WTP mean estimates for the intrinsic attributes once information about the extrinsic attributes is added to the experiments. This is strong evidence that WTP values for product attributes differ depending on the attributes considered in an experiment, even if a constant price coefficient is assumed for the estimation of WTP values. The significance of the coefficient related to the price term interacted with the experiment 2 dummy in models 1 and 2 also provides evidence of differences of price coefficients across experiments.
6.5. Willingness-to-pay values
Table 4 summarizes WTP mean values across experiments estimated using the results of model 2 in Table 3. When considered alone (in experiment 1), mean WTP premiums and discounts for intrinsic attributes are very high. Relative to beef of pale color, consumers are willing to pay, on average, $4.87/lb. more for bright red beef and about $4.20/lb. less for dark red beef. Consumers are also willing to pay, on average, $3.53/lb. more dollars for beef with few muscle fibers than for beef with visible muscle fibers. Given the observed average market prices of $4.05/lb., these values suggest a strong preference for products with high-quality intrinsic attributes (bright red beef and few muscle fibers).
Table 4. Estimated mean willingness-to-pay (WTP) values ($/lb.)

Note: Standard errors of the mean WTP values are in parentheses.
WTP premium and discount values for the intrinsic attributes are reduced significantly once the credence attributes are included in the second choice experiment; however, in reference to current market prices, they are still important. For example, the mean WTP premium for bright red beef relative to pale color beef gets reduced to about $2.20/lb., less than half the WTP premium found in the first experiment. The estimated WTP values for the credence attributes also suggest that consumers are willing to pay premiums for these attributes. For consumers with no additional information regarding credence attributes, sanitary control was the credence attribute with the highest estimated mean WTP premium ($2.69/lb.), followed by animal welfare ($2.31/lb.), beef maturation ($0.62/lb.), and traceability ($0.36/lb.). WTP values for sanitary control, maturation, and traceability increase when additional information is provided. On the other hand, the mean WTP premium for animal welfare decreases with additional information. The result of beef maturation more than duplicates with additional information, making it now the credence attribute with the second-highest mean WTP. The final relative importance of WTP values for sanitary control and maturation in the second experiment could be revealing that consumers have a higher preference for beef products with attributes more closely (or easily) associated with the sensorial characteristics of beef and with human health. Overall, these results provide evidence of Ecuadorian consumers’ strong preferences for high-quality intrinsic and credence beef attributes.
6.6. Random effects regression results
Table 5 presents the results of the regression analysis for the relationship between WTP values for the credence attributes and consumers’ characteristics (see Table 5 for descriptive statistics). Dummy variables were included for sanitary control, meat maturation, and animal welfare; therefore, traceability is the baseline attribute.
Table 5. Credence attributes willingness-to-pay regression results

Note: Asterisks (***, **, and *) indicate significance the 1%, 5%, and 10% level, respectively.
We find that even after controlling for a large set of household-related factors, there are large differences in households’ WTP for sanitary control, meat maturation, and animal welfare relative to the WTP for the traceability attribute. Households’ characteristics like age, college education, and income were found to have a statistically significant association with households’ WTP for the credence attributes included; however, only education was found to be economically important: college-educated respondents are willing to pay $0.22 more for the credence attributes. On the other hand, each additional year of age is only found to be associated with a $0.004 decrease in the WTP values. Similarly, at the average income level ($1,165) an additional $100 of income is found to be associated with an increase in the WTP for the credence attributes of only $0.014. It is also important to point out that we did not find evidence of a statistically significant association between WTP for the credence attributes and location of the household.
We also found that negative perceptions about the healthiness of beef products and dissatisfaction with the beef quality available in the market have statistically and economic significant associations with households’ WTP for credence attributes. Households that perceive beef products as unhealthy are willing to pay $0.12 less for the credence attributes relative to households that do not have this perception. The WTP for credence attributes of households that are not satisfied with the quality of local beef (only 5% of the sample) is $0.40 lower than the WTP of the rest of households. These results are contrary to expected and can be understood as a paradox reflecting consumers’ rejection of meat products (Latvala, Reference Latvala2010). In other words, when perceptions are very negative, consumers may tend to reject the product, and this discourages their WTP.
7. Conclusions
In spite of the bad experiences with beef quality, overall beef quality perception in Ecuador was good, which does not provide support for hypothesis 1. This is likely because of the lack of a benchmarking on beef quality. From our results, we can conjecture that the relatively low per capita beef consumption in Ecuador is not driven by a poor overall quality perception of Ecuadorian beef but by a perception of beef as a not very healthy food product. Still, results of the choice experiments reveal strong preferences for high-quality intrinsic beef attributes (bright red beef and few muscle fibers), which suggests the potential of Ecuadorean consumers for identifying these characteristics as signals of good quality when they see them. This also indicates the presence of a market for the production and marketing of beef products with these attributes.
Although most households show little understanding of credence attributes, they have positive and economically significant WTP values for all the credence attributes considered in the study—sanitary control, meat maturation, animal welfare, and traceability—which supports hypothesis 2. This suggests potential premiums for products marketed highlighting these attributes (if currently present) and, as in the case of intrinsic beef attributes, a potential market for products with these attributes. From a policy perspective, the positive average WTP values for the credence attributes also reveal some potential welfare enhancing effects, for a large proportion of consumers, of improvements in beef quality through policy and regulatory actions.
The results of the regression analysis only identified a few household-related variables affecting the WTP values for the credence attributes. College education as well as negative perceptions regarding the healthiness and quality of local beef were identified as variables affecting the WTP values for these attributes. The effect of the negative perceptions is, however, contrary to expectations, and it can be revealing that consumers with those perceptions may tend to reject beef products, which then discourages their WTP values. Although these results provide important information for the design of marketing campaigns aimed at increasing demand for beef in Ecuador, more work is needed to better understand the source of the observed heterogeneity in WTP values for the attributes.
Our results also indicate that even limited educational efforts regarding beef credence attributes can have significant effects on the WTP values for these attributes (support for hypothesis 3), suggesting that consumers could indeed demand better-quality beef if they learned more about beef quality. More work is needed to further evaluate the effect of different information efforts in preferences for these attributes using alternative information formats and avenues.
In summary, results from this study suggest that consumers are, on average, willing to pay premiums for higher-quality beef and, for most credence attributes, such premiums increase with additional information intended to educate the consumer. Consequently, the study provides evidence that there is a potential market for increased-quality beef in Ecuador, and that consumers can indeed play a role in the beef supply chain, a role that becomes stronger as they receive more education and as they are exposed to better-quality beef. It is important to point out also that results of this study are important not only for the Ecuadorian beef industry but also for other beef producing and exporting countries because most experts expect a higher growth in demand for protein in developing countries (Schoroeder, Tonsor, and Mintert, Reference Schoroeder, Tonsor and Mintert2013). Our results suggest a potential increase in demand not only for more protein but also for high-quality protein products.
Finally, we need to note several limitations of our study. First, although the research design using two sequential experiments was meant to be realistic and has been used in previous studies (e.g., Mattea et al., Reference Mattea, Franceschinis, Scarpa and Thiene2016), it could have introduced some problems related to fatigue or cumulative cognitive burden. To minimize this problem, consumers were only given six choice sets in the first experiment and eight in the second experiment. Therefore, the total number of choice sets is within the range of choice sets used in most studies (Louviere, Hensher, and Swait, Reference Louviere, Hensher and Swait2000). However, we cannot rule out that this sequential design might have been the source of the large differences in the estimated price parameters across choice experiments. Second, as is common practice in marketing research, the setting of the choice experiment focuses only on the trade-off between quality and price, and potential adjustments to the quantity purchased are not considered explicitly (Corsi, Reference Corsi2007). Future research on the impact of quality improvements should adjust procedures to incorporate and model potential adjustments to quantities purchased.
Acknowledgments
We thank two anonymous reviewers for their comments and suggestions.
Financial support
This work was supported by the Global Development Network (GDN) under research grant GDN/GRANT/2015-16/329/AMC-ORD/ESPAE Graduate School of Management, ESPOL; by the Escuela Superior Politécnica del Litoral (ESPOL) under the project “Análisis de la Competitividad y Productividad de la Ganadería de Carne en el Litoral Ecuatoriano”; and by Texas Tech University.
Conflict of interest
None.
Appendix
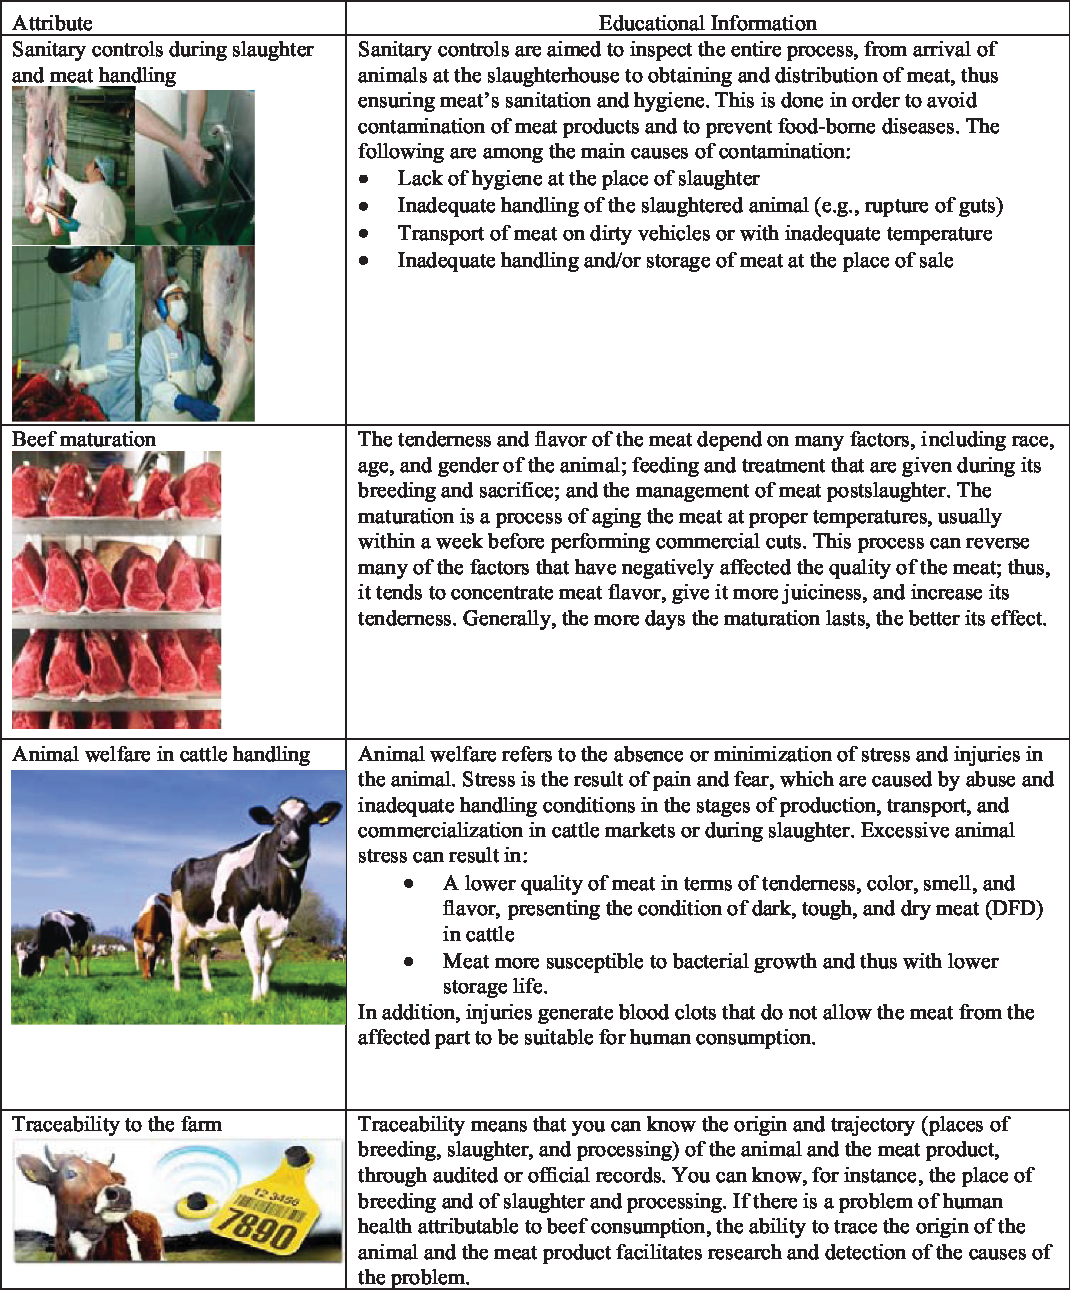
Figure A1. Educational information on credence attributes.


 Open access