


Introduction
What is wisdom and how is it measured? Despite the long history of religious and philosophical literature on wisdom, empirical research in this area has been a relatively recent phenomenon, starting in the 1970s. However, the scientific publications on wisdom have been increasing rapidly, especially during the last decade (Jeste and Lee, Reference Jeste and Lee2019). A special issue of a major journal, Psychological Inquiry, on Wisdom was published in 2020 (Grossmann et al., Reference Grossmann2020; Jeste et al., Reference Jeste, Lee, Palmer and Treichler2020a). Wisdom measures are increasingly being used to study factors that promote mental health and optimal aging, and have been shown to be associated with a variety of positive outcomes such as happiness, mental and physical health, and self-rated successful aging (Ardelt and Jeste, Reference Ardelt and Jeste2016; Ardelt, Reference Ardelt1997; Etezadi and Pushkar, Reference Etezadi and Pushkar2013; Grossmann et al., Reference Grossmann2020; Jeste and Lee, Reference Jeste and Lee2019). Notwithstanding the progress in the research on wisdom, measures of wisdom have not yet found wide usage in large cross-sectional and longitudinal studies. One possible reason has been a lack of brief but validated measures of wisdom that can be used in regular research or clinical investigations. Measures of wisdom typically include a relatively large number of items (i.e., 28–40 items) (Ardelt, Reference Ardelt2003; Thomas et al., Reference Thomas2019a; Webster, Reference Webster2003), which can consume precious time and effort in large-scale research studies. In recent decades, in nearly all domains of measurement, there has been a growing trend towards developing short but reliable measures that can be more easily worked into a study’s assessment battery (Cella et al., Reference Cella2019)
Wisdom is a complex, multi-component personality trait (Bangen et al., Reference Bangen, Meeks and Jeste2013). Our group created the 24-item San Diego Wisdom scale (Thomas et al., Reference Thomas2019a) that assesses six components of wisdom. The self-reflection component measures the desire and ability to understand oneself and one’s actions at a deeper level. It assesses preferences with regard to understanding one’s own thoughts, motivations, and behaviors. The pro-social behaviors component includes empathy, compassion, altruism, and sense of fairness. It evaluates one’s sense of the ability to maintain positive social connections, as well as compassion or conscientious behavior. The emotional regulation component measures the ability to regulate negative emotions that interfere with decision making. It assesses one’s sense of being able to effectively manage negative emotions and emotional stress and to favor positive feelings. The acceptance of divergent perspectives component examines acceptance of other value systems and interest in learning others’ perspectives. It measures one’s openness to and comfort with values and perspectives that may be different from one’s own values and perspectives. The decisiveness component evaluates the ability to make decisions in a timely manner. It also assesses one’s comfort with decision making. The social advising component refers to the ability to give good advice to others.
Subsequently, because of an increasing number of publications suggesting that spirituality is also a component of wisdom, we added this new component to the SD-WISE (Jeste et al., Reference Jeste2021). Although a newer component of the SD-WISE, spirituality has been considered to be a component of wisdom for centuries. It was an integral part of wisdom in religious scriptures (Achenbaum and Orwoll, Reference Achenbaum and Orwoll1991; Jeste and Vahia, Reference Jeste and Vahia2008). In a review of the modern empirical literature on wisdom (Bangen et al., Reference Bangen, Meeks and Jeste2013), we found a number of reports that included spirituality in the definition of wisdom (Hershey and Farrell, Reference Hershey and Farrell1997; Jason et al., Reference Jason, Reichler, King, Madsen, Camacho and Marchese2001; Perry et al., Reference Perry, Komro, Jones, Munson, Williams and Jason2002; Wink and Helson, Reference Wink and Helson1997). Several other studies have reported a significant correlation between spirituality and greater well-being (Koenig, Reference Koenig2012; de Jager Meezenbroek et al., Reference de Jager Meezenbroek, Garssen, van den Berg, van Dierendonck, Visser and Schaufeli2012), similar to the association between wisdom and mental health discussed earlier in this article. The spirituality component measures connectedness with oneself, with the nature, or with the transcendent like the soul or God. We labeled the total score on this expanded 28-item scale the Jeste-Thomas Wisdom Index or JTWI.
In previous work, we have shown that scores on the original SD-WISE are reliable, valid, and have positive correlations with measures of good mental health and well-being as well as negative correlations with measures of poor mental health (Jeste et al., Reference Jeste2021). The scale is increasingly being used in large national and international studies (Jeste et al., Reference Jeste, Lee, Palmer and Treichler2020a, Reference Jeste2020b; Nguyen et al., Reference Nguyen2020), biological research (Grennan et al., Reference Grennan2021; Nguyen et al., Reference Nguyen2021; Thomas et al., Reference Thomas2019b), and clinical trials (Treichler et al., Reference Treichler2020), including a recent study that demonstrated positive change in specific components of the SD-WISE following a mindfulness intervention (Al-Refae et al., Reference Al-Refae, Al-Refae, Munroe, Sardella and Ferrari2021).
The SD-WISE is modestly correlated with two other measures of wisdom that have been reported to have good psychometric properties: Ardelt’s Three Dimensional Wisdom Scale (3D-WS; Ardelt, Reference Ardelt2003) and Webster’s Self-Assessed Wisdom Scale (SAWS; Webster, Reference Webster2003). The 3D-WS is a 39-item measure, and the SAWS is a 40-item measure. Thus, the SD-WISE, 3D-WS, and SAWS are all quite long relative to many commonly used outcome measures. Our group, in collaboration with Ardelt, recently developed a shortened 12-item version of the 3D-WS (Thomas et al., Reference Thomas, Bangen, Ardelt and Jeste2017). A similar effort reduced the SAWS to 15 items (Leeman et al., Reference Leeman, Knight, Fein, Winterbotham and Webster2021). However, the 3D-WS, SAWS, and SD-WISE differ in several important ways. Most notably, the scales assess different subcomponents of wisdom and are based on different theoretical models. Total scores from the measures – while moderately correlated – share less than 25% of variance in common (Thomas et al., Reference Thomas2019a). As such, 3D-WS, SAWS, and SD-WISE scores are not interchangeable. Moreover, the scales have not been psychometrically linked. Thus, given the increasing popularity of the SD-WISE, there is a need for an abbreviated version.
The current study aimed to develop a reliable and valid abbreviated version of SD-WISE with only one item for each of the seven components mentioned above. A 7-item wisdom measure would be comparable to many existing short-form outcome measures relevant to health, such as the fixed-item NIH Patient-Reported Outcomes Measurement Information System (PROMIS) measures (Cella et al., Reference Cella, Gershon, Lai and Choi2007).
Methods
Sample and Design
Participants included 2093 people, aged 20–82 years, recruited and surveyed through the online crowdsourcing platform Amazon Mechanical Turk (MTurk – AMT). MTurk – AMT has been used in a number of large cross-sectional studies of various health measures (Buhrmester et al., Reference Buhrmester, Kwang and Gosling2011; Litman et al., Reference Litman, Robinson and Rosenzweig2015; Mason and Suri, Reference Mason and Suri2012; Nguyen et al., Reference Nguyen2020; Sprouse, Reference Sprouse2011). Our Inclusion criteria were: 1) Age ≥20 years, 2) English-speaking, 3) resident of the United States, and 4) MTurk – AMT Human Intelligence Task (HIT) approval rating ≥90%, indicating that the respondent’s previous HITs had been approved by requestors at least 90% of the time. AMT has been shown to produce high quality data; however, a small proportion of responses could be invalid due to inattentiveness or other reasons. Therefore, to further ensure data validity, we applied a data cleaning procedure to help identify and remove participants who provided impossible or highly implausible responses to specific survey questions, consistent with the methods employed in a number of published AMT studies by various investigators (Coppock, Reference Coppock2019; Hauser and Schwarz, Reference Hauser and Schwarz2016; Nguyen et al., Reference Nguyen2020; Peer et al., Reference Peer, Vosgerau and Acquisti2014). Specifically, we excluded participants who 1) completed the survey in <390 seconds (N = 297), 2) reported a height and weight resulting in a BMI < 16 (N = 12), 3) reported their height at <3 feet or >7 feet (n = 3), or 4) reported living with ≥20 people in their household (n = 3). Please note that these were not a priori exclusion criteria, but were based on post-hoc finding of a small minority of surveys that included responses that were far beyond the reported range in this population, and therefore, appeared to be extremely unlikely to be valid, per other participants’ responses. Thus, data were excluded from a total of 307 respondents, resulting in a final sample of 1786 participants whose data were included in the current analysis.
The participants’ mean age was 46.3 years, with SD 14.6; 55% were women; 77% were Caucasian, 9% Hispanic/Latinx, 7% African American, 4% Asian American, and 3% belonged to another race/ethnicity. In terms of education, 44% subjects had a high school diploma, 41% had a bachelor’s degree, and 14% had masters or doctorate. About half (51%) were married or cohabitating.
The study was approved by the UCSD Office of IRB Administration (OIA) (also called Human Research Protections Program); with a waiver of signed consent under the provisions of 45 CFR 46.104(d), Category 2.
Measures
As described above, we used the 28-item SD-WISE with all the seven components of wisdom. Each component includes four items. The items are rated from 1 or “strongly disagree” to 5 or “strongly agree”. Negatively worded items are reverse scored. The seven component scores are then calculated by averaging the four included items, and an overall wisdom score (JTWI) is calculated by averaging all 28 items.
Convergent validity measures included the two-item Patient Health Questionnaire Depression Module (PHQ-2; Kroenke et al., Reference Kroenke, Spitzer and Williams2001), the 12-Item Medical Outcomes Study Short Form Health Survey – Physical and Mental Components (MOS-12; Ware and Sherbourne, Reference Ware and Sherbourne1992), the two-item Connor-Davidson Resilience Scale (CD-RISC; Campbell-Sills and Stein, Reference Campbell-Sills and Stein2007), the Center for Epidemiologic Studies Depression Scale Happiness Factor (CESD-HS; Fowler and Christakis, Reference Fowler and Christakis2008), the two-item Generalized Anxiety Disorder Scale (GAD-2; Kroenke et al., Reference Kroenke, Spitzer, Williams, Monahan and Löwe2007), the four-item version of the UCLA Loneliness Scale (UCLA-4) for loneliness (UCLA-4; Russell et al., Reference Russell, Peplau and Ferguson1978), and the Duke Social Interaction Subscale (DSSI; Koenig et al., Reference Koenig, Westlund, George, Hughes, Blazer and Hybels1993). We expected positive correlations with MOS-12, CD-RISC, CESD-HS, and DSSI, and negative correlations with PHQ-2, GAD-2, and UCLA-4.
Analyses
Our goal was to create a 7-item version of the SD-WISE (i.e., SD-WISE-7), with one item for each component of wisdom. Several planned psychometric analyses were used to select the final 7-item scale. To begin, we evaluated the item properties of all 28 SD-WISE items in order to ensure good psychometric properties. Specifically, in order to evaluate item properties, we fitted item response theory (IRT) graded response models to the data. Discrimination parameters indicate the strength of association between the latent trait measured by a scale and endorsement of the response options. Higher discrimination values are preferred. Threshold parameters indicate the extent to which higher levels of a trait are required to endorse higher item response options. For ordered categorical response data, widely spaced and balanced (i.e., both positive and negative) threshold parameters are preferred. Parameters were estimated using the R ltm package (Rizopoulos, Reference Rizopoulos2006). Reverse-coded items were re-scored prior to analyses. Next, in order to evaluate dimensionality, we fitted unidimensional confirmatory factor models to all possible seven-item combinations of SD-WISE items, always drawing one item from each of the seven subscales to ensure balanced content. Models were fitted to the data using the R lavaan package (Rosseel, Reference Rosseel2012) with full information maximum likelihood estimation and robust standard errors (MLR). (Both robust maximum likelihood and diagonally weighted least squares estimation can be used for categorical data. Although results are generally comparable, both have strengths and weaknesses (Li, Reference Li2016)). Model fit was based on the comparative fit index (CFI), Tucker-Lewis index (TLI), and root mean square error of approximation (RMSEA) statistics. CFI and TLI values of approximately 0.95 or greater and RMSEA values of approximately 0.06 and lower are typically considered excellent; CFI and TLI values above 0.90 and RMSEA values below 0.08 are considered adequate (Brown, Reference Brown2015; Hu and Bentler, Reference Hu and Bentler1999). Next, we used IRT to examine the psychometric properties of the newly created 7-item SD-WISE. Reliability coefficient omega (ω) was estimated using the R psych package (Revelle, Reference Revelle2018). Although coefficient alpha has more commonly been used to estimate reliability, McDonald’s omega makes fewer assumptions about the data, and therefore provides a more accurate index of reliability (McDonald, Reference McDonald1999). In particular, omega corrects for underestimation of reliability and is therefore preferred by methodologists (Hayes and Coutts, Reference Hayes and Coutts2020). In general, reliability values of 0.7 or greater are considered acceptable (Haynes et al., Reference Haynes, Smith and Hunsley2011). In order to evaluate the validity of the SD-WISE-7, we correlated 7-item total scores (JTWI) with the original 28-item SD-WISE scores, as well as demographic and mental health variables.
Results
Item discrimination parameter estimates for all 28-items of the SD-WISE-28 are reported in Table 1. Notably, all of the discrimination parameters are positive, and most have modest to large effect sizes, suggesting that the items are good indicators of their measured constructs. Only one item – item 14 from the Acceptance of Divergent Perspectives subscale – falls below one. The threshold parameters are generally well-spaced, suggesting broad coverage of trait levels within each subscale. In general, the item parameter estimates did not indicate that any item should be excluded from inclusion in the SD-WISE-7.
Table 1. Item discrimination parameter estimates for the SD-WISE subscales
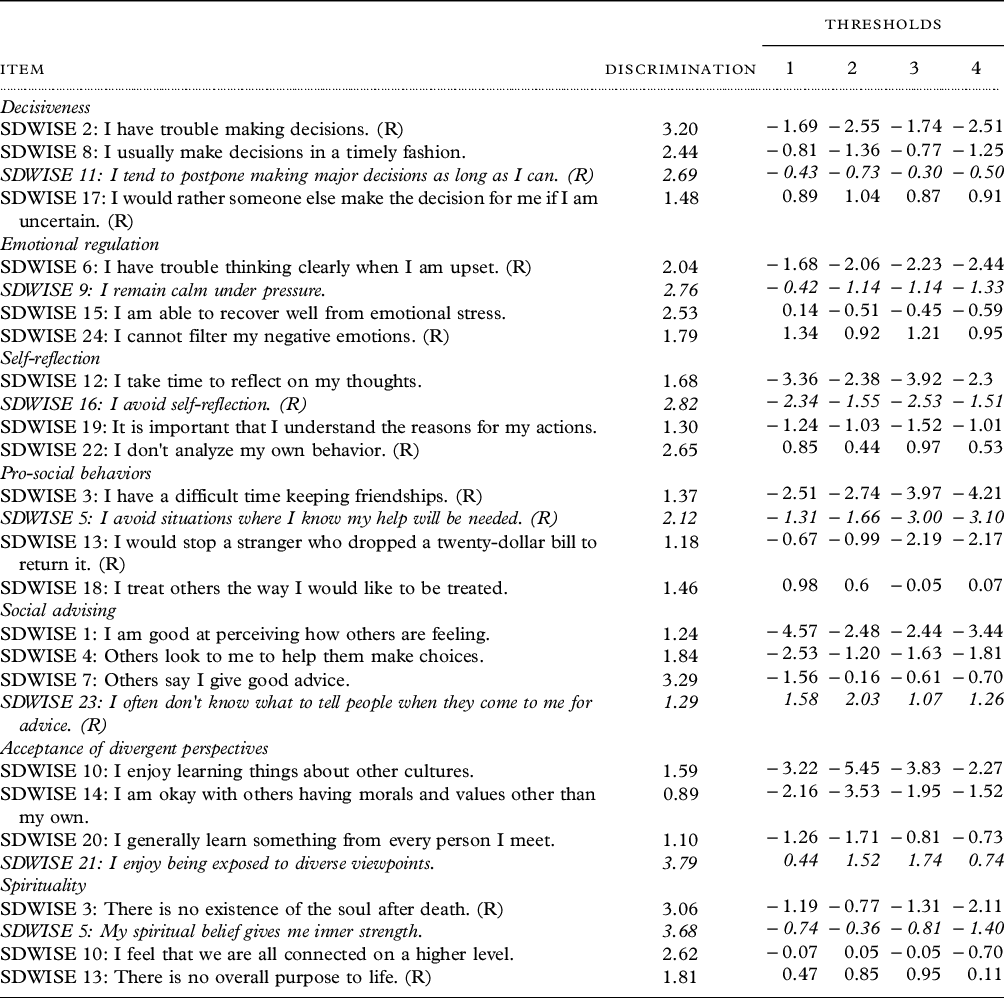
The italicized items were ultimately selected. (R) = reversed coded.
Model fit statistics for the best five combinations of items are reported in Table 2. In terms of goodness-of-fit overall, all five models had excellent to good RMSEA values and adequate CFI values. TLI values are slightly below the border of acceptable fit, but close enough to the approximate value to be considered marginally acceptable (particularly for the best fitting item combination). As can be seen, model fit statistics were very similar between these top five solutions, meaning that any of these combinations of items would perform adequately. Moreover, all combinations included item 11 (“I tend to postpone making major decisions as long as I can.” Reverse-coded) for the Decisiveness subscale, item 16 (“I avoid self-reflection.” Reverse-coded) for Self-Reflection, item 5 (“I avoid situations where I know my help will be needed.” Reverse-coded) for Pro-Social Behaviors, and item 23 (“I often don't know what to tell people when they come to me for advice.” Reverse-coded) for Social Advising, suggesting that these items were consistently optimal indicators of the constructs assessed. For emotional regulation, the choice was between item 15 (“I am able to recover well from emotional stress.”) and item 9 (“I remain calm under pressure.”). Ultimately, we chose item 9 because it had a larger subscale discrimination parameter, had a shorter word length, and was judged by the authors to have better content validity (i.e., calm response as opposed to emotional recovery). For Acceptance of Divergent Perspectives, the choice was between item 21 (“I enjoy being exposed to diverse viewpoints.”) and item 10 (“I enjoy learning things about other cultures.”). We chose item 21 because it had a larger subscale discrimination parameter and was judged to have better content validity (i.e., explicit focus on diverse ideas). Finally, for spirituality, the choice was between items 5 (“My spiritual belief gives me inner strength.”) and 3 (“There is no existence of the soul after death.”). We chose item 5 because it had a larger subscale discrimination parameter, had a shorter word length, and was judged to have better content validity (i.e., a greater focus on belief rather than on religious archetypes).
Table 2. Unidimensional model fit indices for the top five combinations of items

D = Decisiveness; ER = Emotional Regulation; SR = Self-Reflection; PSB = Pro-Social Behaviors; SA = Social Advising; TDV = Tolerance for Divergent Values; S = Spirituality. The italicized combination of items was ultimately selected.
Item discrimination parameter estimates for the SD-WISE-7 are reported in Table 3. As with subscale item analyses, the threshold parameters are generally well-spaced, suggesting broad coverage of trait levels (i.e., people at mostly all levels of wisdom are expected to be measured with similar precision). The largest discrimination parameters were for “I often don't know what to tell people when they come to me for advice”, “I avoid situations where I know my help will be needed”, and “I tend to postpone making major decisions as long as I can”, indicators of social advising, pro-social behavior, and decisiveness, respectively. More modest discrimination parameters were produced for “I remain calm under pressure”, “I avoid self-reflection”, and “I enjoy being exposed to diverse viewpoints”, indicators of emotional regulation, self-reflection, and acceptance of divergent perspectives, respectively. The smallest discrimination parameter was for the spirituality item, “My spiritual belief gives me inner strength”.
Table 3. Item discrimination parameter estimates for the seven-item SD-WISE

The italicized items were ultimately selected. (R) = reversed coded.
Reliability coefficients for the 28- and 7-item SD-WISE scale scores were ω = 0.84 and 0.74, respectively. Thus, while the 28-item SD-WISE produced better reliability, the 7-item SD-WISE is still acceptably reliable by conventional standards.
Concurrent validity, demographic, and construct validity correlations for the 28- and 7-item versions of the SD-WISE are reported in Table 4. The correlation between 28- and 7-item SD-WISE total scores was 0.92, indicating that the reduced-length scale is an excellent indicator of the original measure. Moreover, the patterns of correlations between 28- and 7-item SD-WISE total scores and both demographic and validity variables were largely similar. Both measures were positively correlated with age, negatively correlated with male sex, and, weakly, but positively correlated with education. Additionally, both measures were negatively correlated with loneliness (UCLA-4), depression (PHQ-2), and anxiety (GAD-2), and positively correlated with mental well-being (MOS-12 Mental), resilience (CD-RISC), happiness (CESD-HS), and social interaction (DSSI). Both were very weakly correlated with physical well-being (MOS-12 Physical).
Table 4. Concurrent validity, demographic, convergent validity correlations

CI5% = lower 5% confidence interval; CI95% = upper 95% confidence interval. CD-RISC = Connor-Davidson Resilience Scale; CESD-HS = Center for Epidemiological Studies Depression Scale Happiness Factor; DSSI = Duke Social Support Index; GAD-2 = 2-item Generalized Anxiety Disorder Scale; MOS-12 = Medical Outcomes Survey Short Form; PHQ-2 = 2-item Patient Health Questionnaire; SDWISE-28 = 28-item San Diego Wisdom Scale; UCLA-4 = 4-item UCLA Loneliness Scale.
Discussion
We aimed to develop and test a shortened, 7-item version of the 7-subscale 28-item SD-WISE. Using several psychometric analysis techniques, we selected one item from each of the seven SD-WISE subscales. The selected combination of items produced acceptable unidimensional model fit. Thus, the new 7-item version of the SD-WISE – the SD-WISE-7 – measures a single latent factor – the putative Wisdom factor underlying the JTWI. Item statistics for the SD-WISE-7 suggested that most items were strong indicators of wisdom. A notable exception was the spirituality item, which produced a more modest discrimination parameter. In fact, this finding in similar to our previous work that also found spirituality to be a relatively weak, although significant, indicator of the total score on the 28-item SD-WISE (Jeste et al., Reference Jeste2021)
Reliability analysis for the SD-WISE-7 was ω = 0.74 which is generally considered acceptable for research purposes, but should be acceptably reliable (Haynes et al., Reference Haynes, Smith and Hunsley2011). Statistical power for detecting significant effects should be reasonable for moderate to large samples (but ultimately depends on effect size). However, studies employing small samples may wish to use the 28-item SD-WISE, which, as would be expected, produces more reliable scores.
Demographic, construct validity, and concurrent validity correlations indicated that the 28- and 7-item SD-WISE are both very highly correlated and produce a nearly identical pattern of correlations with demographic and validity variables. Thus, the results observed using the 28- and 7-item SD-WISE total scores (JTWIs) should be comparable. In particular, as with the SD-WISE-28, the results suggest that the SD-WISE-7 is most strongly and positively correlated with resilience, happiness, and mental well-being, as well as most strongly and negatively correlated with loneliness, depression, and anxiety. This pattern is broadly consistent with our previous findings that wisdom is associated with a variety of positive traits and outcomes (Ardelt and Jeste, Reference Ardelt and Jeste2016; Ardelt, Reference Ardelt1997; Etezadi and Pushkar, Reference Etezadi and Pushkar2013; Grossmann et al., Reference Grossmann2020; Jeste and Lee, Reference Jeste and Lee2019).
Despite this, because lower reliability implies greater error and smaller effect size, associations between SD-WISE-7 scores and other variables should generally be smaller than associations between SD-WISE-28 scores and other variables. In fact, this phenomenon is shown in Table 4, where the SD-WISE-7 validity correlations are consistently smaller (albeit slightly) than SD-WISE-28 validity correlations.
Although response times were not available for the current data, our past research suggests that SD-WISE items take an average of 5.5 seconds to complete. Thus, the SD-WISE-7 is expected to have an administration time of about one minute, and should be approximately 2–3 minutes faster to complete in comparison to the SD-WISE-28.
Several studies have reported an association of wisdom with aging, although much of this literature is based on cross-sectional research. Thus, the current study’s findings of positive association of JTWI with aging, female sex, and with positive characteristics like mental well-being, resilience, happiness, and social interaction, and negative association with depression and anxiety are consistent with much of the published research on wisdom (Ardelt and Jeste, Reference Ardelt and Jeste2016; Ardelt, Reference Ardelt1997; Etezadi and Pushkar, Reference Etezadi and Pushkar2013; Grossmann et al., Reference Grossmann2020; Jeste and Lee, Reference Jeste and Lee2019). Particularly notable is the relationship with loneliness. Several US-based studies have reported a significant inverse correlation between SD-WISE total scores (JTWI) and loneliness (Jeste et al., Reference Jeste2021; Lee et al., Reference Lee2019; Nguyen et al., Reference Nguyen2020). Another study with a different sample from our research group (Jeste et al., Reference Jeste2020b) compared older adults from the USA with those from the Cilento region of Italy using English and Italian versions, respectively, of these scales. The study found that the basic constructs of wisdom and loneliness seemed to be similar in the two cultures, with a consistent inverse correlation between them.
Two recent biological investigations using SD-WISE and loneliness also showed inverse biological correlates of these entities. An EEG study found that wisdom was related to enhanced response speed biased by happy emotions whereas loneliness was associated with reduced response speed biased by angry emotions, and both invoked similar neural circuits (i.e., temporo-parietal junction) (Grennan et al., Reference Grennan2021). A study of gut microbiome found that wisdom and loneliness were associated with higher versus lower, respectively, levels of alpha and beta diversity, which are known to be markers of better versus worse health, respectively (Nguyen et al., Reference Nguyen2020).
This study has several strengths including a relatively large size of the sample that included adults across the lifespan and use of multiple validity measures. Nonetheless, it does have some limitations. The study sample was predominantly comprised of people from non-Latinx white race/ethnicity and high levels of education relative to the general US public. Thus, the findings may not generalize to people from diverse socioeconomic or other racial/ethnic groups. All of the measures used were based on self-report and thus associations could be affected by response biases such as social desirability and/or response patterns (e.g. tendency to use or avoid extreme points in ratings, tendency to rate all scales in the “negative” or “positive” direction, etc.). However, in previous research, we have found that social desirability bias does not play a substantial role in self-reports of well-being and related measures (Dawes et al., Reference Dawes, Palmer, Allison, Ganiats and Jeste2011). While objective measures would be helpful, there are currently no validated objective measures of wisdom or other personality traits. Finally, this was a cross-sectional study. Longitudinal investigations are necessary to link different variables in terms of temporal sequences of causal associations. A limitation of using the SD-WISE-7 is that it is less suited for analysis of the seven individual subdomains of wisdom. Although each item does indicate a unique aspect of wisdom, single item indicators are expected to be less reliable measures of composite variables in comparison to multiple-item indicators (McDonald, Reference McDonald1999). Thus, investigators who are interested in studying subcomponents of wisdom, and not the just the broad construct, are advised to use the full 28-item version (SD-WISE-28, Thomas, et al., Reference Thomas2019a). Finally, while two model indices were favorable, another suggested borderline unacceptable fit for a single factor model of the SD-WISE-7. Thus, future studies should explore whether the single factor model for SD-WISE-7 total scores replicates adequately in new samples.
There is a need for large-scale multidimensional longitudinal studies of wisdom along with other measures of positive and negative well-being using biomarkers. Brief but validated measures such as the JTWI would be of practical value for such investigations. Similarly, while a number of interventions to improve components of wisdom have been shown to be effective in randomized controlled trials – i.e. wisdom is potentially modifiable (Lee et al., Reference Lee2020), it is important to examine changes in scores such as JTWI along with neurobiological assessments like brain imaging.
Acknowledgments
This work was supported, in part, by the National Institute of Mental Health (K23MH119375-01 to EEL); the VA San Diego Healthcare System; and the Stein Institute for Research on Aging (Director: DVJ) at the University of California San Diego.
Conflict of interest
The authors have declared that there are no conflicts of interest in relation to the subject of this study.
Description of authors’ roles
MT: Design, analysis, writing.
BP: Design, critical review.
EL: Design, critical review.
RD: Data collection/management, writing, critical review.
JL: Analysis, critical review.
XT: Analysis, critical review.
DJ: Design, analysis, writing.


 Open access