


Renal cell carcinoma (RCC), also called renal adenocarcinoma or hypernephroma, is a cancer originating in the lining of the tubules of the kidney. It accounts for approximately 85 percent of renal cancers and 3 percent of all adult cancers globally. Clear cell RCC is the most common sub-type of RCC, accounting for approximately 80 percent of renal cancers (1).
Local clinical experts estimate that up to 160 new cases of advanced and/or metastatic RCC are diagnosed annually in Singapore. While there is substantial heterogeneity among these patients, their prognosis is typically poor. The American Cancer Society reported a 5-year survival rate of 8 percent for patients with tumor, node, and metastasis (TNM) stage IV disease at diagnosis (2).
Interferon-alfa has been superseded by tyrosine kinase inhibitors (TKIs), sunitinib and pazopanib, in recent years as first-line pharmacological standard of care for patients with advanced and/or metastatic RCC in Singapore (3). However, the cost of these treatments is high and can be unaffordable for patients with low incomes. In the public healthcare sector, government subsidies are provided to eligible patients for drugs which are considered cost-effective and fill an unmet clinical need, following a formal technology evaluation, and deliberation of the evidence by a national committee. To the best of our knowledge, there are no published economic evaluations of TKIs for advanced and/or metastatic RCC in Singapore. Therefore, this study was conducted to evaluate the cost-effectiveness of sunitinib versus interferon-alfa with a view to inform local drug subsidy decisions for TKIs.
Methods
Clinical Effectiveness
A systematic literature search was conducted in PUBMED (Medline) and Embase electronic databases to identify all relevant studies published up until August 2017 which compared sunitinib with interferon-alfa for the treatment of RCC. Only one trial, the sunitinib pivotal trial (ClinicalTrials.gov numbers NCT00098657 and NCT00083889) was identified (4;5). An additional trial, COMPARZ, which compared sunitinib with pazopanib for RCC, was the only other relevant trial retrieved (6;7).
The sunitinib pivotal trial was an open-label, phase III, randomized controlled trial (RCT) that compared sunitinib (administered orally, in 6-weekly cycles of sunitinib 50 mg once daily for 4 weeks, followed by 2 weeks of no treatment) versus interferon-alfa (administered as a subcutaneous injection at 3 million units [MU] 3 times per week in week 1, at 6 MU 3 times per week in week 2, and then at 9 MU 3 times per week in subsequent weeks). Median progression-free survival (PFS) was 11 months for sunitinib versus 5 months for interferon-alfa (hazard ratio [HR] 0.539, 95 percent confidence interval [CI] 0.451 to 0.643; p < 0.001). Border-line statistical significance for overall survival (OS) was reported, with a median OS of 26.4 months for sunitinib and 21.8 months for interferon-alfa (HR 0.821, 95 percent CI 0.673 to 1.001; p = 0.051) (4;5).
Results of the COMPARZ trial which provides a head-to-head comparison of pazopanib versus sunitinib were also considered. In this study, pazopanib was found to be noninferior to sunitinib with respect to the primary outcome PFS (HR 1.05; 95 percent CI 0.90 to 1.22). Median OS was 28.3 months in the pazopanib group and 29.1 months in the sunitinib group (HR 0.92; 95 percent CI, 0.79 to 1.06; p = 0.24). The safety profiles of sunitinib and pazopanib were found to differ, with sunitinib associated with a statistically significant increase in risk of hand-foot syndrome, fatigue, and some hematological abnormalities such as thrombocytopenia and anemia, while pazopanib was associated with a statistically significant increase in risk of laboratory abnormalities such as increased levels of aspartate aminotransferase (AST), alanine aminotransferase (ALT), and alkaline phosphatase (6;7).
Model Structure and Outcomes
Model Structure
An Excel-based partitioned survival model was developed to assess the cost-effectiveness of sunitinib compared with interferon-alfa for the first-line treatment of advanced and/or metastatic RCC. The model included three health states: progression-free (PF), progressive disease (PD), and death (Figure 1). At the beginning of the simulation all patients were assumed to enter the model in the PF health state and could either remain in that health state or transition to PD or death at the beginning of each cycle. Patients who moved to the PD health state could stay within that health state or progress to death, but not revert back to the PF health state. The model had a time horizon of 10 years, a cycle length of 6 weeks and included a half-cycle correction.
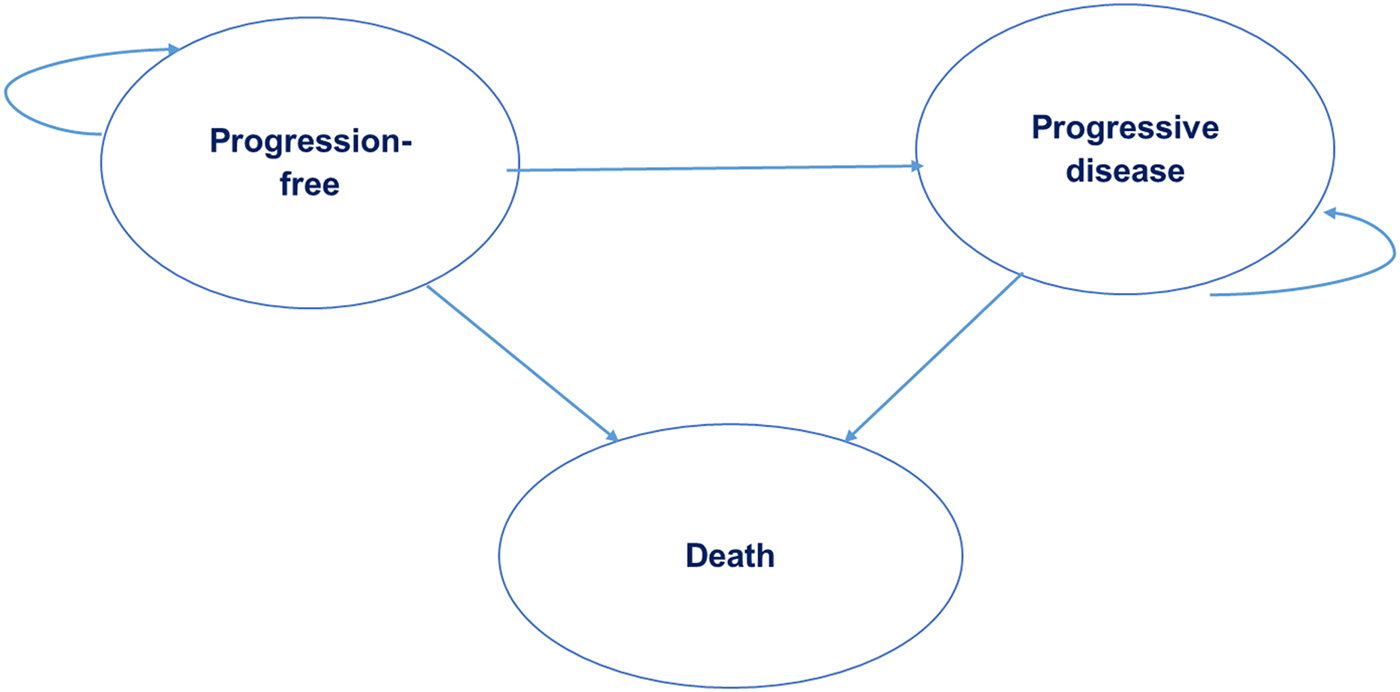
Figure 1. Partitioned survival model with three health states.
A 10-year time horizon was chosen as it reflects the timeframe by which all patients are expected to have died. This is in line with data from the sunitinib pivotal trial in which the median overall survival for patients randomized to sunitinib was 26.4 months (95 percent CI 23.0 to 32.9 months) and data from the American Cancer Society that quotes a 5-year survival rate for stage IV cancer of 8 percent (2).
A cycle length of 6 weeks was chosen because sunitinib is administered in cycles of 6 weeks duration (4 weeks of active treatment, followed by 2 weeks of no treatment).
Treatment Pathway
Patients were assumed to receive either sunitinib or interferon-alfa as first-line treatment up to first disease progression. It was assumed that patients received second-line treatment with the relative proportion of use in line with local practice (sunitinib 18 percent, pazopanib 10 percent, axitinib 11 percent, everolimus 38 percent, nivolumab 14 percent, or best supportive care [BSC] 10 percent), based on expert advice from Singaporean clinicians. All patients moved to BSC upon subsequent disease progression (third-line).
The daily sunitinib dose used in the model was a combination of the 50 mg (28 percent) and 37.5 mg (72 percent) strengths to reflect local usage patterns supported by clinical expert input and in line with Tan et al. (Reference Tan, Li and Hong8), rather than assuming all patients commence treatment with the 50-mg dose, as per the pivotal trial.
Outcomes
Analyses were conducted from the Singapore healthcare payer's perspective. The outcomes of interest were progression-free life-years, overall life-years (LYs), quality-adjusted life-years (QALYs), and the incremental cost-effectiveness ratio (ICER). In accordance with the local reference case a discount rate of 3 percent was applied to both costs and outcomes.
Model Parameters
Clinical Efficacy Data
The population assessed in the model was treatment-naïve patients with advanced and/or metastatic RCC, in line with the patient population in the sunitinib pivotal trial (4;5). The area under the curve (AUC) was used to determine the mean time that patients remained in the PF and PD health states. OS and PFS for patients receiving first-line treatments were extrapolated from the sunitinib pivotal trial (Table 1). This involved extracting individual data points from the published Kaplan-Meier (KM) curves for OS and PFS using the WebPlotDigitizer developed by Rohatgi (Reference Rohatgi9). Then, a curve fitting approach developed by Guyot et al. (Reference Guyot, Ades and Ouwens10) was used to estimate the underlying survival distribution from the digitized KM graphs.
Table 1. Model Inputs (Base-Case)
a Motzer et al., 2009 (4).
b Costs sourced from public healthcare institutions in Singapore (2017) and represent the selling prices to patients after hospital margins have been applied.
c Price charged by hospice centre in Singapore.
d Home hospice visits are a complementary service by the hospice.
CI, confidence interval; BSC, best supportive care.
Candidate functions for the parametric extrapolation were the exponential, Weibull, log-normal, log-logistic, Gompertz and generalized gamma distributions. For both PFS and OS, the Akaike Information Criterion (AIC) value for the generalized gamma distribution was the lowest amongst the six candidate functions, suggesting the best “goodness-of-fit” (Supplementary Tables 1a and 1b). However, visual inspection of the generalized gamma curve showed an appreciable extent of right-sided skewedness (i.e., elongated tail end). The base-case parametric extrapolation was, therefore, executed using a Weibull function as the tail-end was more clinically plausible compared with the generalized gamma function (Supplementary Figures 1a and 1b).
The time spent in PD was derived from the difference between the AUCs for OS and PFS. The duration of second-line treatment was based on the median PFS for patients receiving second-line treatment from the literature (Reference Motzer, Escudier and Oudard11) and was supported by local expert opinion. Second-line treatment duration was also assumed to be constant across both treatment arms, irrespective of the relative time spent in the PD state.
The parameters of the Weibull function and the hazard ratio between the treatment groups were jointly estimated. The joint estimation of Weibull survival curves is predicated upon the proportional hazards assumption which requires that the hazard rates in the treatment groups differ by a constant proportion over the observed period. Inspection of the ln(-ln S(t)) versus ln (t) graphs derived from the sunitinib pivotal trial data revealed two straight and parallel lines which confirmed the fit of the Weibull distribution and fulfilled the proportional hazards assumption (Supplementary Figures 2a and 2b).
Following subsequent disease progression after second-line treatment, patients were assumed to receive BSC as third-line therapy for their remaining time in PD. This time was calculated by subtracting the time patients spent on second-line therapy from the estimated total time spent in PD for each arm (Table 1).
Utility Values
In the absence of local data, utility values were obtained from quality-of-life utility weights used in the cost-effectiveness analysis undertaken by Remak et al. (Reference Remak, Charbonneau and Negrier12), which were obtained from the sunitinib pivotal trial (Reference Motzer, Hutson and Tomczak4) (Table 1). The utility weights in the sunitinib trial were directly elicited from patients using the EQ-5D instrument. Values for the PF health state in the sunitinib arm were higher than in the interferon-alfa arm likely due to various factors (improved efficacy, adverse event (AE) profile, larger disutility experienced by patients receiving an injectable medication (interferon-alfa) compared with orally administered sunitinib tablets, etc).
These values were further supported by statistically and clinically significant improved scores in patient-reported quality-of-life outcomes measured by the Functional Assessment of Cancer Therapy-General (FACT-G) and Kidney Symptom Index (KSI) questionnaires also administered during the trial (Reference Motzer, Hutson and Tomczak4) which reported an improved sense of well-being for patients in the sunitinib arm. In the model, the utility value for the PD state was derived by weighting it by the time spent in each line of treatment (second-line followed by BSC). This resulted in a utility value of 0.573 and 0.576 for the PD state for the interferon-alfa and sunitinib arms, respectively. Utility values from a phase II trial of second-line sunitinib in advanced and/or metastatic RCC (Reference Motzer, Michaelson and Redman13) were used to calculate utilities during second-line treatment and BSC, regardless of treatment composition.
Of note, the utilities reported by Remak et al. factored in disutilities elicited from patients who experienced AEs during the sunitinib pivotal trial. Hence additional disutilities from specific AEs were not taken into consideration in the base-case analysis to ensure that the impact of AEs on quality-of-life was not double-counted.
Cost
Only direct healthcare costs from the payer perspective (multi-payer system comprising government subsidy and insurance providers’ healthcare budgets under MediShield Life and patient co-payments [Medisave national savings scheme and out-of-pocket expenses]) were incorporated into the model including the cost of drugs, consultation visits, monitoring and BSC (Table 1).
The costs of first-line and second-line drugs used in the base-case analysis were estimated from the average selling prices to patients across all public healthcare institutions in Singapore. A weighted average cost was included for second-line treatments, incorporating the proportion of use reported by local clinicians. Chemotherapy administration fees (facility and preparation fees) were added to the cost of nivolumab (second-line treatment). All other drugs are orally administered and, therefore, were assumed to not incur administration costs.
Advice on frequency and types of relevant outpatient consultation visits, monitoring, scans, and laboratory tests for patients were sought from local oncologists. All costs were sourced from public healthcare institutions.
The health state costs comprised routine medical consultation visits, CT scans, liver function tests, thyroid function panel, full blood count, and renal panel tests. It was assumed that patients could receive BSC at home or in hospice centers. The distribution of patients across each setting (~60 percent in home care; ~40 percent in hospice center) was estimated from expert opinion.
Local oncologists were in agreement that management of treatment-related AEs for sunitinib or interferon-alfa treatment did not incur significant resource consumption. Consequently, AE costs were not considered in the analysis.
Sensitivity Analyses
One-way sensitivity analyses (OWSA) were conducted to explore the impact of uncertain model parameters on the ICER. Each parameter was varied independently by the lower and upper range of the 95 percent CI. A variation of ± 20 percent was applied to the mean health state utility values cited from the study by Remak et al. (Reference Remak, Charbonneau and Negrier12) as utility values and their underlying uncertainties were not available from the published pivotal trial study (Reference Motzer, Hutson and Tomczak4).
A probabilistic sensitivity analysis (PSA) was performed whereby probability distributions were selected in accordance with the nature of the variable (Supplementary Table 2). Utility values were assumed to follow the beta distribution (continuous distribution confined within the interval 0 and 1). Hazard ratios for PFS and OS were represented using log-normal distributions from the reported means and 95 percent confidence intervals. The survival functions for PFS and OS were sampled from the multivariate normal distribution using the Cholesky decomposition matrix of the parameters characterizing the particular functional form. The cost of drugs and routine clinical care were assumed to be certain and were thus not varied in the PSA. Monte-Carlo simulations were repeated over 10,000 iterations to generate a distribution of ICER outcomes. Additionally, a cost-effectiveness acceptability curve (CEAC) was also obtained showing the probability of sunitinib and interferon-alfa being cost-effective over a range of willingness-to-pay (WTP) thresholds.
Supplementary Analyses
The model was adapted in supplementary analyses to allow for a comparison of pazopanib versus interferon-alfa. For this analysis, the cost of sunitinib was replaced by the cost of pazopanib while all other clinical and cost parameters from the sunitinib analysis remained unchanged. This approach was grounded on the determination of noninferiority between pazopanib versus sunitinib with respect to clinical efficacy as established in the COMPARZ trial, and supported by local expert opinion.
Additional scenario analyses were also performed to examine how changing the survival curve extrapolation approach, the methodology of survival curve parametric fit, the relative effect size for PFS and OS, the utility weights, and the dose and cost of sunitinib treatment each affect the ICER.
Results
Base-Case Analysis
In the base-case with a time horizon of 10 years, treatment with sunitinib increased both QALYs and costs relative to interferon-alfa. This resulted in an incremental cost per QALY gained of SGD191,061 (USD139,757), whilst the incremental cost per LY gained was SGD161,365 (USD118,035) (Table 2).
Table 2. Summary of Costs and Benefits of Sunitinib versus Interferon-Alfa, Base-Case Analysis

Note. Figures in parentheses are the undiscounted LY/QALYs.
AE, adverse event; QALY, quality-adjusted life-year; LY, life-year.
In the base-case analysis, over a 10-year time horizon, the model projected a mean PF duration (duration of first-line treatment) of 14 months for sunitinib and 7 months for interferon-alfa. The projected mean time spent in PD was 17 months and 20 months for sunitinib and interferon alfa, respectively.
Sensitivity Analyses
OWSA demonstrated that the ICER was most sensitive to variations in the utility value for the PF health state in the sunitinib arm, followed by the hazard ratio for OS and the utility value of the PF health state for the interferon-alfa arm (Figure 2). With an increase in the utility value for the PF state, the ICER unsurprisingly decreased due to the higher overall number of QALYs. When the hazard ratio for OS was increased to the upper limit of 1.001, the ICER for sunitinib rose to SGD422K (USD309K) per QALY; this was not unexpected as a hazard ratio of 1 equates to no difference in the overall mortality rate between the treatment groups. Relative to the hazard ratio for PFS, the model was more impacted by the OS gains, suggesting that PFS benefits were not a significant driver of the cost-effectiveness of sunitinib.
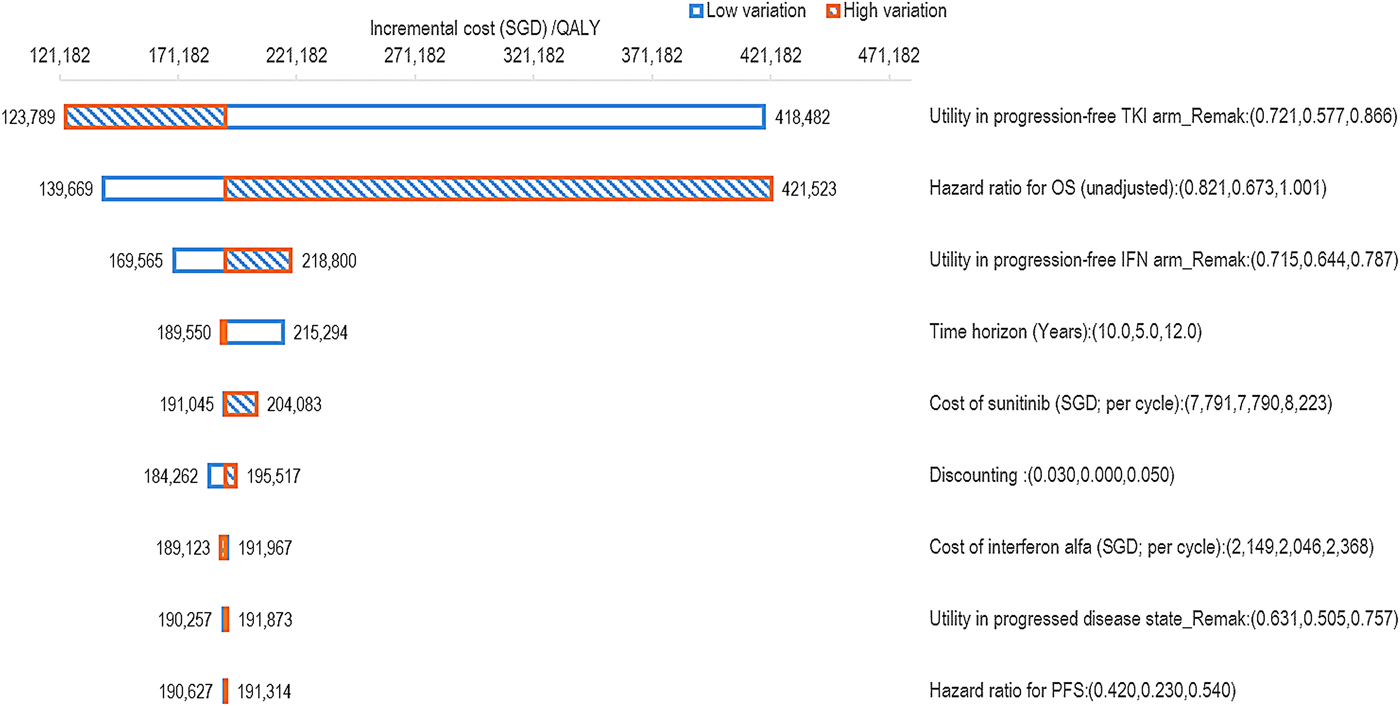
Figure 2. OWSA tornado diagram for sunitinib versus interferon-alfa. QALY, quality-adjusted life-year; TKI, tyrosine kinase inhibitor; OS, overall survival; IFN, interferon-alfa; PFS, progression-free survival.
The PSA result was congruent with the base-case analysis demonstrating that sunitinib was consistently more effective and also more costly than interferon-alfa with a high degree of certainty (Supplementary Figure 3). The mean ICER was marginally lower than the base-case result at SGD190,808 (USD139,572) per QALY gained. The CEAC demonstrated that between a WTP threshold range of 0 to SGD190K (USD139K) per QALY, interferon-alfa was the most cost-effective treatment compared with sunitinib (Supplementary Figure 4).
Supplementary Analysis – Pazopanib versus Interferon-alfa
When the cost of pazopanib first-line treatment was included in the model, the average total lifetime cost per patient was SGD152,877 (USD111,827) compared with SGD96,940 (USD70,910) when treated with interferon-alfa. Assuming equivalent efficacy to sunitinib, treatment with pazopanib led to an increase in QALYs relative to interferon-alfa and resulted in an incremental cost per QALY gained of SGD178,340 (USD130,452) and an incremental cost per LY gained of SGD150,621 (USD110,176).
Other Scenario Analyses
Additional scenario analyses were performed to examine how the base-case assumptions affected the ICER. An overview of the results of the various scenario analyses conducted is provided in Supplementary Table 3.
In the absence of any price reduction, all of the scenario analyses showed exceedingly high ICERs in the unacceptable cost-effectiveness range. Even with a 50 percent reduction in selling price, the ICERs were still high at SGD74K (USD54K) per QALY and SGD67K (USD49K) per QALY for sunitinib and pazopanib, respectively.
The highest ICER generated in the scenario analyses occurred when the full standard dose of sunitinib (50 mg per day, 6-week cycles of 4 weeks’ treatment followed by 2 weeks off treatment) was assumed for all patients, thereby resulting in an ICER of SGD242K (USD177K) per QALY.
Discussion
To our best knowledge, this is the first study conducted to address the cost-effectiveness of sunitinib as first-line therapy for patients with advanced and/or metastatic RCC in Singapore. While TKIs are commonly used for the first-line treatment of advanced and/or metastatic RCC in Singapore in line with international clinical guidelines, our analysis revealed that sunitinib does not represent a cost-effective treatment option at current prices in the local context. The high ICER for sunitinib compared with interferon-alfa in our analysis was primarily driven by the high cost of TKI treatment. The lifetime drug cost per patient in the PF health state was SGD74K (USD54K) for sunitinib, compared with SGD9K (USD7K) for interferon-alfa. While treatment with sunitinib resulted in an increase in QALYs, this increase was not sufficient to counteract the high incremental cost of TKI treatment at a level likely to be considered cost-effective.
The increase in lifetime cost per patient in the PF health state was driven by both the large incremental difference in drug cost (the cost of sunitinib and interferon-alfa per 6-week cycle was SGD7,790 [USD5,698] and SGD2,148 [USD1,571], respectively) and by the longer PFS duration associated with sunitinib treatment compared with interferon-alfa (11 months versus 5 months), thus accounting for more doses of sunitinib before the occurrence of disease progression. Scenario analyses investigating the effect of reducing the cost of sunitinib found that more than a 50 percent price reduction would be needed for TKI treatment in order for it to be considered for subsidy in the Singapore setting.
OWSA was performed to assess the key drivers of the model by varying the individual input parameters. The model was most sensitive to the utility values used for the PF sunitinib treatment health state. Due to the absence of local utility data for advanced and/or metastatic RCC, our analysis included utility values taken from published literature (Reference Motzer, Escudier and Oudard11). This methodology did not allow for the inclusion of local or Asian specific utility weights that would have been more representative of Singaporean health preferences. The PF utility values used were derived from the multinational sunitinib pivotal trial, which did not enroll patients within Asia. The PSA obtained a similarly high ICER to that obtained in the deterministic base-case results.
Correspondingly, the CEAC comparing sunitinib versus interferon-alfa demonstrated that for a WTP threshold of up to SGD190K (USD139K) per QALY, interferon-alfa was the more cost-effective treatment. While Singapore does not have an explicit WTP threshold to determine whether a drug represents good value for money, the wide variation in the upper and lower limits of the high base-case ICER from sensitivity and scenario analyses provides a strong indication that sunitinib is unlikely to represent a cost-effective treatment option in the local context.
After the utility values for the PF TKI treatment health state, the next most influential inputs identified in the OWSA were the hazard ratio for OS and the utility value for the PF interferon-alfa treatment arm. Critically, it was evident from the OWSA results that the ICER remained unfavorably high across the range of possible values investigated for each of the model parameters.
The supplementary analysis comparing pazopanib to interferon-alfa found that pazopanib was also not cost-effective for the treatment of advanced and/or metastatic RCC. As found in the primary analysis, the high ICER was largely due to the high cost of TKI treatment, with the lifetime pazopanib drug cost per patient in the PF health state of SGD70K (USD51K).
A limitation of the supplementary analysis comparing pazopanib with interferon-alfa was the assumption that the efficacy versus interferon-alfa seen in the sunitinib pivotal trial was assumed for pazopanib, on the basis that the TKIs were shown to be noninferior to each other in the COMPARZ trial. Therefore, this approach was considered reasonable and was necessitated by the lack of clinical data directly comparing pazopanib to interferon-alfa. In addition to the results of the COMPARZ trial, this approach was supported by a network meta-analysis recently published by Larkin et al. (Reference Larkin, Paine and Foley14). The analysis included all RCTs conducted in adult patients undergoing first-line treatment for advanced RCC and found that there was no significant difference in PFS duration for sunitinib and pazopanib.
A lower dose compared with the registered dose, was used in the base case, without changing the treatment effect, in line with findings from Tan et al. (Reference Tan, Li and Hong8) who compared the use of sunitinib at conventional doses (50 mg/day for 4 weeks, then 2 weeks of no treatment) with an attenuated-dosing regimen (37.5 mg/day for 4 weeks, then 2 weeks of no treatment) in a prospective registry trial conducted in Singapore. Tan et al. concluded that the attenuated dosing regimen of sunitinib yielded comparable real-world efficacy outcomes to the standard dose, therefore, we consider that our decision to use the attenuated dosing regimen in the model is justified and likely to be more representative of the dosing regimen used in local clinical practice.
The costs of interferon alfa were adjusted in the model in line with the initial titration doses used in the pivotal clinical trial. Following initiation, an attenuated dose was not used in the economic model for interferon alfa because, unlike sunitinib, dose reductions of interferon alfa are not common in clinical practice in Singapore.
Modeling to extrapolate outcomes beyond the available trial data was an unavoidable limitation of this evaluation. Survival data from the sunitinib pivotal trial were available up to a maximum follow-up period of approximately 3 years. Hence to enable the simulation of a 10-year time horizon, extrapolation of the survival data was required. To examine variability related to this, several candidate functions were investigated for the parametric extrapolations, namely the exponential, Weibull, log-normal, log-logistic, Gompertz, and generalized gamma distributions. The goodness-of-fit of these functions was assessed using the AIC, a visual comparison of the parametric curves against the actual data and a diagnostic plot testing the underlying model's assumptions. This resulted in a Weibull function being used for the base-case analysis.
Additionally, the parametric functions were derived by means of two approaches: the “single model” where the shape parameter for both treatment arms was jointly estimated, or “independent model” in which the curves were obtained by fitting distributions to the interferon-alfa and sunitinib KM curves individually. In the base-case analysis, the shape parameters for the two treatment groups were co-estimated by applying the reported PFS and OS hazard ratios from the sunitinib pivotal trial to the baseline interferon-alfa curve to generate the corresponding sunitinib curve. This was done to maintain internal consistency with empirical data from the trial. However, the implicit assumption of a single model approach is that the HR observed in the trial lasts for the entire duration of the time horizon. Such an assumption may not be reasonable under some circumstances. To address this, we performed scenario analyses using another two survival curve extrapolation approaches, that is, using “KM extrapolation” and “Independent model”, to compare sunitinib versus interferon-alfa, which led to an increase in the ICERs to SGD205,669 (USD150,443) and SGD288,121 (USD210,755) per QALY gained for each approach, respectively.
The median OS from the model was 26 months for patients receiving sunitinib and 22 months for patients receiving interferon alfa. This directly correlated with the median OS observed in the pivotal trial.
We are cognizant of the minor discrepancy between the difference in median overall survival of 4.6 months between sunitinib and interferon-alfa as reported in the pivotal trials and the model projected mean difference in survival of 5 months. This could be ascribed to the differing mathematical derivations of median and mean survival times in which median OS is the time for which 50 percent of the patient population remain alive (as read from the 50 percent probability mark of the Y-axis of the KM curve) whereas mean survival is determined from the area under the KM curve. As such, we do not perceive this discrepancy as suggestive of an underestimation in the treatment effect by the model.
Our base-case result was largely comparable with published ICERs from overseas. Chabot and Rocchi (Reference Chabot and Rocchi15) and Wu et al. (Reference Wu, Dong and Xu16) published economic evaluations that compared sunitinib with interferon-alfa and determined ICERs of CAD144K per QALY and USD218K per QALY, respectively. Additionally, a cost-effectiveness analysis conducted in 2008 by Remak et al. (Reference Remak, Charbonneau and Negrier12) obtained an ICER of USD53K per QALY. This lower ICER was primarily due to a considerably smaller incremental cost difference between treatments (with the total average per-patient cost of treatment with sunitinib of USD225K compared with USD217K for interferon-alfa), which differs markedly to the current price differential between sunitinib and interferon-alfa in Singapore.
In conclusion, in Singapore, sunitinib is more effective and also more costly than interferon-alfa as first-line treatment for advanced and/or metastatic RCC. However, at its current price, it does not represent a cost-effective treatment option. In addition to cost-effectiveness, clinical effectiveness, safety profiles, and payer affordability should also be taken into account when considering whether sunitinib should be recommended for government subsidy.
Author ORCIDs
Sil-ling Pruis, 0000-0001-7024-5108.
Supplementary material
The supplementary material for this article can be found at https://doi.org/10.1017/S0266462319000059.
Conflicts of interest
This study was not funded.


 Open access