


1 Introduction
White-light continuum generation is a universal process that occurs when intense ultrashort laser pulses interact with transparent gases[Reference Corkum, Rolland and Srinvasan-Rao1], liquids[Reference Brodeur, Ilkov and Chin2, Reference Cook, Kar and Lamb3] and solids[Reference Alfano and Shapiro4, Reference Alfano and Shapiro5]. A white-light continuum is characterized by intense ultrafast broadband with frequencies ranging from the near-UV to near-IR. The multicolored light possesses many of the same desirable properties as conventional laser: intense, collimated and coherent. Therefore it has found wide applications ranging from frequency metrology[Reference Udem, Holzwarth and Hansch6], spectroscopy of semiconductor microstructures and photonic structures[Reference Alfano7], optical coherence tomography[Reference Humbert, Wadsworth, Leon-Saval, Knight, Birks, St, Russell, Lederer, Kopf, Wiesauer, Breuer and Stifte8] to time-resolved spectroscopy[Reference Alfano and Shapiro9], etc.
Since the discovery of white-light continuum by Robert R. Alfano and Stanley Shapiro in 1969, extensive progress has been achieved on the experimental and theoretical understanding of ultrafast nonlinear and linear processes responsible for white-light continuum generation[Reference Alfano7]. It seems that the mystery of white-light continuum has all been decoded. Therefore, recent research activity cares little about the intrinsic properties of white-light continuum, but mainly focuses on how to generate intense and high-efficiency white-light continuum[Reference Lu, Tsou, Chen, Chen, Cheng, Yang, Chen, Hsu and Kung10, Reference He, Liu, Zhao, Teng, He, Huang, Huang, Zhong, Jiang, Fang, Hou and Wei11] and synthesize it for reproducible few-cycle light waveforms[Reference Wirth, Hassan, Grguraš, Gagnon, Moulet, Luu, Pabst, Santra, Alahmed, Azzeer, Yakovlev, Pervak, Krausz and Goulielmakis12–Reference Brabec and Krausz14], which fulfill a central role in attosecond science.
A white-light continuum is believed to be polarized in the direction of the incident pump laser polarization for an isotropic medium[Reference Alfano and Shapiro5]. However, in optically isotropic cubic crystals of CaF2 and LiF, Midorikawa et al. observed angular-dependent polarization change of the continuum[Reference Midorikawa, Kawano and Suda15]. Later, a depolarization of the continuum was also reported in the isotropic medium BK-7 glass[Reference Dharmadhikari, Rajgara and Mathur16]. By rotating CaF2 and LiF around the optical axis, the transmitted continuum intensity behind the analyzer prism varies cyclically. However, in BK-7 glass, the significant depolarization appears at very high incident laser powers, and plasma effects are assumed to be relevant to the depolarization. In addition to the angular-dependent and laser intensity-relevant properties, depolarization of continuum is still far from being understood.
In this paper, we focus a femtosecond laser into bulk fused silica to induce white-light continuum and also use two orthogonal polarizers to analyze the continuum. As expected, continuum signals can still be detected behind the second polarizer. We name such a phenomenon as self-induced birefringence of continuum. In contrast to previous work, a deeper study of depolarization is presented by exploring the time evolution of the transmitted continuum signal as well as imaging the induced structures. In the following sections, we will find more characteristics of self-induced birefringence of continuum and decode how self-induced birefringence of continuum proceeds in fused silica.
2 Experiment
The laser source is an amplified Ti:sapphire mode-locked laser system (Legend Elite Series, Coherent) with a pulse duration of 50 fs operating at 800 nm with a measured bandwidth of 10 nm and a frequency of 1 kHz. The single pulse energy is varied from 20 to 850 μJ. In this work, commercially available fused silica glass (JGS1) samples with the dimension of 10 mm × 10 mm × 2 mm are used, and their six surfaces are polished to optical grade. The apparatus used in the experiment is depicted in Figure 1. The laser power was first adjusted by a variable neutral density filter, and the beam was strongly linearly polarized by passing through a Glan–Thompson polarizer. Two lenses with focal length of 200 mm are used to focus and collimate the light beam, separately. A bandpass filter in the path of the laser filters the 800 nm pump light out. Another Glan–Thompson polarizer with polarization orthogonal to the input polarizer serves as an analyzer. The detector, either for power or spectral recording, refers to a CCD coupled to a laser beam profiler (Thorlabs, BC106-VIS) or the end face of a fiber connected to a spectrometer (USB 2000, Ocean Optics Inc.) with a detection range of 200–1100 nm.
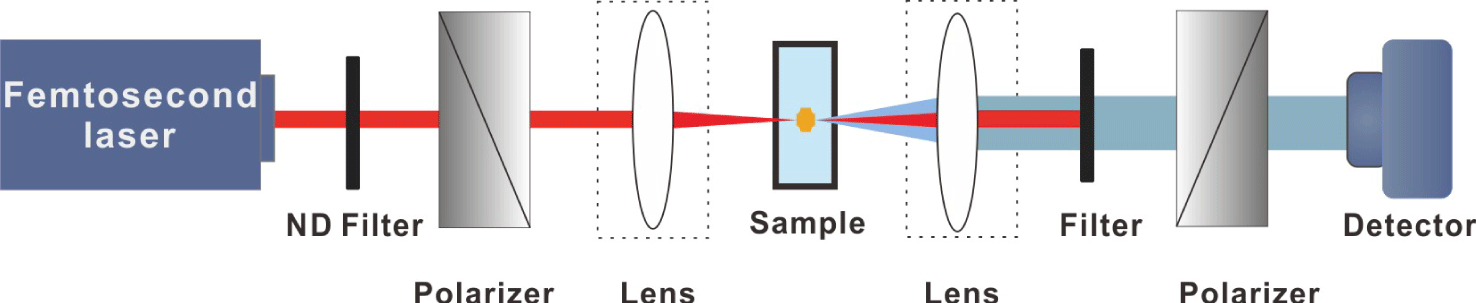
Figure 1. Schematic diagram of self-induced birefringence of white-light continuum.
3 Filamentation without polarizers
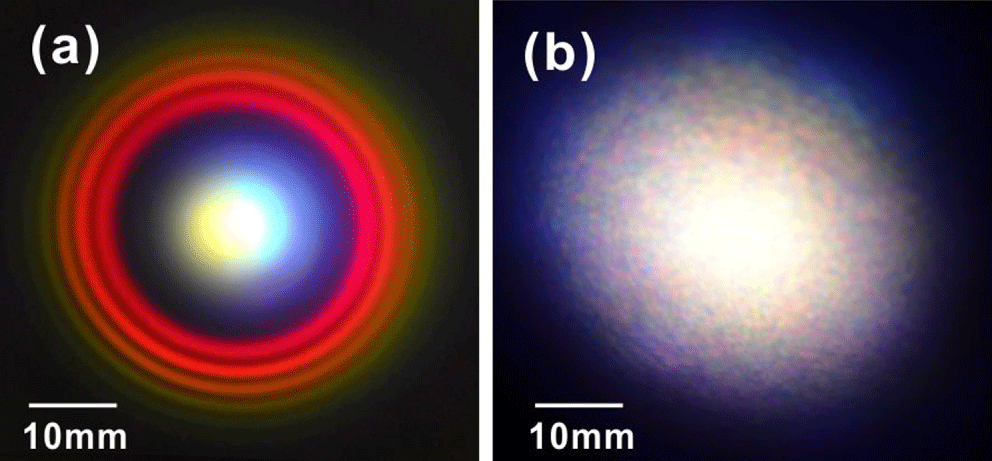
When the two lenses shown in Figure 1 were removed, this allowed the femtosecond laser pulses to pass through the fused silica samples without focusing, and no transmission signal behind the second polarizer was detected. When the two lenses were added and at the same time, the second polarizer was removed, obvious continuum could be observed in the path of laser propagation. Figure 2 shows the original color pictures of the generated light projected on a piece of white paper with the iris aperture wide open. The images were taken at a distance of 180 mm from the generating center by a commercial digital camera (Nikon, D7000) with an exposure time of 0.25 s in a dark room. When the laser pulse energy is 10 μJ (pulse power 200 MW), the white-light beam generated consists of a white central part surrounded by a rainbow-like conical emission (Figure 2(a)). The radial order of the spectral components is the inverse of diffraction with bluer frequencies appearing on the outside rings. This phenomenon is recognized as a signature of filamentation[Reference Couairon and Mysyrowicz17]. The power (200 MW) of the incident pulse is well above the critical power ( $P_{\text{cr}}$) of 2.6 MW for self-focusing in fused silica[Reference Carr, Feit, Rubenchik, De Mange, Kucheyev, Shirk, Radousky and Demos18], and also above the threshold power of 4.3 MW for filamentation in fused silica[Reference Brodeur and Chin19]. Therefore, filamentation does occur as shown in Figure 2(a). However, when the laser pulse energy is increased to 550 μJ (pulse power 11,000 MW), which is far above the critical power for self-focusing, the modulational instability breaks up the beam into a large number of filaments[Reference Couairon and Mysyrowicz17]. Figure 2(b) is an obvious demonstration of multiple filaments.

Figure 2. Original color photographic image of continuum taken at a distance of 180 mm from the focus center when the laser pulse energy is (a) 10 μJ and (b) 550 μJ.
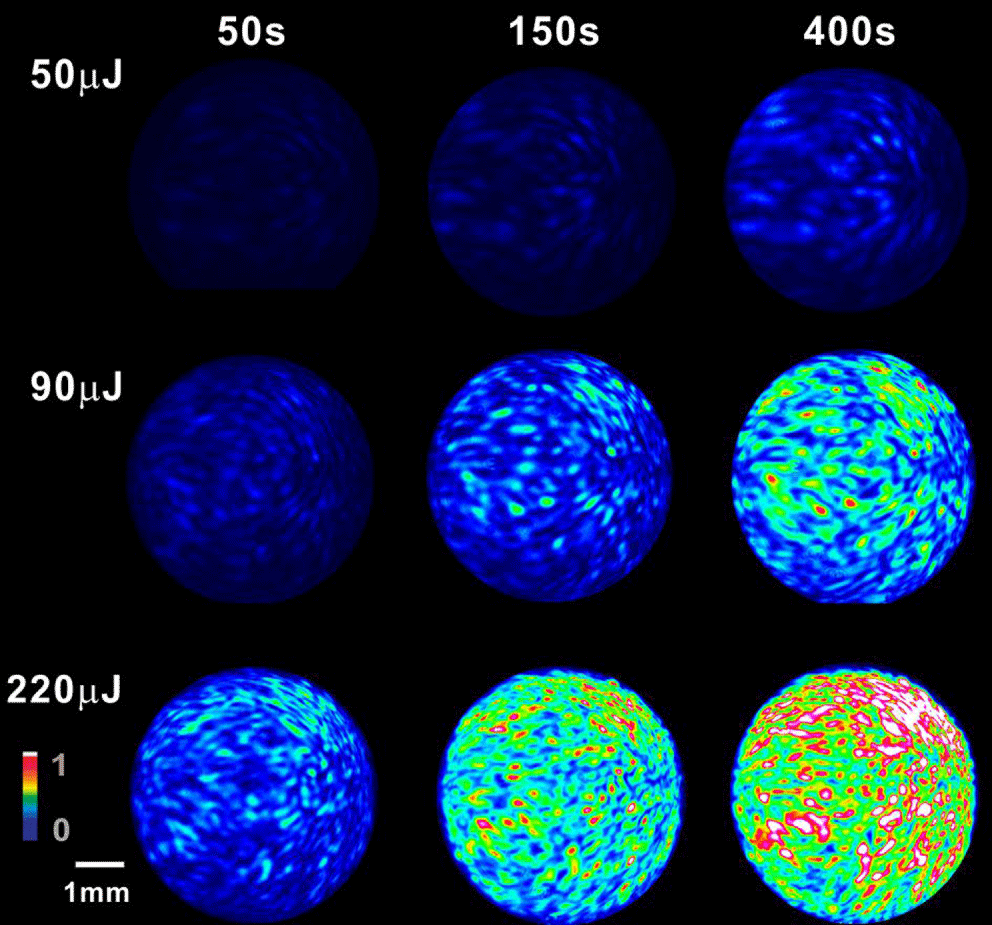
Figure 3. Beam profile evolution of the transmitted light signal with varied pulse energy and laser exposure time.
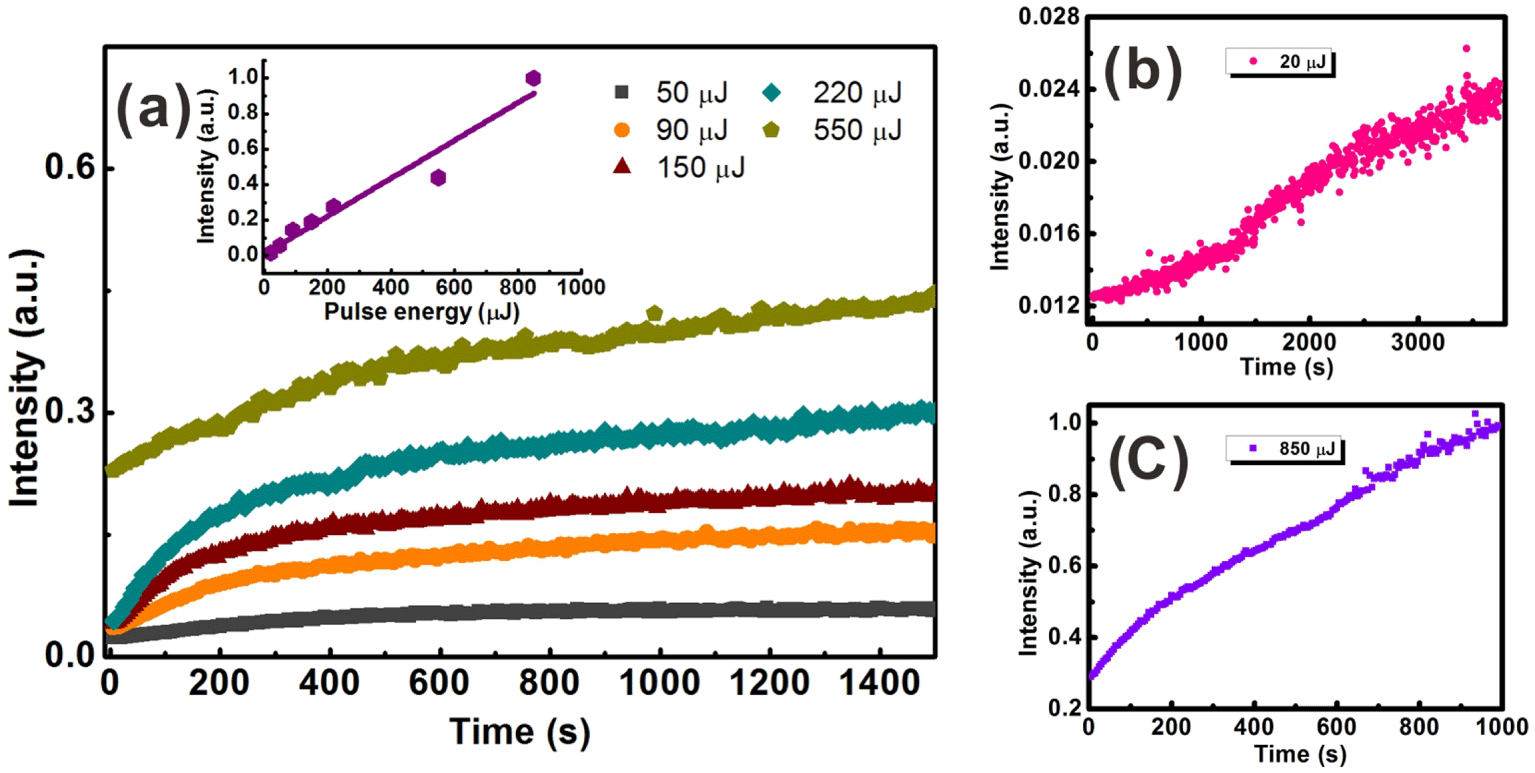
Figure 4. Time evolution of the transmitted signal of the generated continuum at varied pulse energy. Inset of (a): saturation value of the transmitted signal as a function of the pump energy.
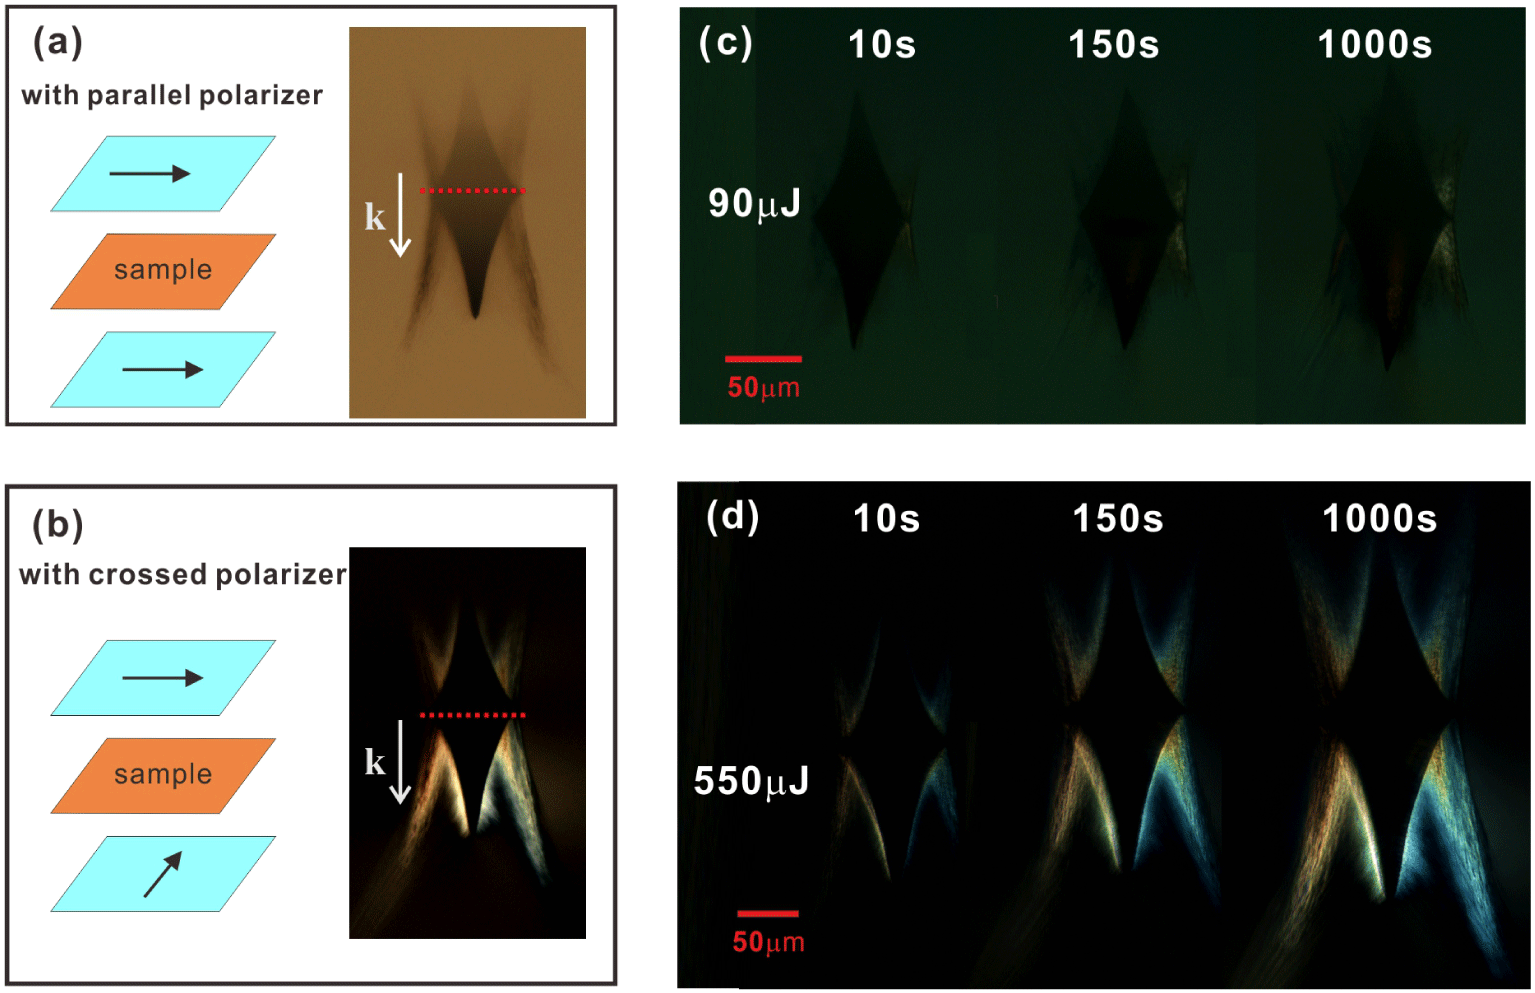
Figure 5. Optical images of the femtosecond laser induced structure under the illumination of light on a transmission microscope with (a) parallel polarizer and (b) crossed polarizer on both sides of the samples. Time evolution of the birefringence structure under cross-polarization illumination at pulse energy of (c) 90 μJ and (d) 550 μJ.  $k$ represents the laser propagation direction. The red dashed line indicates the focal depth.
4 Time evolution and pulse energy dependence of white-light continuum
When white-light continuum is generated, we can detect the transmission signal behind the second polarizer, which indicates that the polarization of the continuum is changed. A laser beam profiler is used to record the beam profile. Figure 3 shows the beam profile evolution of the transmitted light signal with varying pulse energy and laser exposure time. Three different pulse energies of 50, 90 and 220 μJ are used for comparison. Then at the laser exposure durations of 50, 150 and 400 s, the beam profiles are recorded, respectively, at varying pulse energy. It can be seen that the beam profile is not Gaussian, but with multi-hotspots randomly distributed across the beam profile. With increase in time, the intensity of each spot becomes stronger, leading to the whole intensity rise of the beam. We suppose that these hotspots may be due to multifilament generation as Figure 2(b) also shows a similar intensity distribution. For smaller powers such as 50 mJ (pulse power 1000 MW), which is still above the critical power of self-focusing and the threshold power of filamentation in fused silica, modulational instability can also lead to multiple filamentation[Reference Couairon and Mysyrowicz17].
For a more accurate demonstration, we also recorded the power evolution of the probe signal in Figure 4. The exposure time was set as 1 s, and the data were recorded every 5 s. Laser pulse energy is varied from 20 to 850 μJ and the detected power is normalized for comparison. As can be seen in Figure 4(a), the transmission signal has a growth–saturation feature with time progress. And the higher the pump energy was, the more time was needed to reach the saturation value. For example, when the pump energy is 90 μJ, about 200 s is needed to reach its saturation value. However, with the pump energy increasing to 220 μJ, it takes more than 400 s to reach its saturation value. In addition, the transmitted signal intensity also follows an increasing trend with increased pulse energy. As shown in the inset of Figure 4(a), a linear relationship between the saturation intensity and pump energy can be obtained by the experimental measurement. For pulse energy as low as 20 μJ, though the absolute transmitted intensity is quite low, the growth time of the probe signal can continue for even more than one hour (Figure 4(b)). When pulse energy is increased to 850 μJ, the growth trend is quite obvious, with a four-fold rise of the absolute intensity within only 1000 s (Figure 4(c)).
Fused silica is an isotropic material. Though depolarization of continuum has been demonstrated in isotropic medium such as BK-7 glass[Reference Dharmadhikari, Rajgara and Mathur16], however, the previous BK-7 study looked at the intensity dependence and onset of the induced birefringence, and time evolution property of transmitted continuum signal has not been observed before. In Figures 3 and 4, we could detect the transmission signal behind the second polarizer, and the transmission signal exhibits growth–saturation feature. Based on these results, we assume that the major influencing factor may lie in the material itself. Then we have to find whether there are ‘abnormal’ structures existing in the material that synchronously modulate the continuum.
Laser irradiated bulk fused silica was then viewed under microscope. In Figure 1, laser pulses pass the fused silica from left to right. When viewing on a transmission microscope, we put the fused silica in a way that the illumination light transmits from bottom to the top of the irradiated fused silica, and thus the recorded image was a top-view picture of the bulk fused silica, as shown in Figures 5(a) and 5(b). When parallel polarizers are inserted, an ordinary transmission image can be observed (Figure 5(a)). Laser propagation direction is indicated by the white arrow. The red dashed line indicates the focal depth. According to this top-view structure, we can predict that the femtosecond laser induced structure is a combination of two symmetrical cones with wing-like structure around the cone. The focal length of the lens is 200 mm, and thus it is loose focusing in fused silica. Therefore, the two-cone combined shape is different from the filament shape in tight focusing[Reference Dai, Patel, Song, Beresna and Kazansky20]. The dynamics of the optical breakdown in the bulk of the fused silica can be deduced as follows. Plasma starts from the geometrical focus (denoted as red dashed line) and subsequently grows with an initially supersonic velocity back toward the laser. Plasma then expands and increases the temperature and pressure in the vicinity of the initial breakdown region. The expansion of the plasma out of the central hot core is supposed to be the result of a strong shock wave front, and thermal conduction proceeds[Reference Tran, Grigorov, Nguyen, Rehman, Le and Janulewicz21, Reference Hanuka, Wootton, Wu, Soong, Makasyuk, England and Schächter22]. Thermal conduction from the damaged region into the surrounding pristine material enlarges the heated region, and thus expands the absorbing region. The development of the damaged region was estimated to be higher in the axial direction than in the radial direction[Reference Tran, Grigorov, Nguyen, Rehman, Le and Janulewicz21]. However, with crossed polarizer, the illumination light from the microscope was not all blocked. We can still see the illumination light around the two-cone shaped area as well as from the wing-structure region (Figure 5(b)). This is a birefringence phenomenon.
Femtosecond laser induced birefringence in glass is not a new phenomenon. Previous work has indicated that when a femtosecond laser focuses into a bulk glass, optical anisotropy can be created due to anisotropic refractive-index change[Reference Yamada, Watanabe, Nishii and Itoh23, Reference Yang, Burns, Guo, Luk and Vawter24] or self-organized nanograting[Reference Song, Dai, Song, Ma, Yan and Ma25–Reference Bricchi, Klappauf and Kazansky27]. Yamada et al. found that femtosecond laser induced refractive-index change has an elliptical structure by hydrofluoric acid solution etching the cross-section, and the long axis is parallel to the polarization of incident laser pulses[Reference Yamada, Watanabe, Nishii and Itoh23]. Shimotsuma et al. found nanogratings were generated inside silica glass after irradiation by a focused linearly polarized femtosecond laser, and revealed that the nanogratings were aligned perpendicularly to the laser polarization direction[Reference Shimotsuma, Kazansky, Qiu and Hirao26]. Though the laser induced birefringence has been observed in above mentioned work, however, the time evolution feature of self-induced birefringence of white-light continuum has not been reported.
Figures 5(c) and 5(d) are the time evolution of the birefringence structures under cross-polarization illumination at different pulse energies of 90 μJ and 550 μJ, respectively. Three induced structures with laser exposure durations of 10, 150 and 1000 s are compared at the same pulse energy. The three laser exposure durations correspond to the laser pulse numbers of 104, 1. 5 × 10⁵, and 106, respectively. It can be seen that the birefringence feature mostly originates from the wing-like structure. With pulse number increased, the structures induced by femtosecond laser become larger, and at the same time, the region of the wing-like structure also enlarges. The wing-like structure also depends a lot on pulse energy. With the same exposure time of laser, the structures irradiated by 550 μJ exhibit more apparent birefringence compared with that induced by only 90 μJ, which is in accordance with the results in Figures 3 and 4. With more intense birefringence, the more white-light continuum can transmit the second polarizer.
In Figure 5, we have confirmed that birefringence structures actually are induced inside the fused silica, and the dependence of the transmission continuum on time and pulse energy is in agreement with the dependence of birefringence intensity on time and pulse energy. Therefore, we suggest that the birefringence structures should have modulated the transmission of the generated white-light continuum. Based on the observations above mentioned, we propose that the self-induced birefringence of continuum may progress as follows. When intense femtosecond laser with power density more than  $10^{14}~\text{W}/\text{cm}^{2}$ irradiates the fused silica, strong self-phase modulation and self-focusing, etc., occur, which cause continuum generation[Reference Alfano and Shapiro5]. At the same time, laser induced structural changes occur, such as anisotropic refractive-index change and self-organized nanogratings, within the sample. Accordingly, the anisotropic structural changes modulate the continuum, generating the self-induced birefringence.

Figure 6. The dependence of the transmitted continuum behind the second polarizer (a) on the laser exposure time at pulse energy of 550 μJ and (b) on the pulse energy at laser exposure time of 400 s.
Finally, the transmitted spectra behind the second polarizer are also measured in Figure 6. During the recording process, the filter in the light path is removed so that the laser beam can also be recorded. The central wavelength of the laser is 800 nm, and it can be seen that, the detected spectra are broadened with the wavelength ranging from 650 to 900 nm. The time evolution of the transmitted continuum at pulse energy of 550 μJ is recorded in Figure 6(a). As expected, the intensity of the spectra increases with increasing laser exposure time. When with the same laser exposure time, the spectral intensity also increases with increasing pulse energy (Figure 6(b)). The results in Figure 6 agree well with what the Figures 3 and 4 have shown. Now it is obvious that the beam profile, the power intensity as well as the spectra of the transmitted continuum have the same growth trend with laser exposure time and pulse energy, and the growth trend is ultimately due to the self-induced birefringence, which also has growth trend with both laser exposure time and pulse energy (Figure 5).
5 Conclusion
In conclusion, we have recorded the time evolution of self-induced birefringence of white-light continuum in fused silica. This indicates that white-light continuum is synchronously modulated anisotropically in the interaction process of a focused femtosecond laser with fused silica. The birefringence signal of the generated continuum has a growth–saturation property with time evolution, and it becomes more intense for higher laser pulse energies. Optical morphology analysis finally demonstrates that time-evolved anisotropic structures are responsible for self-induced birefringence of the continuum. These properties may be useful for fabrication of polarization-dependent devices.
Acknowledgements
This research was supported by the National Key Research and Development Program of China (No. 2016YFB1102402) and the National Natural Science Foundation of China (No. 61675214).


 Open access