


1 Introduction
The physics of high-intensity laser interaction with matter, with relevance to high-energy density science and high-gradient particle acceleration, driven by ultrashort and ultra-intense laser pulses[Reference Strickland and Mourou1], has experienced an impressive amount of development in recent years, thanks to the rapid evolution of high-peak-power Ti:sapphire lasers, now routinely operating at the sub-petawatt level and beyond[Reference Danson, Haefner, Bromage, Butcher, Chanteloup, Chowdhury, Galvanauskas, Gizzi, Hein, Hillier, Hopps, Kato, Khazanov, Kodama, Korn, Li, Li, Limpert, Ma, Nam, Neely, Papadopoulos, Penman, Qian, Rocca, Shaykin, Siders, Spindloe, Szatmári, Trines, Zhu, Zhu and Zuegel2]. Laser-driven ion[Reference Daido, Nishiuchi and Pirozhkov3, Reference Macchi, Borghesi and Passoni4] and electron acceleration[Reference Esarey, Schroeder and Leemans5], and their applications to secondary radiation sources[Reference Gizzi, Assmann, Koester and Giulietti6], are advancing quickly, based on established and extensively investigated processes such as target normal sheath acceleration (TNSA), radiation pressure acceleration (RPA) or laser wakefield acceleration (LWFA), and now deliver ion beams in the multi-megaelectronvolt energy range and beyond[Reference Higginson, Gray, King, Dance, Williamson, Butler, Wilson, Capdessus, Armstrong, Green, Hawkes, Martin, Wei, Mirfayzi, Yuan, Kar, Borghesi, Clarke, Neely and McKenna7] and electrons in the multi-gigaelectronvolt energy range[Reference Gonsalves, Nakamura, Daniels, Benedetti, Pieronek, De Raadt, Steinke, Bin, Bulanov, Van Tilborg, Geddes, Schroeder, Tóth, Esarey, Swanson, Fan-Chiang, Bagdasarov, Bobrova, Gasilov, Korn, Sasorov and Leemans8]. When compared with radio frequency (RF)-driven accelerators, these techniques stand out because of significant features, such as the extremely high acceleration gradient resulting in a compact emitting region, the ultrashort duration and the reduced overall footprint and costs, both of construction and maintenance. Potential applications in various fields are being considered including biomedical use of particle and high-energy secondary radiation for diagnosis and therapy[Reference Giulietti9, Reference Labate, Palla, Panetta, Avella, Baffigi, Brandi, Di Martino, Fulgentini, Giulietti, Köster, Terzani, Tomassini, Traino and Gizzi10]. The extremely short duration (sub-petasecond) of bunches produced by laser-driven accelerators compared to that of bunches produced by medical RF accelerators (microsecond timescale) may lead to rather different radiobiological effects, owing to the much higher instantaneous dose rate[Reference Andreassi, Borghini, Pulignani, Baffigi, Fulgentini, Koester, Cresci, Vecoli, Lamia, Russo, Panetta, Tripodi, Gizzi and Labate11]. These features are motivating further development to investigate the physics and applications of high-intensity laser–matter interaction. Within this development, the EuPRAXIA project[Reference Assman, Weikum and Akhter12] is aiming at the construction of a compact European end user plasma accelerator using the most advanced laser technologies[Reference Gizzi, Koester, Labate, Mathieu, Mazzotta, Toci and Vannini13] and cutting-edge plasma acceleration developments[Reference Tomassini, De Nicola, Labate, Londrillo, Fedele, Terzani and Gizzi14].
Here we present the features of the Intense Laser Irradiation Laboratory (ILIL), a fully-equipped installation[Reference Mourou15] now operating at the sub-petawatt level (ILIL-PW) and designed with the purpose of exploring fundamental laser–plasma interactions at extreme intensities and establishing the operation of laser-driven beam-lines of ions, electrons and X-ray radiation. The design builds on the results achieved so far in this field by extensive experimental activity in the past two decades.
2 Laboratory mission and layout
The design of the ILIL-PW installation is a major upgrade of the previously existing ILIL established in early 2000 to develop laser-driven plasma acceleration and originally featuring a 10 TW, 10 Hz laser system[16–20]. The upgrade was conceived to develop the research programme of the Italian initiative on Extreme Light Infrastructure, dedicated to laser–plasma acceleration and to biomedical applications of laser-driven radiation and particle sources. The installation was then further enhanced to allow implementation of a dedicated beam-line of light ions[Reference Gizzi, Giove, Altana, Brandi, Cirrone, Cristoforetti, Fazzi, Ferrara, Fulgentini, Koester, Labate, Lanzalone, Londrillo, Mascali, Muoio, Palla, Schillaci, Sinigardi, Tudisco, Turchetti, Id and Turchetti21]. As a result, the facility now features a flexible layout that can allow for experiments in different focusing configurations and with a range of standard and advanced diagnostics.
As shown in Figure 1, in addition to the ‘front-end’ laser and the original ‘TW’ experimental target area, the new layout includes two additional areas hosting the high-power multi-pass laser amplifier and the high-intensity ‘PW’ experimental target area, respectively. In this configuration the front-end laser room is located centrally with respect to the two experimental areas. Laser pulses generated by the front-end system can either be compressed, now reaching 14 TW, and delivered via a vacuum transport line to the ‘TW’ experimental area, or uncompressed and sent to the multi-joule amplifier room for further amplification.

Figure 1 Layout of the entire laboratory, including (from left) the control room, the ‘TW’ experimental area, the laser front-end room, the  $>$220 TW amplifier room and the high-intensity target area.
The ‘TW’ experimental area is equipped with two vacuum chambers dedicated, respectively, to gas target interaction, equipped with an f/12 off-axis parabolic (OAP) focusing mirror, and solid target interaction, equipped with either an f/3 or an f/1 OAP focusing mirror, for moderate-intensity experiments. Here experiments are carried out to develop applications of laser-driven radiation and particle beams that can take advantage of the 10 Hz repetition rate and peak power limited to 14 TW, depending on the interaction configuration. This experimental area also has the unique advantage of allowing fast access to high-intensity interactions for diagnostic development and test prior to implementation in the higher-intensity interaction area.
Laser pulses sent to the multi-joule amplifier room are amplified to the final maximum energy of 8 J and delivered to the high-power optical compressor located in the high-intensity ‘PW’ target area. This experimental target area includes a labyrinthine radiation shielding enclosing a large, octagonal interaction chamber connected to the high-power optical compressor chamber by a chicane-like vacuum transport line. The foundations beneath the target area were modified to strengthen the floor, to minimize mechanical vibrations and to enable the construction of the 75 t shielding walls described in detail later.
Pulse optimization and metrology are carried out in the same room outside the radiation shielding bunker, on the beam extracted with the insertion of a mirror along the transport line after compression, as shown below . This configuration was implemented with a user-oriented approach to laser operations in mind, in which laser performance and control operations are linked closely with user operations concerned with set-up of experiments, and in which the main laser functions are controlled remotely . This also minimizes possible thermal and mechanical perturbations to the laser environment during laser measurements as a result of connection to the laser front-end and power amplifier rooms.
3 Laser features
As mentioned previously, the current laser design is the outcome of successive upgrades from the initial configuration established in early 2000. The  $>$220 TW upgrade was largely based on the design of Amplitude Technology’s Pulsar system, configured with custom front-end and modular choice of pump lasers. Figure 2 shows the schematic diagram of the high-peak-power Ti:sapphire laser, with the front-end featuring the Ti:sapphire oscillator, the booster amplifier, the Öffner stretcher and the regenerative amplifier followed by a 5-pass amplifier and a 4-pass amplifier. The Ti:sapphire laser oscillator is a commercial Femtosource Sinergy, manufactured by Femtolasers. It generates 15 fs pulses with energy of 6 nJ at 74 MHz repetition rate. In order to improve the contrast ratio, the 15 fs pulse is amplified in a booster module consisting of a compact 14-pass amplifier to amplify the oscillator output to the tens of microjoule level, and a saturable absorber cleans the pulse, removing residual ASE background arising from the amplifier. The booster amplifier is pumped with 6 mJ, 532 nm pump light from a CFR Ultra Nd:YAG laser (Quantel), which is used to pump the regenerative amplifier as well. This module also features a Pockels cell that acts as a pulse picker, creating a 10 Hz pulse train from the 74 MHz oscillator pulse frequency. Laser pulses from the booster amplifier are stretched up to ~300 ps duration in an all-reflective triplet combination Öffner-type stretcher before entering the regenerative amplifier. An acousto-optic programmable dispersive filter (a Fastlite Dazzler) is inserted in the chain, right after the pulse stretcher. The Dazzler is used as a phase modulator to pre-compensate phase distortions introduced throughout the laser chain[Reference Verluise, Laude, Cheng, Spielmann and Tournois22]; it also acts as an amplitude modulator to optimize the laser output spectrum, allowing shorter pulses to be generated.

Figure 2 Layout of the ILIL-PW laser system, showing the front-end and the power amplifiers.
The first amplification stage consists of a regenerative amplifier producing around  $\unicode[STIX]{x02272} 0.6$ mJ pulses when pumped with 5 mJ, 532 nm light from the same CFR Ultra Nd:YAG laser (Quantel) as that used for the booster. The regenerative amplifier comprises an intracavity acousto-optic programmable gain filter (a Fastlite Mazzler) to compensate for gain narrowing occurring throughout the amplification stages[Reference Oksenhendler, Kaplan, Tournois, Greetham and Estable23]. The laser pulse then reaches the first multi-pass amplifier, a 5-pass amplifier pumped with 115 mJ, 532 nm light from a CFR 200 laser (Quantel) and delivering 30 mJ of pulse energy. The amplified pulse is expanded with a telescope to 10 mm diameter before entering the next amplification stage, which consists of a 4-pass amplifier designed to produce 600 mJ of energy. This amplifier uses a water-cooled 15 mm diameter, 20 mm long Ti:sapphire crystal with anti-reflection coating on both faces and is pumped with $\unicode[STIX]{x02273} 1.8$ J, 532 nm light from a ProPulse+ Nd:YAG laser (Amplitude Technologies). The laser pulse is then expanded to ~36 mm diameter before the next stage.
As shown in Figure 2, at this level of amplification the laser pulse can either be sent to a vacuum compressor for 10 Hz applications or sent to a further amplification stage. In the first case the pulse is compressed using two gold-coated 1480 grooves/mm gratings and a retro-reflector, which finally deliver ~30 fs compressed pulses. The compressor efficiency is about 70%, yielding a compressed pulse peak power of ~14 TW. As mentioned earlier, this 10 Hz, 14 TW compressed laser pulse can be delivered to either of the two vacuum interaction chambers, dedicated to electron and ion acceleration, respectively, hosted in the ‘TW’ experimental area (second room from the left in Figure 1). In the first chamber, the laser pulse is focused to an intensity of ~3×10 ${}^{18}$ W/cm ${}^2$, using an f/~12 OAP mirror, onto a supersonic gas-jet target to generate relativistic, ultrashort electron bunches via LWFA.
The set-up is optimized for repetitive operation, with the repetition rate currently limited to 1 Hz by the time needed to recover the vacuum level of  $<{10}^{-4}$ mbar (1 mbar = 100 Pa) in the target chamber after gas-jet operation. This pressure is sufficiently low to ensure no perturbation of the laser propagation and no measurable effect on the quality of the vacuum–gas interface. We observe here that there is no physical separation between the interaction chamber and the compressor chamber so that, in principle, the pressure in the compressor is free to rise when the pressure in the interaction chamber rises. However, given the length and relatively small diameter of the connection tube between the compressor and the interaction chamber, and the presence of the intermediate chamber hosting the 90° turning mirror, the vacuum conductance of the system is quite small and the pressure in the compressor increases only slightly, reaching $<{10}^{-3}$ mbar and then returning to the operating pressure. This beam-line is used for LWFA in the tens of megaelectronvolts electron energy range for applications, $\gamma$-ray generation and diagnostic development and tests[Reference Andreassi, Borghini, Pulignani, Baffigi, Fulgentini, Koester, Cresci, Vecoli, Lamia, Russo, Panetta, Tripodi, Gizzi and Labate11].
In the second interaction chamber, the laser pulse is set to drive generation of light ions for applications, currently focused on material studies via the so-called particle-induced X-ray emission (PIXE) technique[Reference Barberio, Veltri, Scisciò and Antici24]. The laser pulse is focused on thin solid targets for the production of energetic protons and ions via TNSA, by means of an f/1 OAP mirror, reaching an intensity on target up to ~4×10 ${}^{19}$ W/cm ${}^2$ for generating protons with energy up to 3 MeV for PIXE applications. We point out that this value of laser intensity is currently limited by the diffraction losses typical of the standard quality OAP mirror applied specifically to particle-induced X-ray spectroscopy.
Alternatively the uncompressed pulse from the front-end (at an energy level of 600 mJ) is further amplified by the third high-energy multi-pass amplifier stage consisting of a 4-pass amplifier pumped by 20 J, 532 nm light generated by four Titan 6 Nd:YAG lasers (Amplitude Technologies). At this stage the maximum repetition rate of the pump lasers is 5 Hz, while the repetition rate of the amplifier is limited to 2 Hz by the water-cooling limitations of the amplifying Ti:sapphire crystal. We point out here that the maximum laser repetition rate of the system was considered in the design of the radiation shielding. Our installation was finally set to operate with a repetition rate of 1 Hz at full power to comply with radiation safety requirements. As discussed later, a higher repetition rate mode of operation is also permitted at a reduced power level.
The amplifier features a water-cooled 50 mm × 50 mm × 30 mm Ti:sapphire crystal. After amplification with 20 J total pumping energy from the four Titan lasers, the 800 nm pulse reaches 8.0 J of energy before compression at 1 Hz repetition rate.
The amplifier can optionally be easily reconfigured using 4 J of pump energy and extracting 1.9 J energy pulses at 800 nm. In this mode of operation the amplifier can be run at 5 Hz repetition rate, providing a  $50$ TW beam-line for experiments/applications requiring a higher repetition rate. Figure 3 shows the pulse energy after each pass in the final amplifier, as obtained by numerical simulations performed with MIRO code[Reference Morice25], for both the full-power/1 Hz mode and the 50 TW/5 Hz mode.

Figure 3 Pulse energy after each pass in the final amplifier as obtained by numerical simulations. The two sets of points correspond to the full-power, 1 Hz operation mode (blue points) and to the reduced power, 5 Hz operation mode (orange points).
When operating at full power, the amplified pulse is expanded to ~65 mm before entering an attenuator, which incorporates a rotating  $\lambda$/2 wave-plate and two high-performance broadband 72° polarizers, thus enabling control of the output energy from 5% to 100% in 1% steps. Before entering the final compressor, the beam is expanded by an additional refractive telescope to its final ~100 mm diameter clear aperture. In detail, the radial intensity profile exhibits a nearly super-Gaussian behaviour, which can be approximated as $I\propto \exp \left[-{\left(r/\sigma \right)}^{2n}\right]$, where n = 3 and σ = 38 mm, thus providing an $\mathrm{FWHM}$ of approximately 72 mm. This final telescope can be removed when operating the final amplifier in the ~50 TW/5 Hz mode, when smaller diameter final focusing optics are to be used.
The compressor vacuum chamber was designed as a compact shape to minimize footprint and to reduce vibrations and mechanical stress from air-to-vacuum transition on the internal optical table. This was achieved by using a custom mechanical system to decouple the optical table from the chamber vessel using two separate holding frames, as shown in Figure 4. The compressor chamber hosts a grating compressor in a folded configuration using a retro-reflector. Four gold-coated gratings (HORIBA Jobin Yvon) with 1480 grooves/mm, 135 mm×175 mm (first and fourth gratings) and 135 mm×230 mm (second and third gratings) are used giving a throughput efficiency of the compressor of about 75%. With an energy before compression of  $\unicode[STIX]{x02272} 8$ J and a compressed pulse of 5.9 J, a peak power of 220 TW can be achieved at the minimum pulse duration of 27 fs.
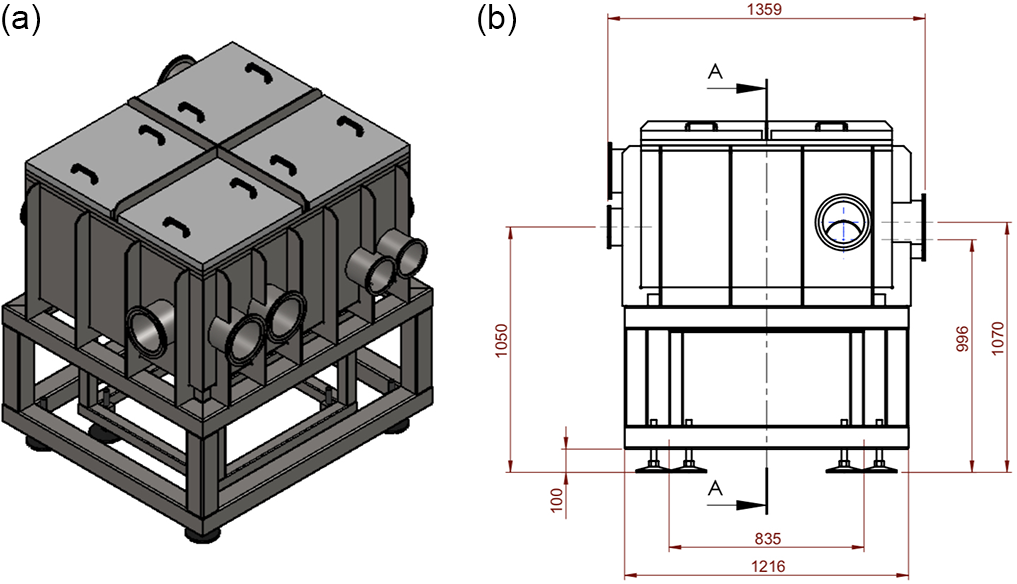
Figure 4 (a) 3D view and (b) side view of the compressor vacuum chamber.
We conclude this section by providing an overview of the triggering signals that can be sent to users to synchronize the experiment diagnostics. Basically, three different kinds of signal (LONG, SHORT FAST, SHORT SLOW), obtained along the laser chain in different ways, are available; specifications are shown in Table 1.
Table 1 Available trigger signals for experiment diagnostics.

4 Characterization of the laser pulse
As mentioned previously, a dedicated laser pulse metrology area is hosted in the high intensity target area, close to the compressor vacuum chamber, to measure and optimize pulse duration and temporal contrast. This step is normally carried out after the warming up and optimization of the laser chain, which usually takes about two hours. Furthermore, shot-by-shot energy of the amplified laser pulse during experimental runs is monitored by measuring the energy leaking through one turning mirror after the last amplifier (see Figure 1), via a detector that is cross-calibrated against a full energy measurement using an energy meter (Gentec-EO) placed in the target chamber, before the focusing optics. Shot-to-shot fluctuations of the laser pulse energy were measured as  $\unicode[STIX]{x02272} 2\%$ r.m.s. within a typical working day. Both near-field and far-field characteristics are also evaluated shot by shot using CCD cameras after the last amplifier and before the last beam expander.
Off-line measurements are then acquired daily during experimental runs. The spectrum of the laser pulse is monitored using a fibre spectrometer; Figure 5(a) shows the spectral characteristics of the laser pulse at full energy before entering the compressor chamber. Five different spectra are shown in the same plot, taken approximately every five minutes, showing the degree of stability of the bandwidth. In addition, burn paper is used to check the beam profile at full energy as shown in Figure 5(b).

Figure 5 (a) Sample spectra of the fully amplified main pulse before entering the compressor chamber. (b) Near-field burn paper image taken before compression at 3.3 J pulse energy.
An example of the far field measured at the interaction focal point of the long focal length OAP mirror is shown in Figure 6(a). This measurement was taken with the laser operating at 10 mJ energy per pulse and the attenuator at the 5% level. As shown, the focal spot has a main central region where most of the pulse energy is concentrated, with three low-intensity lobes visible in the background.

Figure 6 (a) Microscopic image of the far field taken with the long focusing optics. (b) Profiles across the vertical and horizontal directions.
The Strehl ratio measured from phase-front analysis is approximately 60% (with fluctuations limited within a few percent from shot to shot). This value refers to the uncorrected phase front, as obtained from the system without any phase-front correction. Phase-front analysis and correction were also implemented on the front-end beam, to compensate for basic optical aberrations before the injection in the main multi-pass amplifier. An incidence deformable mirror (Adaptica) with 75 mm diameter and 45° angle was inserted on the chirped beam path between the second and third (final) amplifiers. The system was equipped with a Shack–Hartmann wavefront sensor. However, it was found that minor correction was needed for the phase front before injection in the final amplifier, with a marginal increase of the Strehl ratio at this stage from close to  $0.90$ up to ~0.95. Therefore, the main losses in the Strehl ratio are expected to arise downstream of the front-end. Measurements of the focal spot, also at higher energy per pulse – up to 100 mJ, were also carried out on the beam used for laser diagnostics to identify the contributions of both the main amplifier and the compressor. These measurements indicate that the compressor is the main source of phase-front distortion. They indeed suggest that improvement in the final Strehl ratio can be obtained with phase-front correction placed after the compressor. Furthermore, installation of post-compression full-aperture adaptive optics inside the compressor chamber is currently in progress.
Pulse duration and spectral phase characteristics are measured by means of Bonzai (Amplitude Technologies) and Wizzler (Fastlite) autocorrelators, as shown in Figure 7. FWHM of the measured pulse duration is  $<$27 fs.

Figure 7 Interface of the Wizzler diagnostic systems showing (top) spectral intensity and phase and (bottom) reconstructed temporal evolution of the pulse. The duration of the pulse is shown on the right.
Finally, the pulse contrast ratio is measured by means of a third-order cross-correlator (Amplitude Technologies Sequoia). The plot in Figure 8 shows the cross-correlation curve starting 150 ps before the peak of the pulse. Clearly visible is the low level of the amplified spontaneous emission (ASE): around 10 ${}^{-9}$. We point out here that the ASE originates mainly from the last multi-pass amplier and, therefore, exhibits a larger divergence with respect to that of the main beam[Reference Keppler, Sävert, Körner, Hornung, Liebetrau, Hein and Kaluza26]. Taking into account this difference, the ASE intensity on target for the short focus OAP is estimated to be of the order of ${10}^9$ W/cm ${}^2$, a value well below the plasma formation threshold for both gas and solid targets. The contrast in the petasecond range is better than 10 ${}^6$, up to 10 ps before the peak of the pulse. This low-intensity petasecond pedestal is only relevant for laser interaction with solids with the short-focus OAP and is expected to lead to the formation of a short-scale-length preplasma, typically of the order of 100 nm, a few petaseconds before the laser peak.

Figure 8 Cross-correlation curve showing the ASE contrast level of 10 ${}^9$ and the petasecond-pedestal contrast level better than 10 ${}^6$, up to 10 ps before the peak of the pulse.
5 Target area design
The design of the target area was conceived to meet the requirements of the research programmes, optimizing the use of available laboratory space and implementing all safety standards, including radiation, laser and conventional hazard. Priority was given in the layout to a large and flexible target chamber capable of accommodating high-precision laser beam pointing and target motion control, also taking into account the impact of electromagnetic noise and pulses (EMP) on the control instrumentation. In fact, most of the control systems were placed outside the shielding bunker and were remotely controllable.
After the compressor, the laser beam is delivered to the 1500 mm inner diameter octagonal vacuum interaction chamber via a double-mirror ‘chicane’ vacuum transport line placed inside the radiation shielding bunker. Turning mirrors with two-axis gimbal mirror mounts (Vacuum FAB) are placed inside two cylindrical vacuum chambers as shown in Figure 9. Inside the interaction chamber the beam can be directed onto each one of the two OAP mirrors, using an additional metallic turning mirror.

Figure 9 Schematic layout of the target area showing the radiation shielding bunker and the beam transport from the compressor to the octagonal interaction chamber. Also shown are the two focusing configurations available as alternatives using the dedicated turning mirror. The red arrows along the beam-lines show the positions of dosimetric measurements (see Section 6).
The OAP mirrors (Space Optics Research Labs) are f/~17.5 (effective focal length 1750 mm) gold-coated and f/~3 (effective focal length 300 mm) silver-coated, set to focus the beam along two perpendicular directions. The f-numbers given above refer to the clear aperture diameter of the beam. The effective f-number should then be evaluated considering the appropriate beam diameter for the specific interaction conditions. Using the FWHM of the super-Gaussian profile, the long focal length, gold-coated OAP becomes f/24.3, while the short focal length, silver-coated OAP becomes f/4.2.
Considering the current Strehl ratio of 0.6, the long focal length gives a maximum intensity in the focal spot up to  $7\times$10 ${}^{18}$ W/cm ${}^2$ and is typically used for interaction with gas-jet targets and production of electron beams by LWFA. The short focal length gives a maximum focused intensity close to $2\times$10 ${}^{20}$ W/cm ${}^2$ on solid targets, and is used for interaction with solid targets and proton acceleration via TNSA. In this case the short-focus OAP is protected from target debris using an anti-reflection coated cellulose nitrate pellicle of 5 μm thickness and with a nominal phase distortion of less than 0.4λ.
6 Bunker design
The main features of the radiation shielding were defined taking into account the highest safety standards for radiation hazard, to ensure a dose below 1 mSv/year in the public areas surrounding the shielding. The design was dictated by structural limitations of the pre-existing laboratory environment. In view of this, the selection of shielding material was made considering the best trade-off between compactness and cost-effectiveness. Custom-made (Profeti & C.) high-density concrete was used, made with the addition of barite to reach an average density as high as 3300 kg/m ${}^3$.
Walls and ceiling were made by assembling two layers of blocks of high-density concrete of 16 cm × 30 cm × 16 cm, with a 3° double wedge on both the top and the bottom sides of each block to avoid radiation leakage, resulting in a total thickness of 32 cm and a total weight of around 70 tons. An additional ‘beam dump’ was designed along the path of the accelerated electron beam (see Figure 9) to minimize production of high-energy Bremsstrahlung photons.
Blocks were supported and encapsulated in a steel structure designed (by Castelli) according to seismic regulations, using bolted and welded steel beams. Wood beams were used to hold the two layers of shielding blocks on the ceiling. A view of the supporting structure is shown in Figure 10. The structure was conceived in such a way as to avoid, where possible, direct exposure of the steel beams to radiation, to minimize activation. This was accomplished by allowing for the steel beams to be placed behind the first layer of concrete blocks. To support the total weight, the floor was strengthened with a supporting wall built beneath, in the underground void. The supporting wall had a footprint corresponding exactly to the shielding bunker wall. Preliminary measurements of the effectiveness of the shielding were carried out during commissioning shots showing no detectable dose above the background, which was typically 1 μSv/day outside the bunker. Measurements were also taken inside the bunker, placing the dosimeter just outside the target chamber on the equatorial plane (see Figure 9), along the propagation axis of the electron and ion beam, which yielded doses of approximately 0.01 μSv/shot and 0.02 μSv/shot, respectively.

Figure 10 A view of the supporting structure of the shielding bunker.
7 Interaction chamber
As mentioned earlier, the interaction chamber (VCS) was designed to allow dual laser focusing configuration via a turning mirror set to reflect the beam on either the short focal length or the long focal length parabolic mirror. A side view and a top view of the chamber are shown in Figure 11. The design was conceived to preserve the stability of the optical table against displacements due to mechanical deformation arising from depressurization from atmospheric pressure to the operating pressure of 10 ${}^{-5}$ mbar (1 mbar = 100 Pa), which is normally reached in approximately 30 minutes. For this purpose, the support of the optical table was mechanically isolated by the vacuum vessel and directly attached to the ground via an independent bench.
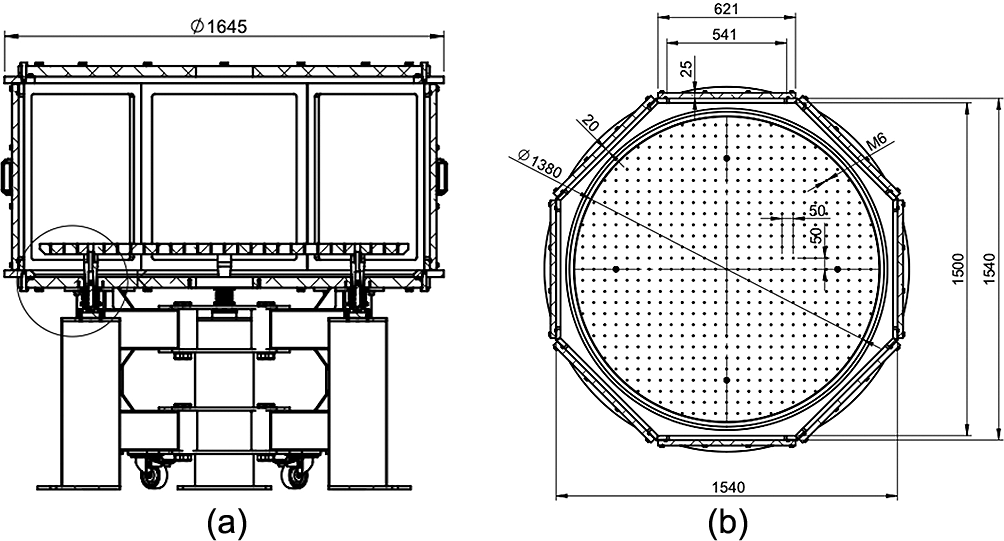
Figure 11 (a) Side view and (b) top view of the interaction chamber.
A similar approach was followed for the entire vacuum transport line, including the compressor chamber and the two small chambers inside the bunker hosting the two 90° turning mirrors, as well as for the chamber hosting the long focal length OAP (see Figure 9). The skeleton of the interaction chamber was made of stainless steel while all the ports were made of aluminium, to minimize nuclear activation. Where necessary, stiffness of the large ports was enhanced by adding reinforcement structures. This ensured negligible mechanical deformation due to the atmospheric pressure.
8 Beam pointing stability
An important parameter, often not carefully investigated at similar laser facilities, is the pointing stability of the focal spot at the interaction point, or in other words the range of fluctuation of the focal spot position from shot to shot. Several sources can contribute to the overall pointing stability at different temporal scales[Reference Toci, Mazzotta, Labate, Mathieu, Vannini, Patrizi and Gizzi27]. In addition to the optical fluctuations intrinsic to the laser cavity and amplification chain, other pointing fluctuations can be caused by mechanical vibrations (e.g., vacuum pumps), air turbulence affecting propagation of the laser pulse before compression and thermal fluctuations across different sections of the system. Accurate investigation[Reference Toci, Mazzotta, Labate, Mathieu, Vannini, Patrizi and Gizzi27] of pointing stability can enable identification and quantification of these contributions and, possibly, correction or mitigation with appropriate measures.
In our system, beam pointing stability was measured inside the interaction chamber at the focal point using microscopic imaging of the focal spot to evaluate both the intrinsic laser beam pointing stability and the mechanical stability of the transport line. Here we show the results obtained at low laser intensity, measuring the position of the focal spot of the long focal length focusing optics with the resolution of a micrometer. These measurements enabled us to identify sources of vibration originating mainly from dry vacuum pumps. We successfully used passive dampers and isolators to reduce these vibrations.
The plot in Figure 12 shows that the fluctuation of the focal spot angular deflection after basic correction is contained in a range of 0.6 μrad in the horizontal direction and 0.9 μrad in the vertical direction, taken at  $1/{e}^2$ of the distribution and corresponding to a small fraction of the focal spot in the focal plane. These results enable a reliable laser–target coupling even in the most demanding cases like those involving capillary discharge plasma targets used for LWFA[Reference Leemans, Gonsalves, Mao, Nakamura, Benedetti, Schroeder, Tóth, Daniels, Mittelberger, Bulanov, Vay, Geddes and Esarey28].
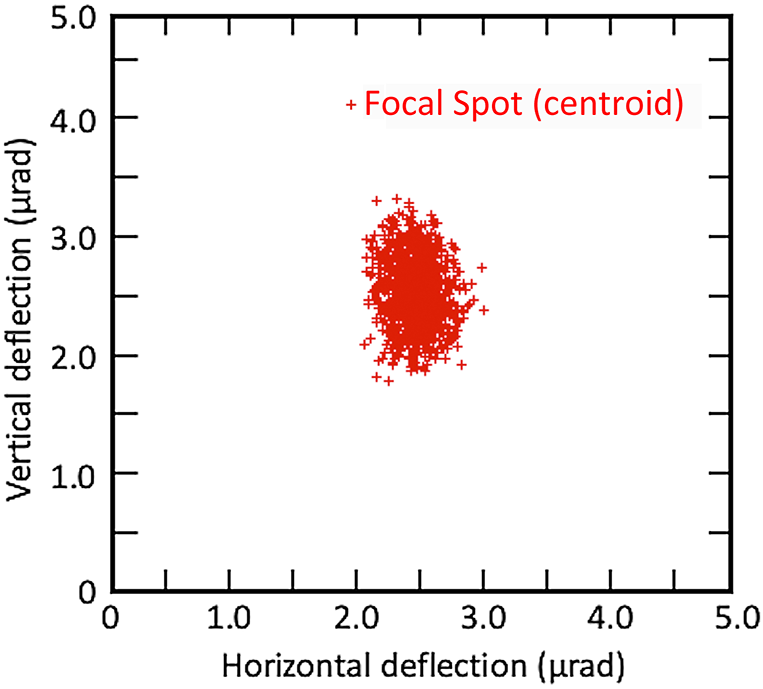
Figure 12 Plot of the beam pointing stability showing the angular deflection of the centroid of the focal spot for approximately 1000 images.
A set of commissioning experiments were carried out to assess control of the above specifications of both the laser and the interaction area. Test experiments based on TNSA were carried out[Reference Gizzi, Baffigi, Brandi, Bussolino, Cristoforetti, Fazzi, Fulgentini, Giove, Koester, Labate, Maero, Palla, Romé and Tomassini29] throughout the upgrade process to infer laser intensity on target and temporal contrast issues. Measured proton cut-off energy was consistently found to be in agreement with published scaling laws[Reference Daido, Nishiuchi and Pirozhkov3, Reference Macchi, Borghesi and Passoni4]. Moreover, measurements of LWFA were also carried out for development of a platform for radiobiological studies of very high-energy electrons (VHEEs)[Reference Labate, Palla, Panetta, Avella, Baffigi, Brandi, Di Martino, Fulgentini, Giulietti, Köster, Terzani, Tomassini, Traino and Gizzi10] and high-temporal-resolution medical imaging[Reference Panetta, Labate, Billeci, Lascio, Esposito, Faita, Mettivier, Palla, Pandola, Pisciotta, Russo, Sarno, Tomassini, Salvadori, Gizzi and Russo30].
9 Summary
The ILIL is described in detail following the latest upgrade, which includes both the laser and the high-intensity experimental area. The main features are fully described and the ILIL-PW installation is currently operational, delivering beam time for multi-disciplinary research and open access for collaborative national and international projects focused on laser-driven particle acceleration and biomedical applications, as well as studies devoted to high-energy density and extreme matter states.
Acknowledgements
The ILIL-PW upgrade was established in the framework of the Italian Research Network on Extreme Light Infrastructure (ELI-Italy) funded by CNR. The authors acknowledge financial contribution from the EuPRAXIA project of the EU Horizon 2020 Research and Innovation Program under Grant Agreement No. 653782 and from the Line for Laser Light Ion Acceleration (L3IA) project funded by INFN, Italy.


 Open access