


1 Introduction
Over the past 15 years, the generation of multi-MeV proton and ion beams with unique properties has attracted intense interest due to the numerous fundamental and applicative prospects these beams offer[Reference Wilks, Kruer, Tabak and Langdon1–Reference Kaluza, Schreiber, Santala, Tsakiris, Eidmann, Meyer-ter-Vehn and Witte5]. The mechanism proposed here constitutes a novel laser driven ion acceleration scheme[Reference Silva, Marti, Davies, Fonseca, Ren, Tsung and Mori2] that offers greater control on the energy of the ions. In this mechanism, ions are accelerated by being pushed by the potential barrier located at a collisionless shock front generated by the laser source[Reference Silva, Marti, Davies, Fonseca, Ren, Tsung and Mori2, Reference He, Dong, Sheng, Weng, Chen, Wu and Zhang6–Reference Antici, Boella, Chen, Andrews, Barberio, Böker, Cardelli, Feugeas, Glesser, Nicolaï, Romagnani, Scisciò, Starodubtsev, Willi, Kieffer, Tikhonchuk, Pépin, Silva, d’Humières and Fuchs9].
Although in most previous studies of ion acceleration solid targets are used, gas targets may provide debris-free acceleration and a reduction of unnecessary secondary radiation, such as bremsstrahlung. Gas jets are also considered as sources of high-purity high- $Z$ (e.g., Kr, Xe) ion beams and thus are considered as an alternative to solid foils. Gas jets are easily replenished targets, as opposed to foils, operating at high-repetition rates and offering controllable material properties[Reference Willingale, Mangles, Nilson, Clarke, Dangor, Kaluza and Schreiber10]. The main disadvantage, however, is the difficulty to reach densities higher than the critical density, which is necessary for efficient ion acceleration, e.g., for $1~\unicode[STIX]{x03BC}\text{m}$ laser wavelength, $n_{c}\approx 10^{21}~\text{cm}^{-3}$[Reference Esirkepov, Yamagiwa and Tajima11, Reference Willingale, Mangles, Nilson, Clarke, Dangor, Kaluza, Thomas, Wei, Krushelnick and Nahmudin12]. A way to overcome this obstacle is by using longer wavelength lasers. For example, for an infrared $\text{CO}_{2}$ laser with a wavelength of approximately $10~\unicode[STIX]{x03BC}\text{m}$, the critical density is $n_{c}(\propto \unicode[STIX]{x1D706}^{-2})\approx 10^{19}~\text{cm}^{-3}$. This density is easily obtained by the ionization of gas targets via a prepulse.
The generation and subsequent properties of shock accelerated ion beams are highly dependent on the initial plasma density distribution[Reference Fiuza, Stockem, Boella, Fonseca, Silva, Haberberger and Joshi13–Reference Palmer, Dover, Pogorelsky, Babzien, Dudnikova, Ispiriyan and Najmudin15]. In experiments performed using intense  $\text{CO}_{2}$ lasers, it is surmised that the profile is modified by a pulse train inherent to the laser system[Reference Palmer, Dover, Pogorelsky, Babzien, Dudnikova, Ispiriyan and Najmudin15, Reference Haberberger, Tochitsky, Fiuza, Gong, Fonseca, Silva and Joshi16], which varies from shot to shot, thus making the interactions challenging to reproduce. A technique to overcome this problem is the preparation of the gas target by an optically generated hydrodynamic blast wave from a lower energy laser prepulse. Such a method, where two different pulses are used to accelerate ions, has been recently demonstrated[Reference Tresca, Dover, Cook, Maharjan, Polyanskiy, Najmudin and Pogorelsky17]. Considering an opaque and near-critical initial density, the lower energy prepulse forms a blast wave with steepened particle density, thus resulting in an overcritical density. After a few nanoseconds, the second and high energy main pulse accelerates the ions at the front of the shock[Reference Tresca, Dover, Cook, Maharjan, Polyanskiy, Najmudin and Pogorelsky17].
In the present study, which is based on the work of Tresca et al. [Reference Tresca, Dover, Cook, Maharjan, Polyanskiy, Najmudin and Pogorelsky17], the hydrodynamic expansion of the blast wave due to the prepulse and corresponding density is computationally studied for parameters relevant to the specifications of the two aforementioned lasers. This research is focused only on the hydrodynamic expansion stage and not on the heating stage from the laser[Reference Dover, Cook, Tresca, Ettlinger, Maharjan, Polyanskiy and Najmudin14]. The absorption efficiency and spatial profile could be affected nonlinearly by the prepulse energy, but the laser plasma absorption mechanism studies are beyond the scope of this work. The hydrodynamic simulation results demonstrate that by controlling the laser pulse energy, the deposition position and the backing pressure, a blast wave suitable for studying collisionless shock acceleration can be formed. The proposed model is purely hydrodynamic, with low computational power demands, since it does not include heat conduction and ion viscosity or ionization on the blast wave front. To extend the findings of previous research works, we explore new conditions including scanning of the initial density and the energy deposited, for two different wavelength regimes (Brookhaven National Laboratory (BNL) and Vulcan), using an existing and benchmarked model[Reference Dover, Cook, Tresca, Ettlinger, Maharjan, Polyanskiy and Najmudin14, Reference Tresca, Dover, Cook, Maharjan, Polyanskiy, Najmudin and Pogorelsky17]. This will help future experiments determine the plasma heating requirements for generating density profiles favourable for quasimonoenergetic ion beam generation.
Considering the case of the BNL  $\text{CO}_{2}$, for three different densities of the gas, four different absorbed energy values and deposition positions varying from 0.02 to 0.1 cm from the axis of the jet are simulated. These models are also used to simulate the case of the Vulcan laser system for the study of six different absorbed energy values. The spatiotemporal evolution of the particle densities corresponding to various pulse energies, laser focal positions and backing pressures is compared to optimize the steepened density gradients of the blast wave walls. The computational results of these simulations provide valuable data leading to optimization of the jets and the laser systems used in experiments and simulations that focus on particle acceleration.
2 Physical modelling
In the first stage of the laser–gas interaction, the main mechanism of energy absorption is the inverse bremsstrahlung heating. Electrons gain energy from the incident optical high power laser pulse via collisions. At a very high field strength, gases break down, i.e., they become highly ionized, accompanied by a light flash. The electron–ion collision frequency is given by[Reference Kruer18, Reference Dendy19]
 $$\begin{eqnarray}\displaystyle v_{\text{ei}} & = & \displaystyle \frac{1}{3(2\unicode[STIX]{x1D70B})^{3/2}}\frac{n_{e}Ze^{4}\ln \unicode[STIX]{x039B}}{\unicode[STIX]{x1D700}_{0}^{2}m_{e}^{1/2}(k_{b}T_{e}[\text{K}])^{3/2}}\nonumber\\ \displaystyle & {\approx} & \displaystyle \frac{2.9\times 10^{-12}n_{e}Z[\text{m}^{-3}]}{(T_{e}[\text{eV}])^{3/2}}\ln \unicode[STIX]{x039B},\end{eqnarray}$$
 where  $n_{e}$ is the plasma electron density, $Z$ is the atomic number, $k_{b}$ is the Boltzmann constant, $T_{e}$ is the electron temperature and $\ln \unicode[STIX]{x039B}$ is the Coulomb logarithm. The free electron density depends on the ionization fraction, which is dynamic as an increasing amount of energy is absorbed in the plasma. The absorption coefficient for inverse bremsstrahlung is given by
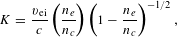 $$\begin{eqnarray}K=\frac{v_{\text{ei}}}{c}\left(\frac{n_{e}}{n_{c}}\right)\left(1-\frac{n_{e}}{n_{c}}\right)^{-1/2},\end{eqnarray}$$
 where  $n_{c}$ is the critical electron density. The corresponding fraction of the laser energy thermally absorbed by the plasma is
 $$\begin{eqnarray}\unicode[STIX]{x1D702}\approx 1-\exp (-KZ_{R}),\end{eqnarray}$$
 where  $Z_{R}$ is the Rayleigh length. For a few ps pulse duration, the hydrodynamic expansion of the plasma is negligible. Considering that the heating is uniform inside the cylindrical volume defined by the beam waist $w_{0}$ and twice the Rayleigh length $Z_{R}$, then for hydrogen $(Z=1)$, the plasma temperature due to the laser heating is given by[Reference Dover, Cook, Tresca, Ettlinger, Maharjan, Polyanskiy and Najmudin14]
 $$\begin{eqnarray}T_{e}(t)[\text{eV}]=\frac{1}{2n_{e}Z_{R}e}\int _{0}^{t}I_{L}\{1-\exp [-K(t)Z_{R}]\}\,\text{d}t.\end{eqnarray}$$
 In the frame of the present work, after the initial energy deposition, the heated plasma hydrodynamically expands into the surrounding ambient medium as a blast wave in a similar way to the Sedov or adiabatic stage of supernova or atomic explosions[Reference Sedov20–Reference Sachdev22]. The hydrodynamic code FLASH, created by the Flash Center for Computational Science at the University of Chicago, has been used to simulate the interaction of a laser pulse with an ambient hydrogen gas target, having an initial density approximately above  $0.5\times 10^{17}~\text{cm}^{-3}$. The 1 mJ energy of the BNL
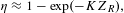
  $\text{CO}_{2}$ prepulse is deposited in the gas target, and, thus, a blast wave is formed that expands in the ambient medium, as presented in Figure 1. Gas is accumulated on the walls of the shock resulting in a six times higher density, as compared to the initial density, forming a cavity at the centre. This compression factor depends on the composition of the gas of the medium since the collisionality differs for various elements. When the blast shock wave is strongly driven, the equations of motion follow the self-similar Sedov solution presented below[Reference Sedov20].
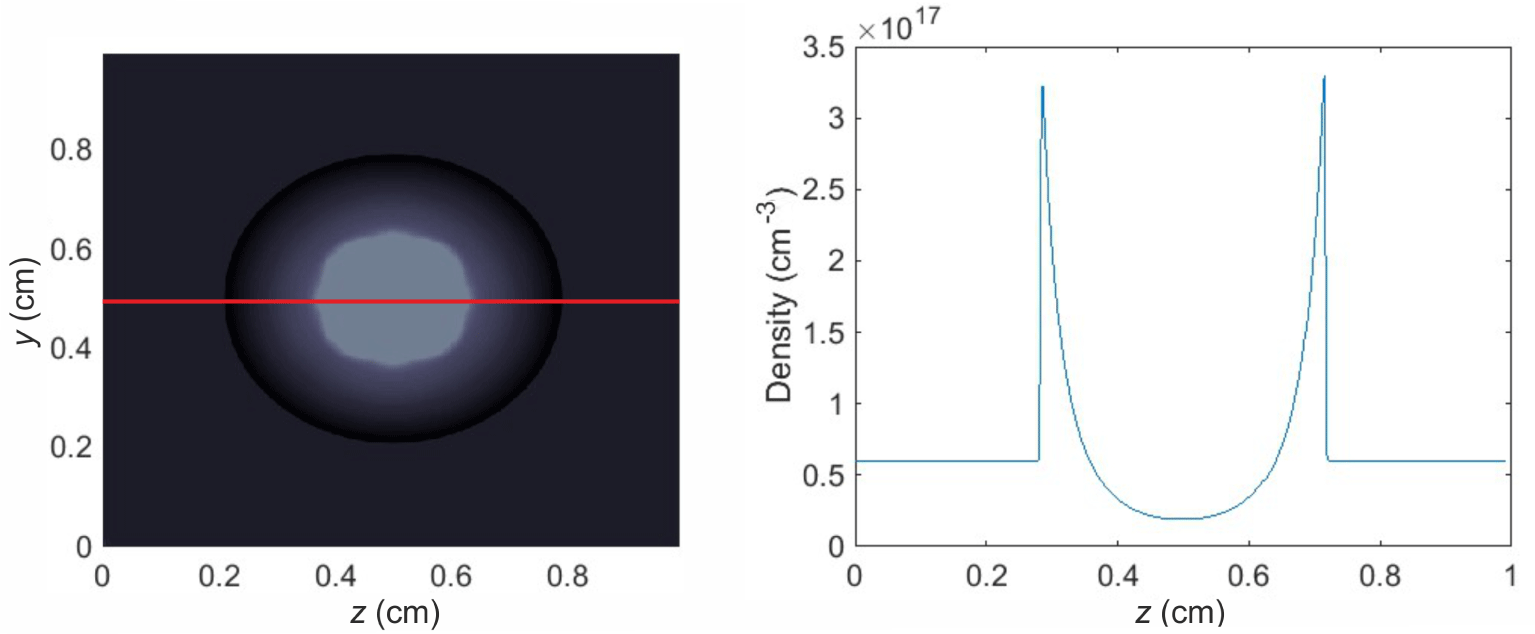
Figure 1. Simulation of the spherical expansion of the blast wave (left) and the lineout (red line) of the steep density walls at the front of the shock (right) in an homogeneous hydrogen gas, for initial density of  $0.5\times 10^{17}~\text{cm}^{-3}$ and 1 mJ absorbed energy of the BNL $\text{CO}_{2}$ laser.
The expansion velocity  $u_{\text{sh}}(r,t)$, density $\unicode[STIX]{x1D70C}(r,t)$, pressure $p(r,t)$ and other properties of a blast wave are determined solely by two parameters of the system, the absorbed energy $E_{\text{abs}}$ and the initial density $\unicode[STIX]{x1D70C}_{0}$, by the Sedov self-similar solution. The radius of the blast wave is given by
 $$\begin{eqnarray}r_{\text{bw}}(t)=\unicode[STIX]{x1D701}_{0}(\unicode[STIX]{x1D6FE})\left(\frac{E_{\text{abs}}}{\unicode[STIX]{x1D70C}}\right)^{1/(2+\unicode[STIX]{x1D6FC})}t^{2/(2+\unicode[STIX]{x1D6FC})},\end{eqnarray}$$
 where  $\unicode[STIX]{x1D6FC}=1,2,3$ is the dimensionality of the shock for a shock having a plane, cylindrical or spherical symmetry respectively, $\unicode[STIX]{x1D70C}$ is the mass density of the ambient gas and $\unicode[STIX]{x1D701}_{0}(\unicode[STIX]{x1D6FE})$ is a numerical constant of order unity[Reference Zel’Dovich and Raizer21].
The expansion rate of the shock is described by
 $$\begin{eqnarray}u_{\text{sh}}=\frac{\text{d}r(t)}{\text{d}t}=\frac{2}{2+a}\unicode[STIX]{x1D701}_{0}(\unicode[STIX]{x1D6FE})\left(\frac{E_{\text{abs}}}{\unicode[STIX]{x1D70C}}\right)^{1/(2+a)}t^{2/(2+a)-1}.\end{eqnarray}$$
 By solving Equation (5) for the variable  $t$ and by introducing it in Equation (6), the expansion rate of the shock may be described by
 $$\begin{eqnarray}u_{\text{sh}}=\frac{2}{2+a}[\unicode[STIX]{x1D701}_{0}(\unicode[STIX]{x1D6FE})]^{(2+a)/2}\left(\frac{E_{\text{abs}}}{\unicode[STIX]{x1D70C}}\right)^{1/2}r^{-a/2}.\end{eqnarray}$$
 The velocity of the shock is  $\propto r^{-1/2},\propto r^{-1}$ and $\propto r^{-3/2}$ for the plane, cylindrical and spherical cases, respectively, which means that the velocity reduces as the shock wave expands. The self-similar blast wave solution is not valid for the whole expansion duration; for instance, at $t\rightarrow 0$, the solution approaches an infinite expansion rate.
The density scale length is a parameter of major importance in controlling the properties of accelerated ions and is the distance over which the density decreases by a factor of  $e$. A steep initial front surface plasma density scale length is crucial not only to achieve shock acceleration but also for the spectral control of the ion beam. It has been observed that long density gradients in hydrogen plasmas lead to the production of broadband shock accelerated ion beams, while steeper gradients allow for the generation of quasimonoenergetic beams as explained in Refs. [Reference Tresca, Dover, Cook, Maharjan, Polyanskiy, Najmudin and Pogorelsky17, Reference Palmer, Dover, Pogorelsky, Streeter and Najmudin23].
The density profiles of a blast wave, corresponding to the BNL  $\text{CO}_{2}$ laser at 4 bar initial pressure and absorbed energy of $E=20~\text{mJ}$ along the laser propagation axis, are presented in Figure 2. The laser beam is focused close to the exit of the nozzle (i.e., at $y\approx 0$ and $z=-0.02~\text{cm}$; see Figure 2 inset). At these heights above the nozzle exit, it has been shown that the density profile can be approximated by a triangle[Reference Najmudin, Palmer, Dover, Pogorelsky, Babzien, Dangor, Dudnikova, Foster, Green, Ispiriyan, Neely, Polyanskiy, Schreiber, Shkolnikov and Yakimenko24]. The density profiles of a shock for $t=0$, 1, 12 and 20 ns are shown. The blast wave is seen to expand and most of the density is accumulated at the walls. The absence of symmetry is due to the deposition of energy away from the centre of the gas jet along the $z$-axis. It is evident that the right side of the blast wave, which has propagated through the centre of the gas, accumulates sequentially more particles, thus resulting in a higher shock wall density, shown by the right red curve. Furthermore, it is seen that the scale length increases with increasing time. The density profile is very sharp in the first nanosecond of the production of the shock (right red curve). After 11 ns, it becomes less steep (yellow curve), and finally after 20 ns, it has widened in space noticeably (purple curve).
Figure 2. Time evolution of density profiles along the laser propagation axis for a blast wave at  $t=0,1,12$ and 20 ns, corresponding to the BNL $\text{CO}_{2}$ laser, at 4 bar initial pressure and absorbed energy 20 mJ. The laser beam is focused at $z=-0.02~\text{cm}$.
3 Numerical modelling
The modular, parallel, multiphysics simulation code FLASH was used for our simulations[Reference Lamb, Harder, Weide, Feister, Walker, Truran, Tzeferacos, Dubey, Flocke, Laute and Graziani25]. FLASH handles general compressible flow problems by solving the Euler equations for compressible gas dynamics, expressed in the conservative form:
 $$\begin{eqnarray}\displaystyle \begin{array}{@{}l@{}}\displaystyle \frac{\unicode[STIX]{x2202}\unicode[STIX]{x1D70C}}{\unicode[STIX]{x2202}t}+\overset{\rightharpoonup }{\unicode[STIX]{x1D6FB}}\cdot \left(\unicode[STIX]{x1D70C}\overset{\rightharpoonup }{v}\right)=0,\\[5.0pt] \displaystyle \frac{\unicode[STIX]{x2202}\unicode[STIX]{x1D70C}\overset{\rightharpoonup }{v}}{\unicode[STIX]{x2202}t}+\overset{\rightharpoonup }{\unicode[STIX]{x1D6FB}}\cdot \left(\unicode[STIX]{x1D70C}\overset{\rightharpoonup }{v}\overset{\rightharpoonup }{v}\right)+\overset{\rightharpoonup }{\unicode[STIX]{x1D6FB}}P=\unicode[STIX]{x1D70C}\overset{\rightharpoonup }{g},\\[5.0pt] \displaystyle \frac{\unicode[STIX]{x2202}\unicode[STIX]{x1D70C}E}{\unicode[STIX]{x2202}t}+\overset{\rightharpoonup }{\unicode[STIX]{x1D6FB}}\cdot [(\unicode[STIX]{x1D70C}E+P)\overset{\rightharpoonup }{v}]+\overset{\rightharpoonup }{\unicode[STIX]{x1D6FB}}P=\unicode[STIX]{x1D70C}\overset{\rightharpoonup }{v}\cdot \overset{\rightharpoonup }{g},\end{array} & & \displaystyle\end{eqnarray}$$
 where  $\unicode[STIX]{x1D70C}$ is the fluid density, $\overset{\rightharpoonup }{v}$ is the fluid velocity, $P$ is the pressure, $E$ is the sum of the internal energy $\unicode[STIX]{x1D700}$ and kinetic energy per unit mass, $E=\unicode[STIX]{x1D700}+\frac{1}{2}v^{2}$, and $g$ is the gravity acceleration. The pressure is obtained from the energy and density using the equation of state:
 $$\begin{eqnarray}P=(\unicode[STIX]{x1D6FE}-1)\unicode[STIX]{x1D70C}\unicode[STIX]{x1D700}.\end{eqnarray}$$
This partial differential equation system of the Euler equations is solved using an unsplit hydrodynamic solver with third-order interpolation which corresponds to the piecewise parabolic method (PPM). The PPM scheme is a higher-order extension of Godunov’s method[Reference Godunov26, Reference Godunov, Zabrodin and Prokopov27] that uses a finite-volume spatial discretization of the Euler equations, combined with an explicit forward time difference. This solution scheme was introduced by van Leer in the MUSCL (Monotonic Upstream-centered Scheme for Conservation Laws) algorithm[Reference Van Leer28, Reference Van Leer and Woodward29]. The PPM scheme provides a substantial advance over MUSCL in several aspects[Reference Colella and Woodward30]. The introduction of parabolic fits as basic interpolation functions in a zone allows for a more accurate representation of smooth spatial gradients as well as a steeper representation of the captured discontinuities and particularly the contact discontinuities. The representation of the nonlinear wave interactions used to compute fluxes is substantially simpler than the one used in MUSCL, thus providing a less complicated and robust algorithm.
A major advantage of the FLASH code is that the simulation domain is discretized and refined by the help of an adaptively mesh refined (AMR) grid. The application of AMR grid is based on an initial Eulerian grid where the regions that require finer resolution are identified and finer sub-grids (extra computational cells) are generated. This refinement process is controlled by the help of a local truncation error estimator[Reference Lamb, Harder, Weide, Feister, Walker, Truran, Tzeferacos, Dubey, Flocke, Laute and Graziani25].
FLASH includes two AMR algorithms, the default PARAMESH package that was used in our study and CHOMBO[Reference MacNeice, Olson, Mobarry, De Fainchtein and Packer31] that uses a block-structured adaptive mesh refinement scheme[Reference Berger and Oliger32–Reference DeZeeuw and Powell34]. The complete computational grid consists of a collection of blocks with different physical cell sizes, which are related to each other in a hierarchical way using a tree data structure. The blocks at the root of the tree include the big cells (parents), while their children have smaller cells and are further refined[Reference Sedov20].
4 Numerical hydrodynamic simulations
An analytic model developed for this study is based on a customized version of the Sedov model, as described in detail in Ref. [Reference Dover, Cook, Tresca, Ettlinger, Maharjan, Polyanskiy and Najmudin14]. The advantage of cylindrical symmetry is used for the 2D model, as proposed in Ref. [Reference Dover, Cook, Tresca, Ettlinger, Maharjan, Polyanskiy and Najmudin14], and the energy deposition is numerically defined by the beam waist and the Rayleigh length to form a cylinder representing the confocal volume of the beam as shown in the left of Figure 3. The test case of the  $\text{CO}_{2}$ laser at BNL is studied. The beam waist radius is $w_{0}=35~\unicode[STIX]{x03BC}\text{m}$ and the corresponding Rayleigh length is $Z_{R}=374~\unicode[STIX]{x03BC}\text{m}$. At $t=0$, the beam is focused at $z=-0.06~\text{cm}$, as schematically depicted in the inset of Figure 2. The ambient pressure of the chamber, the initial gas pressure and temperature as well as the nozzle length, throat and exit diameters can be defined accordingly.
The boundary conditions are reflecting on the axis of the cylinder, on the left of the domain, to model the cylindrical symmetry. Outflow boundary conditions (zero-gradient boundary conditions) are applied to the rest of the three sides, allowing shocks to leave the computational domain without any reflections.
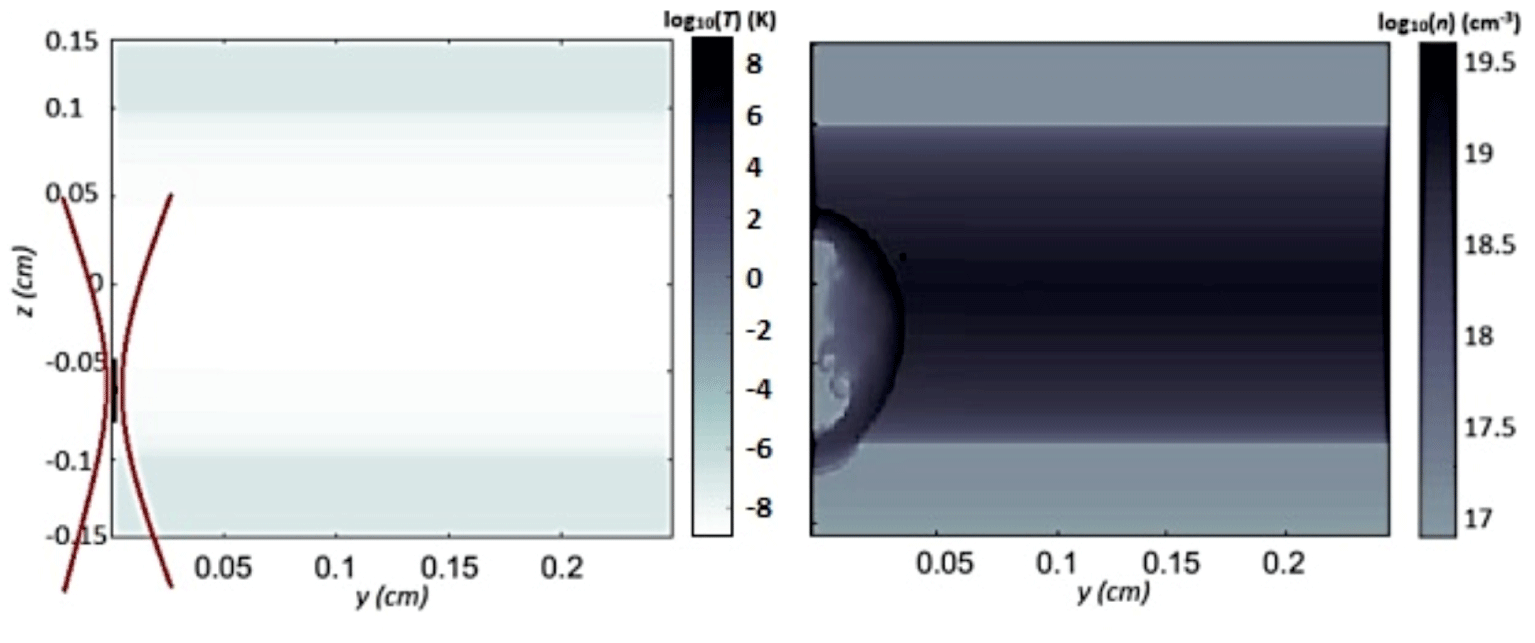
Figure 3. Left: the cylinder where the energy is deposited, representing the confocal volume of the laser pulse with  $w_{0}=35~\unicode[STIX]{x03BC}\text{m}$ and $Z_{R}=374~\unicode[STIX]{x03BC}\text{m}$. At $t=0$, the beam is focused at $z=-0.06~\text{cm}$ along the laser propagation axis ( $z$-axis) along the direction of the gas flow ( $y$-axis). Right: the formation of the blast wave at $t=4~\text{ns}$ corresponding to the $\text{CO}_{2}$ specifications, at 4 bar initial pressure and absorbed energy 100 mJ, deposited at $z=-0.02~\text{cm}$.
As depicted in the right part of Figure 3, when the blast wave propagates along the positive direction of the  $z$-axis, the front of the wave meets dense gas. On the contrary, the back of the blast wave has already reached the edge of the jet’s cone and starts to deform in the ambient gas. By taking advantage of the cylindrical symmetry, the $zy$ symmetric cross-section plane of the blast wave is simulated and presented.
Alongside with the initial conditions of the numerical problem, the throat and exit diameters as well as the length of the nozzle are set. The nozzle simulated is a so called ‘1 mm’ nozzle, with a throat diameter of 0.5 mm, an exit diameter of 1 mm and length of 4 mm. The longitudinal density profile can be approximated as a triangle[Reference Najmudin, Palmer, Dover, Pogorelsky, Babzien, Dangor, Dudnikova, Foster, Green, Ispiriyan, Neely, Polyanskiy, Schreiber, Shkolnikov and Yakimenko24]. This triangular shape used in the simulations in this study, as well as the initial energy deposition, is shown in Figure 4. The deposition of the energy across the focal volume is considered homogeneous. The trapezoidal shape of the energy deposition (red line) ensures that the initial energy is deposited homogeneously across the deposition satisfying the following equation:
 $$\begin{eqnarray}n_{a}k_{B}T_{c}=n_{b}k_{B}T_{b},\end{eqnarray}$$
 where  $a$,
$a$,  $b$ and $c$ subscripts correspond to the points in Figure 4.
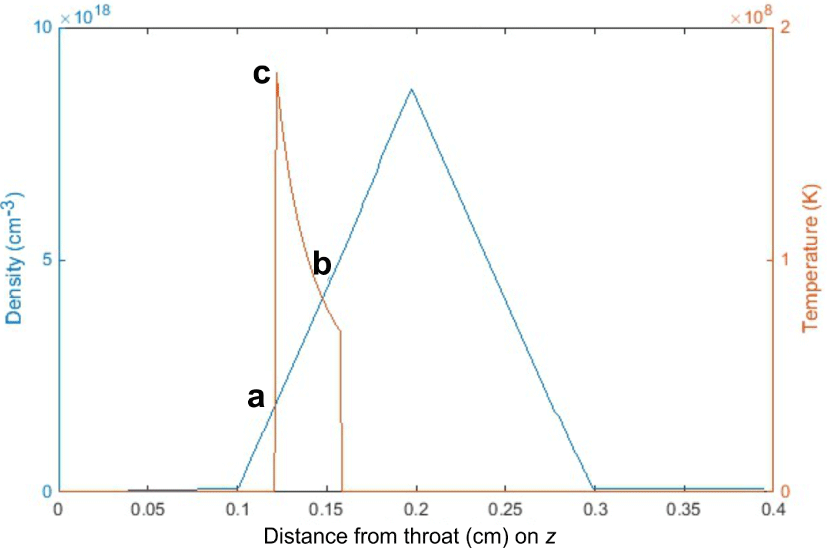
Figure 4. The triangular density shape used in the simulation (blue) and the initial energy deposition (red), for  $w_{0}=35~\unicode[STIX]{x03BC}\text{m}$, $Z_{R}=374~~\unicode[STIX]{x03BC}\text{m}$ and $E_{\text{abs}}=10~\text{mJ}$.
The initial grid of cells that models the computational domain for all of the simulations performed had an initial uniform discretization of  $42\times 8$ cells, in the $X$ and $Y$ directions, respectively, with a starting size of $0.05~\text{cm}\times 0.04~\text{cm}$. The eighth order (up to the eighth child cell) of the maximum refinement scheme is always used, which leads to the refined cells selected by AMR sub-domains, to a minimum cell size of $3.91\times 10^{-4}$ to $3.12\times 10^{-4}~\text{cm}$. The simulations were performed on the CX1 Cluster of Imperial College London, on one node of 16 cores and 14 GB memory[35]. On CX1, the simulation runtimes range from 5 min up to the maximum of 30 min, even for the most time-consuming cases. In order to keep the wall clock time of the simulation runtimes within this time range, the discretization parameters for all of the models was kept constant. The resulting course domain discretization is responsible for the lack of smoothness of the resulting curves that represent the ratio of the peak electron density to the critical density, in Figures 7–9.
5 Results and discussion
5.1 BNL  $\text{CO}_{2}$ case

The simulations performed focused on the investigation of the density profiles of the blast waves and the determination of the time over which the main pulse irradiates the overdense plasma. The FLASH code is set to output data files at every nanosecond simulated, the wavelength to  $\unicode[STIX]{x1D706}=10.3~\unicode[STIX]{x03BC}\text{m}$ and the critical density to $n_{c}=9.99\times 10^{18}~\text{cm}^{-3}$. The profile of the molecular density distribution for the three gas jet densities at BNL is presented in Figure 5. Three initial molecular densities of $n=3.39\times 10^{18}~\text{cm}^{-3}$, $n=4.42\times 10^{18}~\text{cm}^{-3}$ and $n=5.09\times 10^{18}~\text{cm}^{-3}$ (that correspond to 0.34, 0.44, 0.51 of $n_{c}$ for 4, 5, 6 bar of backing pressure, respectively) were tested using the FLASH code for the gas jet simulations, for four absorbed energies in the range of 0.1–100 mJ and five laser focused areas in the range of 0.1–0.02 cm away from the centre ( $z$-axis) of the jet. The nozzle characterization was performed at Imperial College using a Mach–Zehnder interferometer setup. For our simulations, these molecular density profiles ensure that the maximum density used is under the peak value of these profiles.
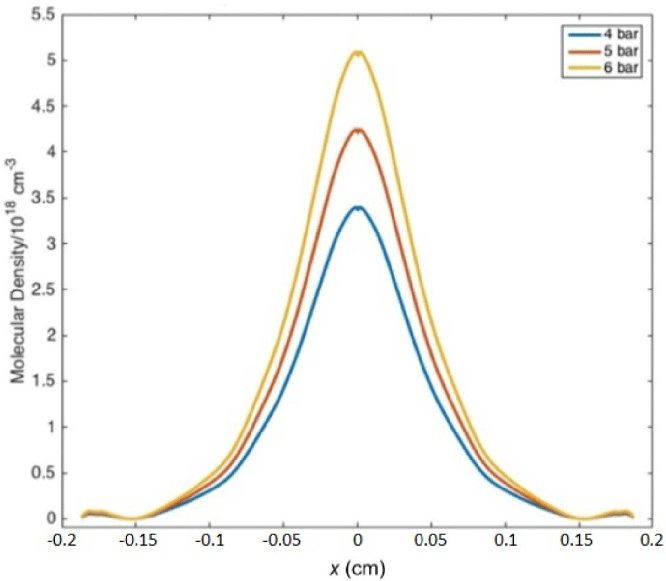
Figure 5. The profiles of backing pressures of 4, 5 and 6 bar (maximum) that correspond to the molecular densities of  $n=3.39\times 10^{18}~\text{cm}^{-3}$, $n=4.42\times 10^{18}~\text{cm}^{-3}$ and $n=5.09\times 10^{18}~\text{cm}^{-3}$, respectively.
A comparison example for the case of  $E_{\text{abs}}=20~\text{mJ}$ deposited at 0.02 cm prior to the centre of the throat and $n=3.39\times 10^{18}~\text{cm}^{-3}$ is demonstrated in Figure 6. The radius that corresponds to the position of the front of the shock in the laser propagation axis (i.e., $z$-axis) is presented. It follows Equation (5), taking into account the correction for the changing density. As it can be clearly seen, the FLASH numerical and the analytical results of the Sedov-based model[Reference Dover, Cook, Tresca, Ettlinger, Maharjan, Polyanskiy and Najmudin14] are in a good agreement.
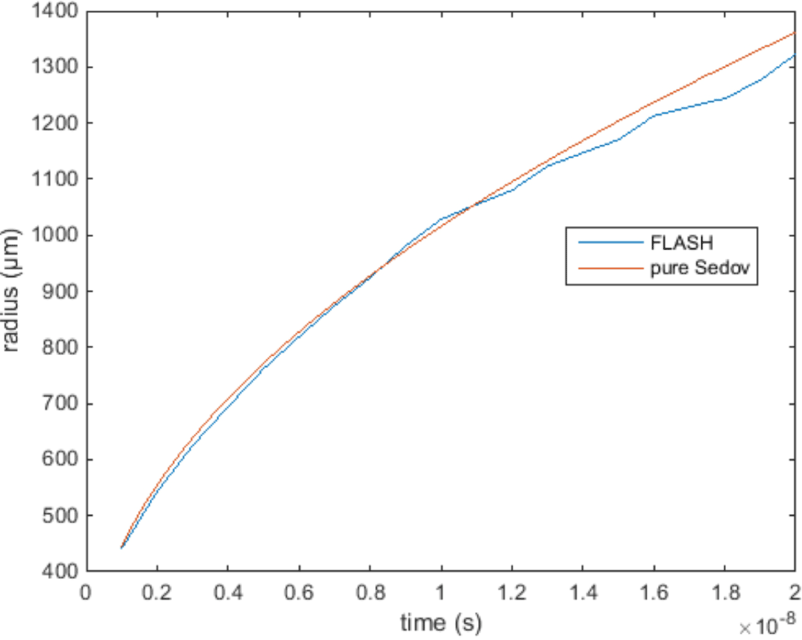
Figure 6. Comparison of the FLASH and self-similar Sedov results for 20 mJ absorbed energy, for initial density  $n=3.39\times 10^{18}~\text{cm}^{-3}$, deposited at 0.02 cm prior to the centre of the throat.
Following this, four energies of 1, 5, 20 and 100 mJ were studied. The results of the blast wave radii and the corresponding ratio of the peak electron density to the critical density are presented in Figure 7 for a backing pressure of 4 bar. The electron density that corresponds to twice the molecular density is adopted.
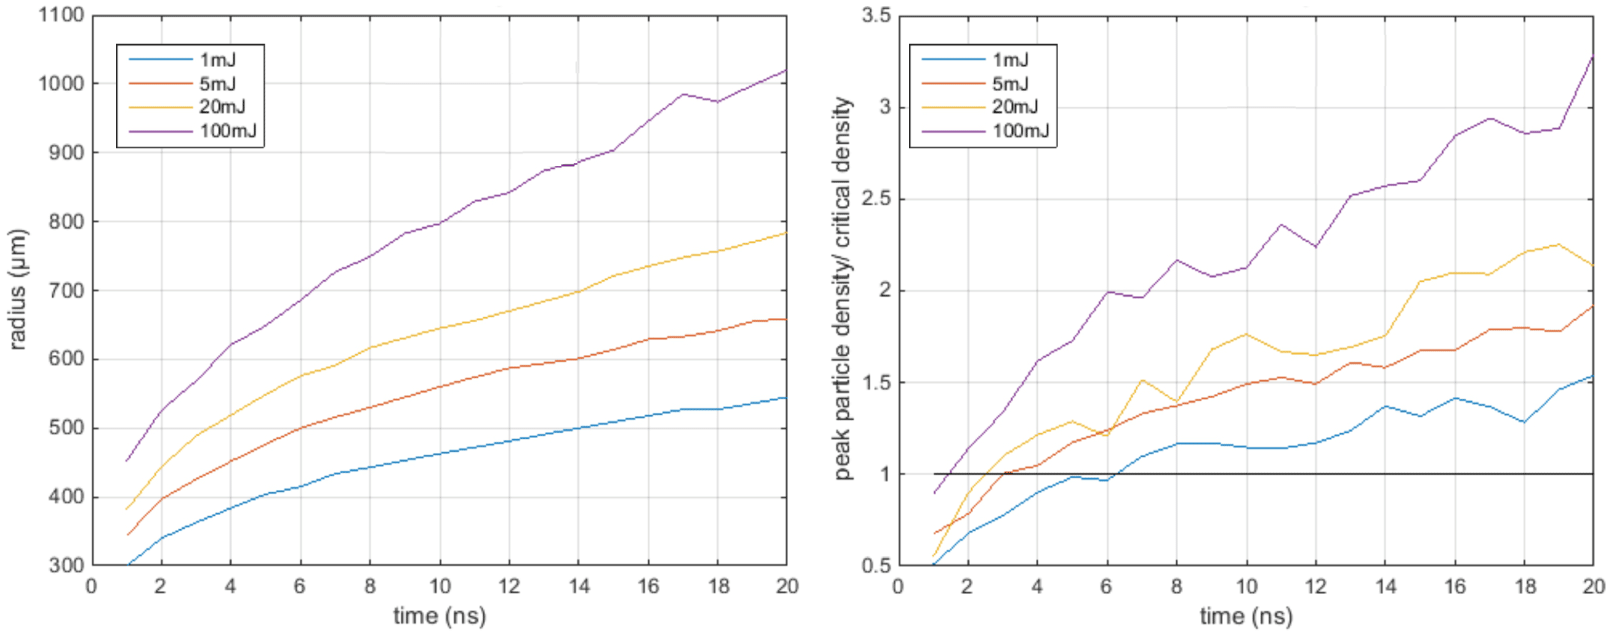
Figure 7. The blast wave radii (left) and the corresponding ratio of the peak electron density to the critical density (right). Time evolution up to 20 ns for 1, 5, 20 and 100 mJ absorbed energy deposited at  $z=0.1~\text{cm}$ prior to the centre of the throat. Initial density was set to $n=3.39\times 10^{18}~\text{cm}^{-3}$.
The time frame within which the main pulse interacts with the target is highly dependent on the region where the prepulse is focused. In Figure 7 (right), it is shown that for lower energies and deposition position 0.1 cm from the jet’s throat, few nanoseconds are necessary until the plasma density exceeds the critical value. Thus, in this case, the critical density can be overcome very easily in the first nanoseconds after the prepulse–plasma interaction, and the production of large density scale lengths can be avoided for the generation of monoenergetic accelerated ion beams.
On the contrary, if we deposit the energy very close to the jet’s throttle, there is the risk of never creating an overdense plasma, especially for high pulse energies, as shown in Figure 8. Indeed, at higher energies and deposition positions close to the throat of the jet, the density decreased very fast because it is possible to move below the critical density since the shock wave moves towards the descending side of the density’s ramp, thus resulting in undercritical density gradients even in the blast wave’s walls (Figure 8 (right)). In this case, the main pulse should be applied right after the prepulse. For example, in case the energy deposition position is very close to the throat, e.g., at 0.02 cm away from it, the 100 mJ prepulse reached the peak of the initial density ramp and the peak density on the wall of the blast wave started to descend intensively. At the same time, the blast waves produced by lower laser energies move slower, are still in the region where they steadily absorb mass from the front of the shock and remain at the same high densities above the critical value.
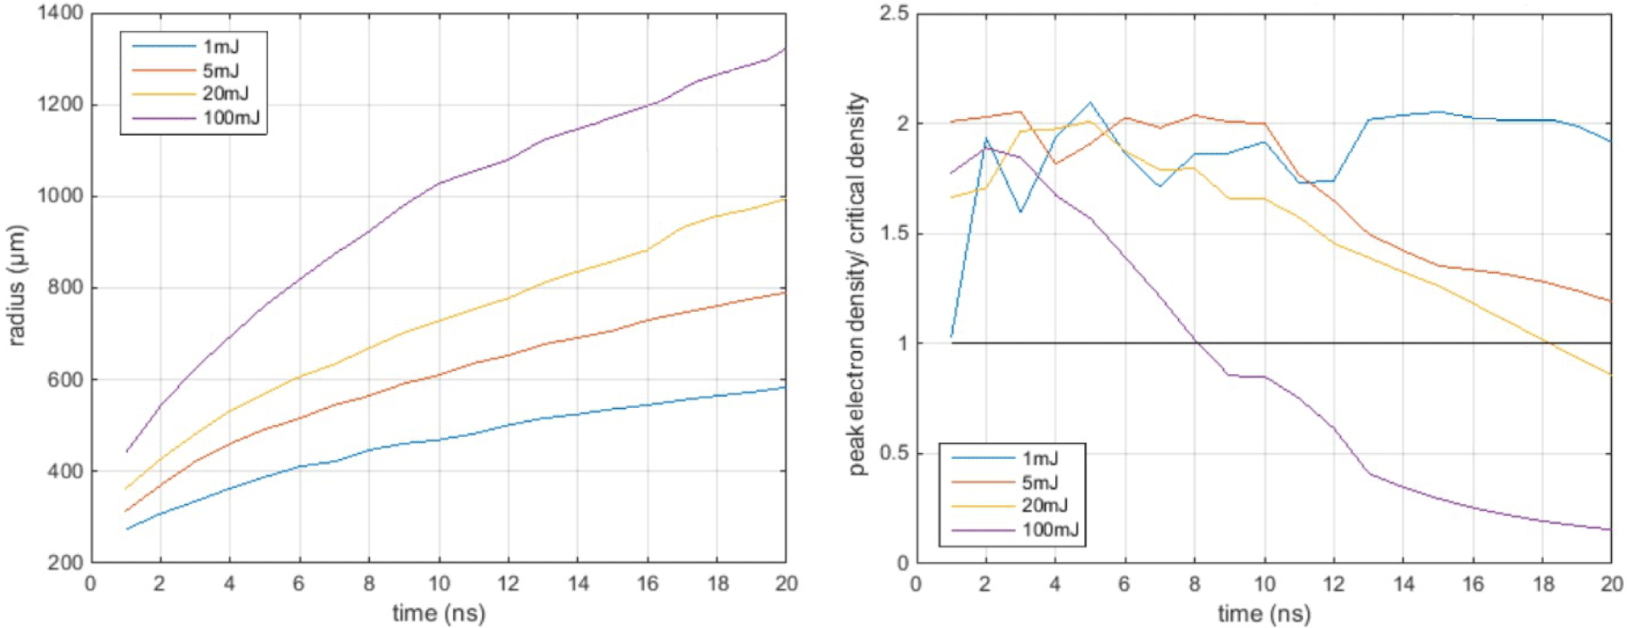
Figure 8. The blast wave radii (left) and the corresponding ratio of the peak electron density to the critical density (right). Time evolution up to 20 ns for 1, 5, 20 and 100 mJ absorbed energy deposited at 0.02 cm prior to the centre of the throat. Initial density was set to  $n=3.39\times 10^{18}~\text{cm}^{-3}$.
The main conclusion from the above results is that for lower, medium and high laser pulse energies, the target is overcritical. Hence, there is no necessity to apply the main pulse at later times having to deal with unnecessary long density scale lengths. Hydrogen would be a good choice for these experiments. In earlier works where helium was used[Reference Willingale, Mangles, Nilson, Clarke, Dangor, Kaluza and Schreiber10], it was found to be harder to produce overcritical plasma at such early time after the prepulse interaction with the gas.
It is of great importance that the scale length values, for the three energies, are relatively low and permit the production of monoenergetic ion beams since scale lengths lower than  $40~\unicode[STIX]{x03BC}\text{m}$ have been shown to be favourable for the acceleration of quasimonoenergetic ion beams[Reference Tresca, Dover, Cook, Maharjan, Polyanskiy, Najmudin and Pogorelsky17, Reference Palmer, Dover, Pogorelsky, Streeter and Najmudin23]. This scale length $L$, which defines the shock thickness, is calculated from the FLASH simulations by the fitting of an exponential of the form $n=n_{0}e^{-x/L}$ to the density gradient at the target front surface. For this laser system with $10.6~\unicode[STIX]{x03BC}\text{m}$ wavelength and a hydrogen gas target, the density increases to exceed the plasma critical density before the blast wave scale length $L$ exceeds the value of $20~\unicode[STIX]{x03BC}\text{m}$, thus providing conditions favourable for the acceleration of quasimonoenergetic ion beams. In Figure 9, the evolution of the scale length versus time (left) and blast wave radii (right) for density $n=4.42\times 10^{18}~\text{cm}^{-3}$ and 5, 20 and 100 mJ absorbed energies are presented, starting from 1 ns after the start of the simulation, where the blast wave has reached the self-similar stage, together with a polynomial fit to the simulation output. As can be seen in Figure 9 (right), the self-similarity of the blast wave expansion results in the scale length being determined by the blast wave radius, independent of the absorbed energy and expansion time.
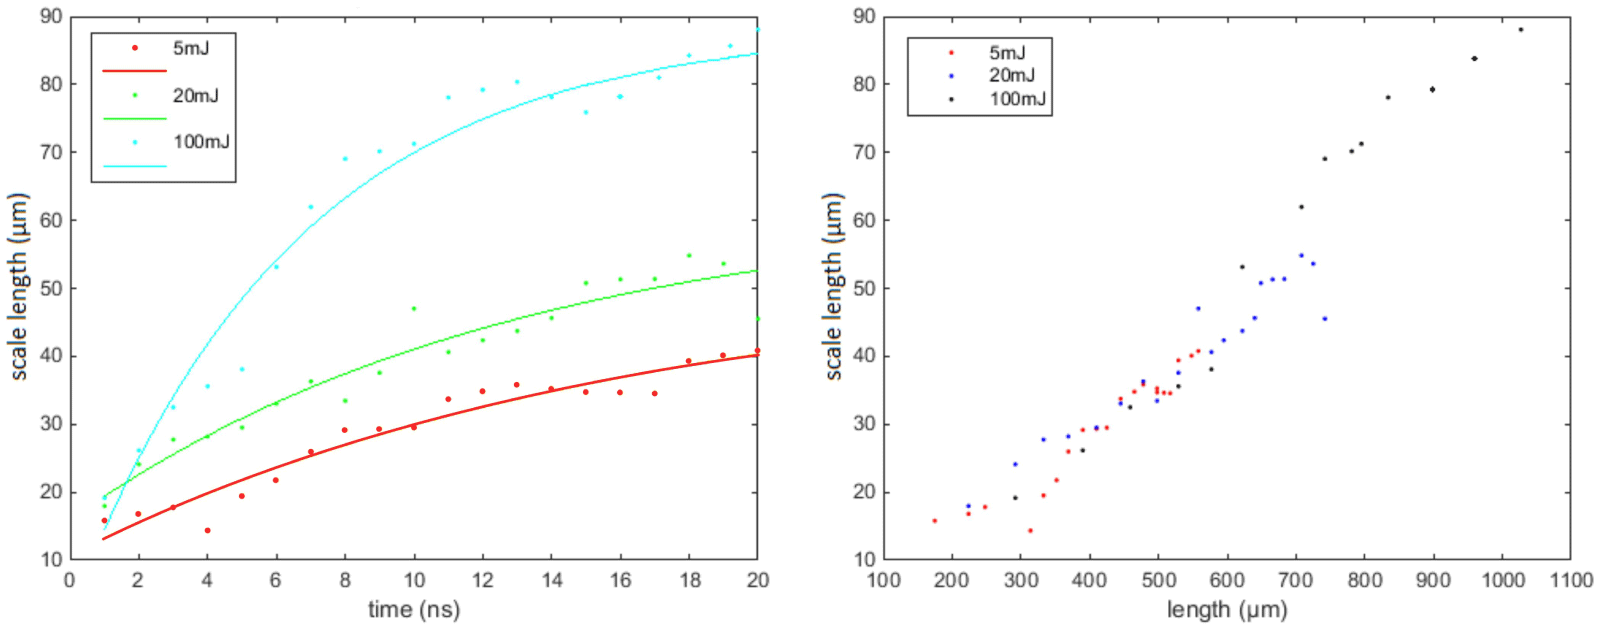
Figure 9. The density scale lengths versus time (left) and blast wave radii length (right), for density of  $n=4.42\times 10^{18}~\text{cm}^{-3}$ and absorbed energies of 5, 20 and 100 mJ.
5.2 Vulcan laser
The simulation results for targets suitable for experiments using the Vulcan laser at Rutherford Appleton Laboratory are presented here. The FLASH code is set again to output data files at every nanosecond simulated, the wavelength to  $\unicode[STIX]{x1D706}=1053~\text{nm}$, and the beam waist to $w_{0}=5~\unicode[STIX]{x03BC}\text{m}$ resulting in a Rayleigh length of $74.6~\unicode[STIX]{x03BC}\text{m}$ and a critical density $n_{c}=1.01\times 10^{21}~\text{cm}^{-3}$.
A maximum initial electron density of  $n=4.52\times 10^{20}~\text{cm}^{-3}$ (corresponding to 0.45 of $n_{c}$) is used in the simulations, equivalent to a standard gas jet with a backing pressure of ${\sim}180$ bar. In Figure 10, the simulated evolution of the radii of the blast waves is presented for six absorbed energies from 5 mJ to 1 J.
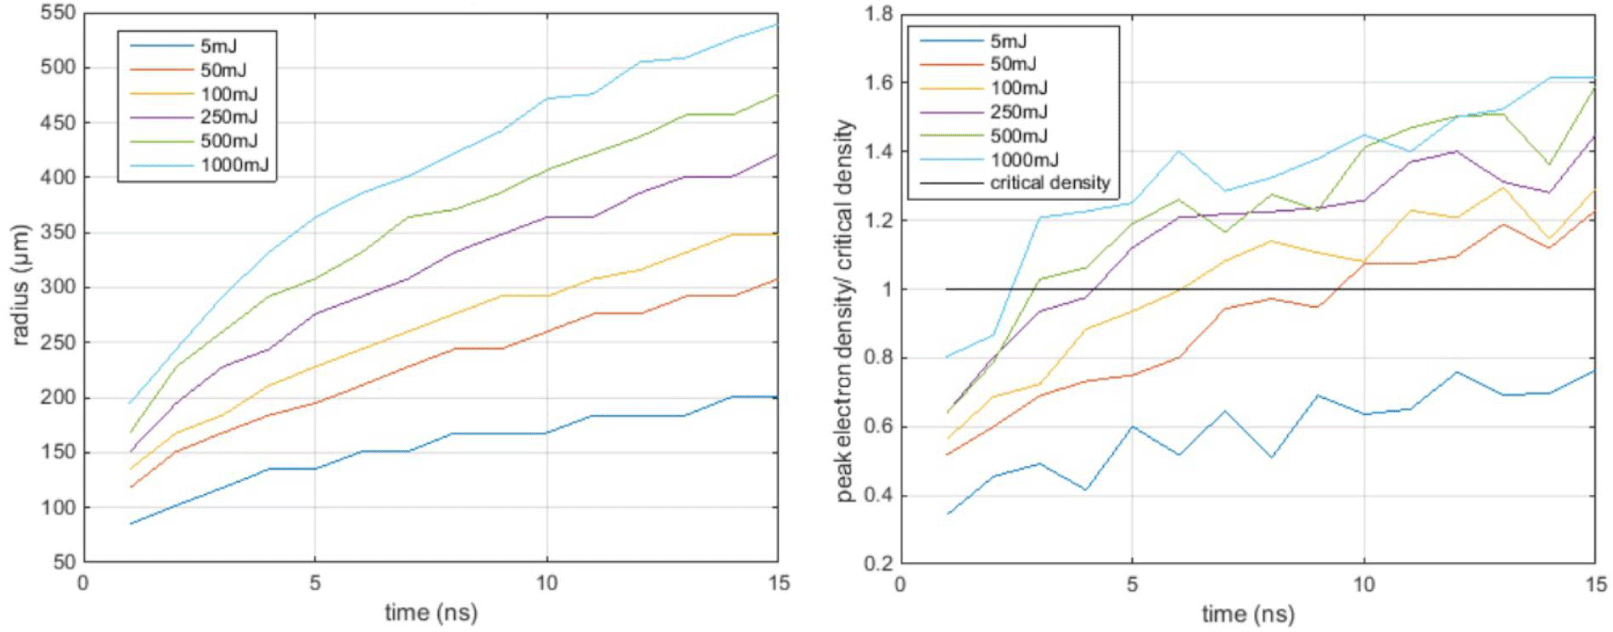
Figure 10. The blast wave radii (left) and the corresponding ratio of peak electron density to the critical density (right). Time evolution up to 15 ns for 5, 50, 100, 250, 500 and 1000 mJ absorbed energies, deposited at 0.05 cm prior to the centre of the throat. Initial density was set to  $n=4.52\times 10^{20}~\text{cm}^{-3}$.
The time evolution for the ratio of the peak electron density to the critical density in the shock is presented in Figure 10 (right). Comparing the obtained results from both laser systems, it is important to note that it is harder to achieve critical density using the 1053 nm wavelength Vulcan laser. The critical density increases to  $10^{21}~\text{cm}^{-3}$ meaning that a very high initial density must be used, leading to a requirement for extremely high backing pressures for the gas jet. Even for this initial density, the density of the shock exceeds the critical density only after many nanoseconds. Only for high absorbed energy values, such as 250 mJ, 500 mJ and 1 J, could the density exceed critical density within 5 ns.
Following the same concept of the results visualization used for the BNL case in Figure 9, the scale lengths versus time for the Vulcan laser system are depicted in Figure 11. It is observed that the scale lengths of the density of the blast wave are lower than  $40~\unicode[STIX]{x03BC}\text{m}$. Although the scale length requirements for quasimonoenergetic ion acceleration with a lower wavelength, $1~\unicode[STIX]{x03BC}\text{m}$, have still not been identified experimentally, it is likely that, similarly to longer wavelengths, short scale lengths will be required.
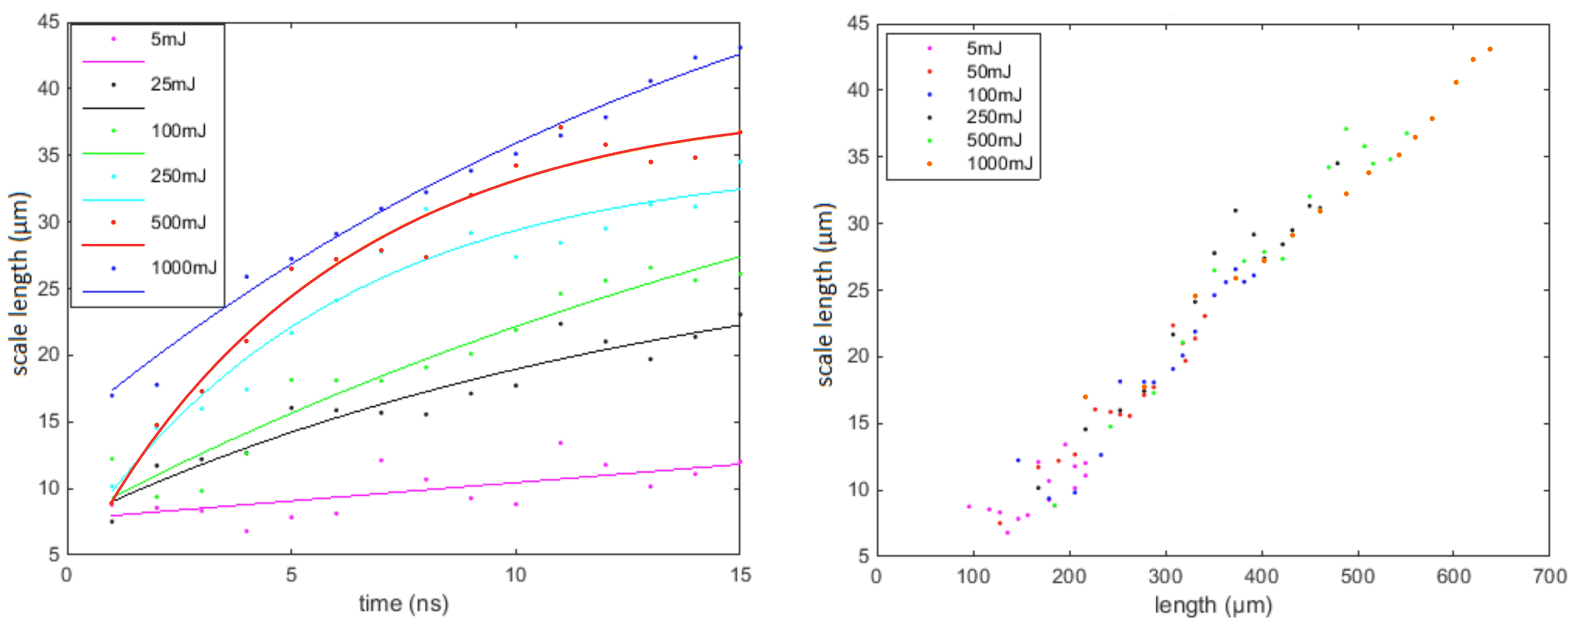
Figure 11. The density scale lengths versus time (left) and blast wave radii length (right), for density of  $n=4.52\times 10^{21}~\text{cm}^{-3}$ and absorbed energies of 5, 50, 100, 250, 500 and 1000 mJ.
6 Conclusions
The use of a lower energy prepulse to create a blast wave in the gas jet, thus shaping the target, has been proposed in the literature. Following the prepulse, the higher energy main pulse finds a sharpened density gradient that facilitates ion acceleration[Reference Dover, Cook, Tresca, Ettlinger, Maharjan, Polyanskiy and Najmudin14, Reference Palmer, Dover, Pogorelsky, Babzien, Dudnikova, Ispiriyan and Najmudin15, Reference Tresca, Dover, Cook, Maharjan, Polyanskiy, Najmudin and Pogorelsky17]. It is thought that the sharper the density gradient the more monochromatic the accelerated ion beam. The aim of this study was to examine whether the time windows within overcritical plasma densities can be achieved, thus favouring collisionless shock acceleration of ions.
The critical plasma density is highly dependent on the laser wavelength. We chose to investigate these two particular laser systems, BNL  $\text{CO}_{2}\sim 10~\unicode[STIX]{x03BC}\text{m}$ and Vulcan ${\sim}1~\unicode[STIX]{x03BC}\text{m}$ with wavelengths that differ one order of magnitude, to emphasize the difficulty to reach critical density when using laser of smaller $\unicode[STIX]{x1D706}$. Comparing the obtained simulation results from the two laser systems, for the case of the $10.3~\unicode[STIX]{x03BC}\text{m}~\text{CO}_{2}$ laser, overcritical densities may be achieved even for absorbed energies as low as 1 mJ. In all the simulations involving hydrogen, even when 4 bar of backing pressure was used, the critical density can be reached within the first nanosecond. In addition, it was observed that using high energy pulses focused close to the centre of the jet, it is possible to move below the critical density since the shock wave moves towards the descending side of the density’s ramp. For near $\unicode[STIX]{x03BC}\text{m}$ laser drivers, such as the Vulcan laser, it is observed that it is harder to achieve the critical density for the 1053 nm wavelength. At this wavelength, the critical density of $10^{21}~\text{cm}^{-3}$, corresponding to backing pressure of 180 bar, must be used. Even for this initial density, only the density gradients of the shock overcome the critical one after many nanoseconds. Only high value absorbed energies can overcome this limit in less than 5 ns.
The analysis of the variables of interest indicates that, depending on the energy absorbed and the deposition position, gas targets can be shaped suitably and thus an identical temporal window may be determined for the acceleration considering both the necessary overdense state of plasma and the required short scale lengths for monoenergetic ion beams. The new simulation results offer valuable data for the optimization of future experiments since new conditions including scanning of the initial density and energy deposited for two different wavelength regimes have been explored here. This will help future experiments determine the plasma heating requirements for generating density profiles favourable for quasimonoenergetic ion beam generation.
Acknowledgements
The software used in this work was in part developed by the DOE NNSA-ASC OASCR Flash Center at the University of Chicago. IPPL authors acknowledge support of this work by the project ‘ELI - LASERLAB Europe Synergy, HiPER & IPERION-CH.gr’ (MIS 5002735) which is implemented under the Action ‘Reinforcement of the Research and Innovation Infrastructure’, funded by the Operational Programme ‘Competitiveness, Entrepreneurship and Innovation’ (NSRF 2014-2020) and co-financed by Greece and the European Union (European Regional Development Fund).


 Open access