


1 Introduction
Spectral phase interferometry for direct electric-field reconstruction (SPIDER)[Reference Iaconis and Walmsley1, Reference Iaconis and Walmsley2] is one of the major methods to measure and retrieve the electric-field information of ultrashort laser pulses. Compared to another major method, frequency-resolved optical gating (FROG)[Reference Kane and Trebino3], which iteratively reconstructs light field from the measured two-dimensional spectrograms, SPIDER allows one to retrieve directly the spectral phase from one-dimensional spectrograms and thus supports real-time display in much higher frame rate. Recently, in order to improve the ability of SPIDER to measure the laser pulses with complex fields, considerable attention has been paid to broaden measured spectral range and to improve the spectral resolution. In original version of SPIDER, two ultrashort test pulse replicas are obtained by a Michelson interferometer (MI) which introduces dispersions and affects its application for ultra-broadband pulses. A method called zero-additional phase (ZAP) SPIDER[Reference Baum, Lochbrunner and Riedle4], which uses one fundamental (FH) test pulse instead of two FH test pulse replicas, can avoid dispersive distortion by the unbalanced pulse replicator, and broaden the measuring spectral range of SPIDER to hundreds of nanometers.
Promoting the spectral resolution is much more challenging for SPIDER that bases shear spectral interferometry. One of the causes is that spectral interferometry encodes the differential spectral phase into the interval of interferential fringes, so SPIDER should operate at a high spectral sampling rate typically 5–10 times of the Nyquist limit[Reference Kosik, Radunsky, Walmsley and Dorrer5]. Wavelet transform has been suggested as a substitute of Fourier transform for phase retrieval[Reference Bethge, Grebing and Steinmeyer6], and proven to increase the detection window and thus the minimum of the required sampling rate by 20%. However, wavelet transform has lower computational efficiency compared to Fourier transform. Moreover, this method is also based on the traditional measurement and limited by the case mentioned above. To realize 100% sampling of differential spectral phase, another dimension is required to resolve the interferential fringes. It can be either space (e.g., SEA-SPIDER[Reference Kosik, Radunsky, Walmsley and Dorrer5, Reference Wyatt, Walmsley, Stibenz and Steinmeyer7]) or time (2D-SI SPIDER[Reference Birge, Ell and Kärtner8, Reference Birge and Kärtner9]), however, needs inevitably more complex structures and expensive devices, e.g., imaging spectrograph for SEA-SPIDER, motor-controlled element for 2D-SI SPIDER. Moreover, the recorded 2D data means much longer time required to process than the usual 1D data.
A more important factor that affects the reconstructed resolution is to promote the measured signal-to-noise ratio (SNR). From SPIDER measurement, what we get directly from the interferogram is the differential phase. The spectral phase is recovered by concatenating the differential phase with a spectral interval of $\unicode[STIX]{x1D6FA}$
, the spectral shear, which usually plays a very important role in the sampling interval or spectral resolution of SPIDER. The choice of
$\unicode[STIX]{x1D6FA}$
, the spectral shear, which usually plays a very important role in the sampling interval or spectral resolution of SPIDER. The choice of $\unicode[STIX]{x1D6FA}$
depends strongly on the measured SNR. If
$\unicode[STIX]{x1D6FA}$
depends strongly on the measured SNR. If $\unicode[STIX]{x1D6FA}$
is chosen too small, the differential phase becomes unmeasurably small due to the detection noise[Reference Stibenz and Steinmeyera10]. Moreover, this noise is also accumulated in the course of the phase concatenations. Small
$\unicode[STIX]{x1D6FA}$
is chosen too small, the differential phase becomes unmeasurably small due to the detection noise[Reference Stibenz and Steinmeyera10]. Moreover, this noise is also accumulated in the course of the phase concatenations. Small $\unicode[STIX]{x1D6FA}$
leads to large concatenation number, and at the wavelengths far away from the central wavelength, the recovered phase noise becomes very large[Reference Austin, Witting and Walmsley11]. For the finite SNR, SPIDERs usually work at relative shear
$\unicode[STIX]{x1D6FA}$
leads to large concatenation number, and at the wavelengths far away from the central wavelength, the recovered phase noise becomes very large[Reference Austin, Witting and Walmsley11]. For the finite SNR, SPIDERs usually work at relative shear $\unicode[STIX]{x1D6FA}/\unicode[STIX]{x0394}\unicode[STIX]{x1D714}=4.6\%{-}20\%$
[Reference Iaconis and Walmsley1, Reference Iaconis and Walmsley2, Reference Bethge, Grebing and Steinmeyer6–Reference Birge, Ell and Kärtner8, Reference Stibenz and Steinmeyera10], where
$\unicode[STIX]{x1D6FA}/\unicode[STIX]{x0394}\unicode[STIX]{x1D714}=4.6\%{-}20\%$
[Reference Iaconis and Walmsley1, Reference Iaconis and Walmsley2, Reference Bethge, Grebing and Steinmeyer6–Reference Birge, Ell and Kärtner8, Reference Stibenz and Steinmeyera10], where $\unicode[STIX]{x0394}\unicode[STIX]{x1D714}$
is the spectral bandwidth. A method called multiple-shearing spectral interferometry combines the phase information obtained with multi-shears[Reference Austin, Witting and Walmsley11]. However, this method is relatively complex which involves shear changing in the measurements. It also asks for relatively high consistency of the multi-shear data.
$\unicode[STIX]{x0394}\unicode[STIX]{x1D714}$
is the spectral bandwidth. A method called multiple-shearing spectral interferometry combines the phase information obtained with multi-shears[Reference Austin, Witting and Walmsley11]. However, this method is relatively complex which involves shear changing in the measurements. It also asks for relatively high consistency of the multi-shear data.
Previously, we have successfully combined two-step phase-shifting (TSPS) into SPIDER[Reference Zheng, Cai, Pan, Zeng, Li, Li, Zhu, Lin and Xu12], called T-SPIDER here, where two spectral interferograms with $\unicode[STIX]{x1D70B}$
phase-shifting are recorded to remove experimentally the effect of the dc portion occurring in traditional SPIDER method. T-SPIDER can effectively avoid the disturbances from the time delay (
$\unicode[STIX]{x1D70B}$
phase-shifting are recorded to remove experimentally the effect of the dc portion occurring in traditional SPIDER method. T-SPIDER can effectively avoid the disturbances from the time delay ( $\unicode[STIX]{x1D70F}$
) between the test pulse replicas and the temporal filtering in the traditional SPIDER method. What is more, the subtraction of one spectral interferogram from the other, to some extent, is equivalent to a balanced detection where the balanced output is the difference between the two signals recorded by two similar receivers, and thereby can cancel the intensity noise somewhat[Reference Saleh and Teich13]. However, that design is based on traditional configuration which limits its applying to ultra-broadband pulses. Furthermore, in this setup, TSPS measurement is not available for the reference interferogram without changing any elements.
$\unicode[STIX]{x1D70F}$
) between the test pulse replicas and the temporal filtering in the traditional SPIDER method. What is more, the subtraction of one spectral interferogram from the other, to some extent, is equivalent to a balanced detection where the balanced output is the difference between the two signals recorded by two similar receivers, and thereby can cancel the intensity noise somewhat[Reference Saleh and Teich13]. However, that design is based on traditional configuration which limits its applying to ultra-broadband pulses. Furthermore, in this setup, TSPS measurement is not available for the reference interferogram without changing any elements.
In this paper, we present a complete TSPS prism-based SPIDER, or CTP-SPIDER, which can implement TSPS in both reference spectra and test spectra. Here, complete TSPS acts as a balanced detection which can not only remove the effect of the dc term of the interferogram, but also reduce measurement noises. To improve the stability of the device and suppress the noise further, some prisms are used to replace some sensitive optical components, especially reflective optics. To improve its performance in ultra-broadband laser pulse, the SPIDER is designed based on ZAP geometry. Our experiments show our SPIDER can work at the spectral shear as low as 0.1 nm (0.2 THz), corresponding to 1.5% of the pulse bandwidth. Our SPIDER is suitable (but not limited) for laser pulses with ultra-broad bandwidth and fine spectral structure.

Figure 1. (a) SPIDER setup; (b) prism-based chirped-pulse-replicas generator (CG); (c) prism-based light path delayer (DL); (d) prism-based beam combiner (BC). BS1-BS3: beam splitters, $\unicode[STIX]{x1D706}/2$
: half-wave plate, OPM: off-axis parabolic mirror, SP: spectrograph, RP1 and RP2: right-angle prism pair, CR1-CR4: prism-mirrors corner reflectors, PMR1-PMR4: prism-mirrors reflectors, L: lens.
$\unicode[STIX]{x1D706}/2$
: half-wave plate, OPM: off-axis parabolic mirror, SP: spectrograph, RP1 and RP2: right-angle prism pair, CR1-CR4: prism-mirrors corner reflectors, PMR1-PMR4: prism-mirrors reflectors, L: lens.
2 Experimental setup
Figure 1(a) presents our CTP-SPIDER, where two sheared pulses are produced by sum-frequency (SF) generations of a test pulse with two chirped pulse replicas. In the setup, a broadband beam splitter (BS1) is used to split the input laser beam into two. The reflected, as the test pulse, passes through a delay line (DL) to synchronize temporally with the chirped pulse replicas. A chirped-pulse-replicas generator (CG) behind the BS1 works to chirp and split the transmitted beam and thereby generate two chirped pulse replicas. The test pulse together with the chirped replicas is focused by an off-axis parabolic mirror (OPM) into an SF generator, a 0.05-mm-thick $29.2^{\circ }$
-cut BBO crystal, to produce SF-pulse replicas with a spectral shear around 400 nm. The pulse replicas have very similar spectral profile to that of the test pulse. SP is a commercial fiber spectrograph modeled USB4000 by Ocean Optics Co. with sampling interval of 0.03 nm and resolution of 0.05 nm. A beam combiner (BC) including a DL and a beam splitter behind the BBO crystal is used to delay and combine the SF-pulse replicas, which are coupled to the spectrograph by a lens. In this setup, lots of prism-based optics components are used. As shown in Figure 1(b), the CG, includes a couple of oppositely placed prisms made of SF57 glass (RP1 and RP2), two prism corner reflectors (CR1 and CR2) and a prism beam splitter (BS2). RP1 and RP2 act as a compact pulse stretcher[Reference Zheng, Cai, Pan, Zeng, Li, Li, Zhu, Lin and Xu12, Reference Fan, Li, Xu, Zheng, Cai, Lu and Zeng14], which folds the light path inside the prisms to induce adjustable material dispersion to chirp the input pulse. According to our measurement, this prism pair can stretch the 35 fs pulse at 800 nm to a range from 2.5 ps to 12.5 ps easily by changing the malposed distance between the prism pair. CR1, CR2 and BS2 work together as a dispersion-balanced all-prism MI. Figure 1(c) shows that the compact DL also consists of four prisms, which operates similarly to our prism-based stretcher but without material dispersion in the beam path, to realize the temporal synchronization between the test pulse and the stretched pulse replicas. The BC, to combine the sheared SF-pulses with balanced dispersions, is prism-based too. Here, the balanced dispersions of two arms of the BC would not affect the measured interferograms which are determined by the difference of the spectral phases. For optimizing the stability of the system, all prisms are mounted directly on brawny metal posts instead of adjustable optical mounts.
$29.2^{\circ }$
-cut BBO crystal, to produce SF-pulse replicas with a spectral shear around 400 nm. The pulse replicas have very similar spectral profile to that of the test pulse. SP is a commercial fiber spectrograph modeled USB4000 by Ocean Optics Co. with sampling interval of 0.03 nm and resolution of 0.05 nm. A beam combiner (BC) including a DL and a beam splitter behind the BBO crystal is used to delay and combine the SF-pulse replicas, which are coupled to the spectrograph by a lens. In this setup, lots of prism-based optics components are used. As shown in Figure 1(b), the CG, includes a couple of oppositely placed prisms made of SF57 glass (RP1 and RP2), two prism corner reflectors (CR1 and CR2) and a prism beam splitter (BS2). RP1 and RP2 act as a compact pulse stretcher[Reference Zheng, Cai, Pan, Zeng, Li, Li, Zhu, Lin and Xu12, Reference Fan, Li, Xu, Zheng, Cai, Lu and Zeng14], which folds the light path inside the prisms to induce adjustable material dispersion to chirp the input pulse. According to our measurement, this prism pair can stretch the 35 fs pulse at 800 nm to a range from 2.5 ps to 12.5 ps easily by changing the malposed distance between the prism pair. CR1, CR2 and BS2 work together as a dispersion-balanced all-prism MI. Figure 1(c) shows that the compact DL also consists of four prisms, which operates similarly to our prism-based stretcher but without material dispersion in the beam path, to realize the temporal synchronization between the test pulse and the stretched pulse replicas. The BC, to combine the sheared SF-pulses with balanced dispersions, is prism-based too. Here, the balanced dispersions of two arms of the BC would not affect the measured interferograms which are determined by the difference of the spectral phases. For optimizing the stability of the system, all prisms are mounted directly on brawny metal posts instead of adjustable optical mounts.
3 Results and discussions
For a traditional SPIDER, the recorded spectral interferogram from two SF-pulses with spectral shear $\unicode[STIX]{x1D6FA}$
and time interval
$\unicode[STIX]{x1D6FA}$
and time interval $\unicode[STIX]{x1D70F}$
can be expressed by
$\unicode[STIX]{x1D70F}$
can be expressed by
 $$\begin{eqnarray}\displaystyle D(\unicode[STIX]{x1D714}) & = & \displaystyle |E(\unicode[STIX]{x1D714}-\unicode[STIX]{x1D6FA})|^{2}+|E(\unicode[STIX]{x1D714})|^{2}\nonumber\\ \displaystyle & & \displaystyle +\,2|E(\unicode[STIX]{x1D714}-\unicode[STIX]{x1D6FA})|\,|E(\unicode[STIX]{x1D714})|\cos [\unicode[STIX]{x1D70F}\unicode[STIX]{x1D714}+\unicode[STIX]{x1D703}(\unicode[STIX]{x1D714})],\end{eqnarray}$$
where $\unicode[STIX]{x1D714}$
is the angular frequency, while
$\unicode[STIX]{x1D714}$
is the angular frequency, while $\unicode[STIX]{x1D703}(\unicode[STIX]{x1D714})=\unicode[STIX]{x1D711}(\unicode[STIX]{x1D714})-\unicode[STIX]{x1D711}(\unicode[STIX]{x1D714}-\unicode[STIX]{x1D6FA})$
is the differential phase between two pulses. To extract
$\unicode[STIX]{x1D703}(\unicode[STIX]{x1D714})=\unicode[STIX]{x1D711}(\unicode[STIX]{x1D714})-\unicode[STIX]{x1D711}(\unicode[STIX]{x1D714}-\unicode[STIX]{x1D6FA})$
is the differential phase between two pulses. To extract $\unicode[STIX]{x1D703}(\unicode[STIX]{x1D714})$
, some Fourier transforms and temporal filtering are usually applied to
$\unicode[STIX]{x1D703}(\unicode[STIX]{x1D714})$
, some Fourier transforms and temporal filtering are usually applied to $D(\unicode[STIX]{x1D714})$
. Correspondingly, the temporal function
$D(\unicode[STIX]{x1D714})$
. Correspondingly, the temporal function $\tilde{D}(t)$
, the Fourier transform of
$\tilde{D}(t)$
, the Fourier transform of $D(\unicode[STIX]{x1D714})$
, includes three components. One is called dc portion from
$D(\unicode[STIX]{x1D714})$
, includes three components. One is called dc portion from $|E(\unicode[STIX]{x1D714}-\unicode[STIX]{x1D6FA})|^{2}+|E(\unicode[STIX]{x1D714})|^{2}$
centered at
$|E(\unicode[STIX]{x1D714}-\unicode[STIX]{x1D6FA})|^{2}+|E(\unicode[STIX]{x1D714})|^{2}$
centered at $t=0$
while the other two, ac components from
$t=0$
while the other two, ac components from $|E(\unicode[STIX]{x1D714}-\unicode[STIX]{x1D6FA})E(\unicode[STIX]{x1D714})|\cos [\unicode[STIX]{x1D70F}\unicode[STIX]{x1D714}+\unicode[STIX]{x1D703}(\unicode[STIX]{x1D714})]$
, are situated at
$|E(\unicode[STIX]{x1D714}-\unicode[STIX]{x1D6FA})E(\unicode[STIX]{x1D714})|\cos [\unicode[STIX]{x1D70F}\unicode[STIX]{x1D714}+\unicode[STIX]{x1D703}(\unicode[STIX]{x1D714})]$
, are situated at $t=\pm \unicode[STIX]{x1D70F}$
, respectively. In traditional SPIDER algorithms, proper
$t=\pm \unicode[STIX]{x1D70F}$
, respectively. In traditional SPIDER algorithms, proper $\unicode[STIX]{x1D70F}$
is required in order that all the three components separate well in time. For a test pulse with narrow bandwidth or with complex spectral structures, larger
$\unicode[STIX]{x1D70F}$
is required in order that all the three components separate well in time. For a test pulse with narrow bandwidth or with complex spectral structures, larger $\unicode[STIX]{x1D70F}$
should be required, which leads to higher noise level for less sampling points per fringe.
$\unicode[STIX]{x1D70F}$
should be required, which leads to higher noise level for less sampling points per fringe.
We have first applied the TSPS method to SPIDER in Ref. [Reference Zheng, Cai, Pan, Zeng, Li, Li, Zhu, Lin and Xu12] (T-SPIDER), where a quarter-wave plate (equivalent to a half-wave plate when the light passes twice) is set in one of the MI arms to induce $\unicode[STIX]{x1D70B}$
phase-shifting by aligning the polarization respectively along the fast axis or the slow axis of the wave plate at twice. When aligning the polarization along the fast axis, we record an interferogram as expressed by Equation (1), and then by rotating the wave plate by
$\unicode[STIX]{x1D70B}$
phase-shifting by aligning the polarization respectively along the fast axis or the slow axis of the wave plate at twice. When aligning the polarization along the fast axis, we record an interferogram as expressed by Equation (1), and then by rotating the wave plate by $90^{\circ }$
, we can record another interferogram with
$90^{\circ }$
, we can record another interferogram with $\unicode[STIX]{x1D70B}$
phase-shifting expressed by
$\unicode[STIX]{x1D70B}$
phase-shifting expressed by
 $$\begin{eqnarray}\displaystyle D^{\unicode[STIX]{x1D70B}}(\unicode[STIX]{x1D714}) & = & \displaystyle |E(\unicode[STIX]{x1D714}-\unicode[STIX]{x1D6FA})|^{2}+|E(\unicode[STIX]{x1D714})|^{2}+2|E(\unicode[STIX]{x1D714}-\unicode[STIX]{x1D6FA})|\,|E(\unicode[STIX]{x1D714})|\nonumber\\ \displaystyle & & \displaystyle \times \,\cos [\unicode[STIX]{x1D70F}\unicode[STIX]{x1D714}+\unicode[STIX]{x1D703}(\unicode[STIX]{x1D714})+\unicode[STIX]{x1D70B}+\unicode[STIX]{x1D6FC}],\end{eqnarray}$$
where $\unicode[STIX]{x1D6FC}$
expresses a small phase deviation from
$\unicode[STIX]{x1D6FC}$
expresses a small phase deviation from $\unicode[STIX]{x1D70B}$
due to the dispersion of the wave plate. Subtracting Equation (2) from (1), we can get TSPS interferogram without the dc term by
$\unicode[STIX]{x1D70B}$
due to the dispersion of the wave plate. Subtracting Equation (2) from (1), we can get TSPS interferogram without the dc term by
 $$\begin{eqnarray}\displaystyle D^{\text{TSPS}}(\unicode[STIX]{x1D714}) & = & \displaystyle 4\cos \frac{\unicode[STIX]{x1D6FC}}{2}|E(\unicode[STIX]{x1D714}-\unicode[STIX]{x1D6FA})||E(\unicode[STIX]{x1D714})|\nonumber\\ \displaystyle & & \displaystyle \times \,\cos \left[\unicode[STIX]{x1D70F}\unicode[STIX]{x1D714}+\unicode[STIX]{x1D703}(\unicode[STIX]{x1D714})+\frac{\unicode[STIX]{x1D6FC}}{2}\right].\end{eqnarray}$$
Equation (3) shows that, TSPS method still takes effect in eliminating the dc term even though the phase-shifting deviates from $\unicode[STIX]{x1D70B}$
. When the deviation
$\unicode[STIX]{x1D70B}$
. When the deviation $\unicode[STIX]{x1D6FC}\approx 0$
,
$\unicode[STIX]{x1D6FC}\approx 0$
, $\cos (\unicode[STIX]{x1D6FC}/2)\approx 1$
, the TSPS interferogram has the maximal amplitude, twice the ac portion that in Equation (2). This scheme can be realized conveniently by inducing a wave plate to a traditional SPIDER. However, when the test pulses have few-cycle duration or supercontinuum spectrum, optical dispersion and
$\cos (\unicode[STIX]{x1D6FC}/2)\approx 1$
, the TSPS interferogram has the maximal amplitude, twice the ac portion that in Equation (2). This scheme can be realized conveniently by inducing a wave plate to a traditional SPIDER. However, when the test pulses have few-cycle duration or supercontinuum spectrum, optical dispersion and $\unicode[STIX]{x1D714}$
-dependent residual phase (
$\unicode[STIX]{x1D714}$
-dependent residual phase ( $\unicode[STIX]{x1D6FC}=\unicode[STIX]{x1D6FC}(\unicode[STIX]{x1D714})$
) induced by the wave plate will be too strong to be ignored, which can degrade the recover results. In our scheme, CTP-SPIDER, as shown in Figure 1, we set a half-wave plate for
$\unicode[STIX]{x1D6FC}=\unicode[STIX]{x1D6FC}(\unicode[STIX]{x1D714})$
) induced by the wave plate will be too strong to be ignored, which can degrade the recover results. In our scheme, CTP-SPIDER, as shown in Figure 1, we set a half-wave plate for $\unicode[STIX]{x1D70B}$
phase-shift of one of the chirped pulse replicas. Because only very small part of the chirped spectral components (quasi-monochromatic slice) can interact with the test pulse, no broad bandwidth is required for the half-wave plate in spite that the test pulse has very wide bandwidth.
$\unicode[STIX]{x1D70B}$
phase-shift of one of the chirped pulse replicas. Because only very small part of the chirped spectral components (quasi-monochromatic slice) can interact with the test pulse, no broad bandwidth is required for the half-wave plate in spite that the test pulse has very wide bandwidth.
In SPIDER measurement, to recover $\unicode[STIX]{x1D711}(\unicode[STIX]{x1D714})$
correctly, it is very important to calibrate
$\unicode[STIX]{x1D711}(\unicode[STIX]{x1D714})$
correctly, it is very important to calibrate $\unicode[STIX]{x1D714}\unicode[STIX]{x1D70F}$
accurately, or else the residual of
$\unicode[STIX]{x1D714}\unicode[STIX]{x1D70F}$
accurately, or else the residual of $\unicode[STIX]{x1D714}\unicode[STIX]{x1D70F}$
added to
$\unicode[STIX]{x1D714}\unicode[STIX]{x1D70F}$
added to $\unicode[STIX]{x1D703}(\unicode[STIX]{x1D714})$
will accumulate to a nonnegligible level in the course of the phase concatenations[Reference Birge and Kärtner9]. A significant advantage of CTP-SPIDER is that we can conveniently apply TSPS to record the reference interferograms to calibrate the linear phase
$\unicode[STIX]{x1D703}(\unicode[STIX]{x1D714})$
will accumulate to a nonnegligible level in the course of the phase concatenations[Reference Birge and Kärtner9]. A significant advantage of CTP-SPIDER is that we can conveniently apply TSPS to record the reference interferograms to calibrate the linear phase $\unicode[STIX]{x1D714}\unicode[STIX]{x1D70F}$
more accurately, only by setting the time delay of CG to synchronize two chirped pulses (
$\unicode[STIX]{x1D714}\unicode[STIX]{x1D70F}$
more accurately, only by setting the time delay of CG to synchronize two chirped pulses ( $\unicode[STIX]{x1D6FA}=0$
) without changing any other optics in the setup. The corresponding spectral phase is
$\unicode[STIX]{x1D6FA}=0$
) without changing any other optics in the setup. The corresponding spectral phase is $\unicode[STIX]{x1D714}\unicode[STIX]{x1D70F}+\unicode[STIX]{x1D711}(\unicode[STIX]{x1D714})-\unicode[STIX]{x1D711}(\unicode[STIX]{x1D714}-0)=\unicode[STIX]{x1D714}\unicode[STIX]{x1D70F}$
. In the adjustment procedure, the delay
$\unicode[STIX]{x1D714}\unicode[STIX]{x1D70F}+\unicode[STIX]{x1D711}(\unicode[STIX]{x1D714})-\unicode[STIX]{x1D711}(\unicode[STIX]{x1D714}-0)=\unicode[STIX]{x1D714}\unicode[STIX]{x1D70F}$
. In the adjustment procedure, the delay $\unicode[STIX]{x1D70F}$
never changes, because the moments of two SF pulse replicas generated in the nonlinear crystal are not determined by the two chirped pulses but the test short pulse. For T-SPIDER based on traditional geometry, the parameters
$\unicode[STIX]{x1D70F}$
never changes, because the moments of two SF pulse replicas generated in the nonlinear crystal are not determined by the two chirped pulses but the test short pulse. For T-SPIDER based on traditional geometry, the parameters $\unicode[STIX]{x1D6FA}$
and
$\unicode[STIX]{x1D6FA}$
and $\unicode[STIX]{x1D70F}$
are not independent with each other, and the reference interferogram cannot be realized by setting
$\unicode[STIX]{x1D70F}$
are not independent with each other, and the reference interferogram cannot be realized by setting $\unicode[STIX]{x1D6FA}=0$
. A common calibration method is to record the interferogram between two self-frequency-doubling pulses of the test pulse replicas as mentioned in Ref. [Reference Iaconis and Walmsley1]. Can we realize TSPS by inducing
$\unicode[STIX]{x1D6FA}=0$
. A common calibration method is to record the interferogram between two self-frequency-doubling pulses of the test pulse replicas as mentioned in Ref. [Reference Iaconis and Walmsley1]. Can we realize TSPS by inducing $\unicode[STIX]{x1D70B}$
-phase-shifting to one of the FH test pulses? It cannot be done directly, because when the phase of the pulse changes
$\unicode[STIX]{x1D70B}$
-phase-shifting to one of the FH test pulses? It cannot be done directly, because when the phase of the pulse changes $\unicode[STIX]{x1D70B}$
, the phase of its frequency-doubling pulse will change
$\unicode[STIX]{x1D70B}$
, the phase of its frequency-doubling pulse will change $2\unicode[STIX]{x1D70B}$
. We may set a noncommercial eighth-wave plate instead of the quarter-wave plate to realize TSPS for the reference interferograms, however, which will change the dispersion of the SPIDER. Nevertheless, T-SPIDER is effective compared to traditional SPIDER[Reference Zheng, Cai, Pan, Zeng, Li, Li, Zhu, Lin and Xu12], because in the reference interferogram, the ac components are usually separated much better with the dc, thereby filtered out more easily than in the shear interferogram. Anyway, CTP-SPIDER can work better with TSPS than T-SPIDER.
$2\unicode[STIX]{x1D70B}$
. We may set a noncommercial eighth-wave plate instead of the quarter-wave plate to realize TSPS for the reference interferograms, however, which will change the dispersion of the SPIDER. Nevertheless, T-SPIDER is effective compared to traditional SPIDER[Reference Zheng, Cai, Pan, Zeng, Li, Li, Zhu, Lin and Xu12], because in the reference interferogram, the ac components are usually separated much better with the dc, thereby filtered out more easily than in the shear interferogram. Anyway, CTP-SPIDER can work better with TSPS than T-SPIDER.
For its complete TSPS capacity, we can easily extract the ac term of the spectral data of CTP-SPIDER by choosing the data in the positive (or negative) axis of $\tilde{D}^{\text{TSPS}}(t)$
, the Fourier transform of
$\tilde{D}^{\text{TSPS}}(t)$
, the Fourier transform of $D^{\text{TSPS}}(\unicode[STIX]{x1D714})$
, without the need of an appropriately selective filtering window required in traditional SPIDER algorithms. Although T-SPIDER does not need window-filtering to the sheared spectra, it should be also applied to the reference spectrum. Figure 2(a) shows the reconstructed spectral phases by CTP-SPIDER (black line) and T-SPIDER using different filtering windows with widths
$D^{\text{TSPS}}(\unicode[STIX]{x1D714})$
, without the need of an appropriately selective filtering window required in traditional SPIDER algorithms. Although T-SPIDER does not need window-filtering to the sheared spectra, it should be also applied to the reference spectrum. Figure 2(a) shows the reconstructed spectral phases by CTP-SPIDER (black line) and T-SPIDER using different filtering windows with widths $t_{\text{win}}=0.5$
, 0.7 and 0.9 ps (red, blue and green lines) for the reference spectrum, for
$t_{\text{win}}=0.5$
, 0.7 and 0.9 ps (red, blue and green lines) for the reference spectrum, for $\unicode[STIX]{x1D6FA}=0.5$
nm (0.95 THz) and
$\unicode[STIX]{x1D6FA}=0.5$
nm (0.95 THz) and $\unicode[STIX]{x1D70F}=0.47$
ps. Figure 2(b) is the corresponding temporal shapes and phases. The pulse width is 72 fs. The spectral phases reconstructed by T-SPIDER at
$\unicode[STIX]{x1D70F}=0.47$
ps. Figure 2(b) is the corresponding temporal shapes and phases. The pulse width is 72 fs. The spectral phases reconstructed by T-SPIDER at $t_{\text{win}}=0.5$
ps and 0.7 ps agree well with that by CTP-SPIDER. However, when the filtering width increases to 0.9 ps, approximately to twice of
$t_{\text{win}}=0.5$
ps and 0.7 ps agree well with that by CTP-SPIDER. However, when the filtering width increases to 0.9 ps, approximately to twice of $\unicode[STIX]{x1D70F}$
, an obvious modulation appears in the recovered spectral phase (green line in Figure 2(a)) and its value has great deviation away from the spectrum width range. The corresponding temporal characters also deviate with others. This means that, T-SPIDER is also restricted by the filtering width although its choice is looser than traditional SPIDER.
$\unicode[STIX]{x1D70F}$
, an obvious modulation appears in the recovered spectral phase (green line in Figure 2(a)) and its value has great deviation away from the spectrum width range. The corresponding temporal characters also deviate with others. This means that, T-SPIDER is also restricted by the filtering width although its choice is looser than traditional SPIDER.

Figure 2. (a) The reconstructed spectral phases by CTP-SPIDER (black line) and T-SPIDER using different filtering windows with width twin of 0.5, 0.7 and 0.9 ps (red, blue and green lines) for the reference spectrum. (b) The temporal shapes and phases corresponding to (a).
When we decrease the delay $\unicode[STIX]{x1D70F}$
between the pulse replicas, the interval of the spectral fringes
$\unicode[STIX]{x1D70F}$
between the pulse replicas, the interval of the spectral fringes $1/\unicode[STIX]{x1D70F}$
becomes wider, and the sampling number per fringe increases, which can suppress the effects of uncorrelated noises inversely proportional to the square root of the sampling point number[Reference Zheng, Cai, Pan, Zeng, Li, Li, Zhu, Lin and Xu12], or reduce the requirement for the resolution of the spectrograph. As mentioned above, CTP-SPIDER can apply TSPS in both test spectra and the reference spectra, relaxing greatly the limitation of
$1/\unicode[STIX]{x1D70F}$
becomes wider, and the sampling number per fringe increases, which can suppress the effects of uncorrelated noises inversely proportional to the square root of the sampling point number[Reference Zheng, Cai, Pan, Zeng, Li, Li, Zhu, Lin and Xu12], or reduce the requirement for the resolution of the spectrograph. As mentioned above, CTP-SPIDER can apply TSPS in both test spectra and the reference spectra, relaxing greatly the limitation of $\unicode[STIX]{x1D70F}$
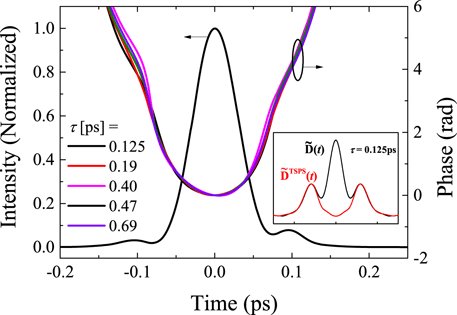
. Figure 3 shows the recovered temporal intensity and phases for different pulse delays
$\unicode[STIX]{x1D70F}$
. Figure 3 shows the recovered temporal intensity and phases for different pulse delays $\unicode[STIX]{x1D70F}=0.125$
, 0.19, 0.40, 0.47 and 0.69 ps by our CTP-SPIDER. The corresponding shear
$\unicode[STIX]{x1D70F}=0.125$
, 0.19, 0.40, 0.47 and 0.69 ps by our CTP-SPIDER. The corresponding shear $\unicode[STIX]{x1D6FA}=0.5$
nm (0.95 THz) and the measured pulse width is 67 fs. It shows that even when
$\unicode[STIX]{x1D6FA}=0.5$
nm (0.95 THz) and the measured pulse width is 67 fs. It shows that even when $\unicode[STIX]{x1D70F}=0.125$
ps, the recovered result also agrees with others at larger delays. The inset of Figure 3 shows the amplitudes of
$\unicode[STIX]{x1D70F}=0.125$
ps, the recovered result also agrees with others at larger delays. The inset of Figure 3 shows the amplitudes of $\tilde{D}(t)$
(black line) and
$\tilde{D}(t)$
(black line) and $\tilde{D}^{\text{TSPS}}(t)$
(red line) for
$\tilde{D}^{\text{TSPS}}(t)$
(red line) for $\unicode[STIX]{x1D70F}=0.125$
ps. In the black line in the inset, the dc terms centered at 0 ps overlap greatly with the ac terms centered at
$\unicode[STIX]{x1D70F}=0.125$
ps. In the black line in the inset, the dc terms centered at 0 ps overlap greatly with the ac terms centered at $\pm 0.125$
ps, from which the differential phase is unable to be extracted by both traditional and T-SPIDER. As shown by the red line, we can realize ac terms separation at the absence of the dc by applying TSPS technology, and CTP-SPIDER operates well. T-SPIDER, which is subjected to the overlap between the dc and ac terms for its non-TSPS reference interferogram, also cannot deal with such situation. Moreover, for non-ZAP SPIDER, small
$\pm 0.125$
ps, from which the differential phase is unable to be extracted by both traditional and T-SPIDER. As shown by the red line, we can realize ac terms separation at the absence of the dc by applying TSPS technology, and CTP-SPIDER operates well. T-SPIDER, which is subjected to the overlap between the dc and ac terms for its non-TSPS reference interferogram, also cannot deal with such situation. Moreover, for non-ZAP SPIDER, small $\unicode[STIX]{x1D70F}$
will lead to small shear
$\unicode[STIX]{x1D70F}$
will lead to small shear $\unicode[STIX]{x1D6FA}$
, which means that T-SPIDER is not suitable for operating with too small
$\unicode[STIX]{x1D6FA}$
, which means that T-SPIDER is not suitable for operating with too small $\unicode[STIX]{x1D70F}$
.
$\unicode[STIX]{x1D70F}$
.

Figure 3. Recovered temporal intensity and phases for different pulse delays from 0.125 to 0.69 ps. The corresponding shear $\unicode[STIX]{x1D6FA}=0.5$
nm (0.95 THz). Inset: amplitudes of
$\unicode[STIX]{x1D6FA}=0.5$
nm (0.95 THz). Inset: amplitudes of $\tilde{D}(t)$
and
$\tilde{D}(t)$
and $\tilde{D}^{\text{TSPS}}(t)$
for
$\tilde{D}^{\text{TSPS}}(t)$
for $\unicode[STIX]{x1D70F}=0.125$
ps.
$\unicode[STIX]{x1D70F}=0.125$
ps.
As we mentioned, a SPIDER should retain its sampling number no less than five times of the Nyquist limit, to guarantee the accuracy of phase reconstruction. When we use SPIDER to measure laser pulses complex spectral phase modulation, the resolution of the spectrograph becomes critical. CTP-SPIDER allows the device to operate in much lower $\unicode[STIX]{x1D70F}$
to increase the width of the fringe, which reduces the requirement for fine resolution of the spectrograph. We rotate the grating in the compressor of the Ti:sapphire laser amplifier to induce a moderate third-order modulation to the spectral phase, which is measured by CTP-SPIDER for
$\unicode[STIX]{x1D70F}$
to increase the width of the fringe, which reduces the requirement for fine resolution of the spectrograph. We rotate the grating in the compressor of the Ti:sapphire laser amplifier to induce a moderate third-order modulation to the spectral phase, which is measured by CTP-SPIDER for $\unicode[STIX]{x1D70F}=1$
and 0.3 ps by using a spectrograph with sampling rate of 0.03 nm, as shown by the black lines in Figures 4(a) and 4(b), respectively. To estimate the complexity of the phase, we change the width of filtering window in Fourier domain, and find that
$\unicode[STIX]{x1D70F}=1$
and 0.3 ps by using a spectrograph with sampling rate of 0.03 nm, as shown by the black lines in Figures 4(a) and 4(b), respectively. To estimate the complexity of the phase, we change the width of filtering window in Fourier domain, and find that $t_{\text{win}}$
should be no less than 0.3 ps, from which the modulation fineness
$t_{\text{win}}$
should be no less than 0.3 ps, from which the modulation fineness $\unicode[STIX]{x0394}\unicode[STIX]{x1D706}_{M}$
of the differential phase
$\unicode[STIX]{x0394}\unicode[STIX]{x1D706}_{M}$
of the differential phase $\unicode[STIX]{x1D703}(\unicode[STIX]{x1D714})$
can be estimated as
$\unicode[STIX]{x1D703}(\unicode[STIX]{x1D714})$
can be estimated as ${\sim}3$
THz (1.6 nm around 400 nm wavelength). We numerically resample the measured interferogram with different resolutions, and the reconstructed phases are shown by the colored lines in Figures 4(a) and 4(b) for
${\sim}3$
THz (1.6 nm around 400 nm wavelength). We numerically resample the measured interferogram with different resolutions, and the reconstructed phases are shown by the colored lines in Figures 4(a) and 4(b) for $\unicode[STIX]{x1D70F}=1$
and 0.3 ps. For
$\unicode[STIX]{x1D70F}=1$
and 0.3 ps. For $\unicode[STIX]{x1D70F}=1$
ps, the phase curve agrees well with the original one (black line) when sampling rate
$\unicode[STIX]{x1D70F}=1$
ps, the phase curve agrees well with the original one (black line) when sampling rate $\unicode[STIX]{x0394}\unicode[STIX]{x1D706}_{s}=0.1$
nm (0.19 THz), and deviates slightly when
$\unicode[STIX]{x0394}\unicode[STIX]{x1D706}_{s}=0.1$
nm (0.19 THz), and deviates slightly when $\unicode[STIX]{x0394}\unicode[STIX]{x1D706}_{s}=0.2$
nm (0.38 THz). When
$\unicode[STIX]{x0394}\unicode[STIX]{x1D706}_{s}=0.2$
nm (0.38 THz). When $\unicode[STIX]{x0394}\unicode[STIX]{x1D706}_{s}=0.3$
nm (0.57 THz) the phase curve gives a complete wrong result. This is to say, to measure such laser pulses correctly, the resolution of the employed spectrograph should be no larger than 0.2 nm, corresponding to
$\unicode[STIX]{x0394}\unicode[STIX]{x1D706}_{s}=0.3$
nm (0.57 THz) the phase curve gives a complete wrong result. This is to say, to measure such laser pulses correctly, the resolution of the employed spectrograph should be no larger than 0.2 nm, corresponding to $1/8$
of the modulation fineness
$1/8$
of the modulation fineness $\unicode[STIX]{x0394}\unicode[STIX]{x1D706}_{M}$
. For
$\unicode[STIX]{x0394}\unicode[STIX]{x1D706}_{M}$
. For $\unicode[STIX]{x1D70F}=0.3$
ps, the maximal available sampling rate will increase to 0.6 nm (1.14 THz) as shown in Figure 4(b), corresponding to
$\unicode[STIX]{x1D70F}=0.3$
ps, the maximal available sampling rate will increase to 0.6 nm (1.14 THz) as shown in Figure 4(b), corresponding to $1/2.7$
of
$1/2.7$
of $\unicode[STIX]{x0394}\unicode[STIX]{x1D706}_{M}$
.
$\unicode[STIX]{x0394}\unicode[STIX]{x1D706}_{M}$
.

Figure 4. Restore spectral phases by using different sampling resolutions of the interferograms for (a) $\unicode[STIX]{x1D70F}=1$
ps and (b) 0.3 ps when
$\unicode[STIX]{x1D70F}=1$
ps and (b) 0.3 ps when $\unicode[STIX]{x1D6FA}=0.5$
nm (0.95 THz).
$\unicode[STIX]{x1D6FA}=0.5$
nm (0.95 THz).
We usually use a cover over the SPIDER to avoid the perturbation by the airflow. Here, to check the improvement of the SNR, we measure laser pulses by T-SPIDER and CTP-SPIDER without the cover at shear $\unicode[STIX]{x1D6FA}=0.5$
nm (0.95 THz) and delay
$\unicode[STIX]{x1D6FA}=0.5$
nm (0.95 THz) and delay $\unicode[STIX]{x1D70F}=1$
ps, and the recovered phase error is shown by the blue (T-SPIDER) and red lines (CTP-SPIDER) in Figure 5, respectively. By T-SPIDER, as shown by the blue line, the error is retained at a level of 0.1 rad within 23-THz-bandwidth range (
$\unicode[STIX]{x1D70F}=1$
ps, and the recovered phase error is shown by the blue (T-SPIDER) and red lines (CTP-SPIDER) in Figure 5, respectively. By T-SPIDER, as shown by the blue line, the error is retained at a level of 0.1 rad within 23-THz-bandwidth range ( $365{-}388$
THz), where the corresponding spectral intensity is higher than 10% of its peak. For CTP-SPIDER, this range can extend to 31 THz (
$365{-}388$
THz), where the corresponding spectral intensity is higher than 10% of its peak. For CTP-SPIDER, this range can extend to 31 THz ( $362{-}393$
THz), even at the frequencies where the intensity is lower than 1% of the peak. This means CTP-SPIDER has much better capability to extract the spectral phase from weak spectral domain at the two wings of the pulse. To compare the phase retrieval around the center of the pulse, we calculate the weighted average values
$362{-}393$
THz), even at the frequencies where the intensity is lower than 1% of the peak. This means CTP-SPIDER has much better capability to extract the spectral phase from weak spectral domain at the two wings of the pulse. To compare the phase retrieval around the center of the pulse, we calculate the weighted average values $\unicode[STIX]{x0394}\unicode[STIX]{x1D711}_{\text{avg}}$
of the phase errors within the range of full width at half maximum (FWHM) of the pulse for both SPIDERs:
$\unicode[STIX]{x0394}\unicode[STIX]{x1D711}_{\text{avg}}$
of the phase errors within the range of full width at half maximum (FWHM) of the pulse for both SPIDERs: $\unicode[STIX]{x0394}\unicode[STIX]{x1D711}_{\text{avg}}=\int _{\text{(FWHM)}}\unicode[STIX]{x0394}\unicode[STIX]{x1D711}(\unicode[STIX]{x1D714})I(\unicode[STIX]{x1D714})\,\text{d}\unicode[STIX]{x1D714}/\int _{\text{(FWHM)}}I(\unicode[STIX]{x1D714})\,\text{d}\unicode[STIX]{x1D714}$
, where
$\unicode[STIX]{x0394}\unicode[STIX]{x1D711}_{\text{avg}}=\int _{\text{(FWHM)}}\unicode[STIX]{x0394}\unicode[STIX]{x1D711}(\unicode[STIX]{x1D714})I(\unicode[STIX]{x1D714})\,\text{d}\unicode[STIX]{x1D714}/\int _{\text{(FWHM)}}I(\unicode[STIX]{x1D714})\,\text{d}\unicode[STIX]{x1D714}$
, where $\unicode[STIX]{x0394}\unicode[STIX]{x1D711}(\unicode[STIX]{x1D714})$
is the spectral phase error and
$\unicode[STIX]{x0394}\unicode[STIX]{x1D711}(\unicode[STIX]{x1D714})$
is the spectral phase error and $I(\unicode[STIX]{x1D714})$
is the spectral intensity. The results show that, by using new method, the phase retrieval error
$I(\unicode[STIX]{x1D714})$
is the spectral intensity. The results show that, by using new method, the phase retrieval error $\unicode[STIX]{x0394}\unicode[STIX]{x1D711}_{\text{avg}}$
improves from 74.2 mrad (T-SPIDER) to 19.3 mrad (CTP-SPIDER) around the center of the pulse, with a factor of
$\unicode[STIX]{x0394}\unicode[STIX]{x1D711}_{\text{avg}}$
improves from 74.2 mrad (T-SPIDER) to 19.3 mrad (CTP-SPIDER) around the center of the pulse, with a factor of ${\sim}4$
. The measured error by CTP-SPIDER is also better than those by previous reports[Reference Bethge, Grebing and Steinmeyer6, Reference Gallmann, Sutter, Matuschek, Steinmeyer and Keller15, Reference Xu, Lavorel, Faucher and Chaux16], where the measured phases were presented with similar level to T-SPIDER. We attribute this superior measured SNR to two factors. The first one is our TSPS measurement which can eliminate the effect of the dc term of the signals, like that in balanced detection. For T-SPIDER, the TSPS method is only applied to measuring the sheared interference spectrum but not to the reference spectrum, so it cannot take full advantage of TSPS to suppress the noise. The second factor is our prism-based design, including the prism-based chirped-pulse-replicas generator, light path delayer and BC where the prisms fix directly on brawny metal posts to replace the mirrors. SPIDER is a spectral interferometry, which is very sensitive to the external conditions, such as vibration and temperature. Mirrors installed on adjustable mounts are easily affected by the environmental perturbation. In CTP-SPIDER, the prism-based design can improve the stability as well as the measured SNR of the system.
${\sim}4$
. The measured error by CTP-SPIDER is also better than those by previous reports[Reference Bethge, Grebing and Steinmeyer6, Reference Gallmann, Sutter, Matuschek, Steinmeyer and Keller15, Reference Xu, Lavorel, Faucher and Chaux16], where the measured phases were presented with similar level to T-SPIDER. We attribute this superior measured SNR to two factors. The first one is our TSPS measurement which can eliminate the effect of the dc term of the signals, like that in balanced detection. For T-SPIDER, the TSPS method is only applied to measuring the sheared interference spectrum but not to the reference spectrum, so it cannot take full advantage of TSPS to suppress the noise. The second factor is our prism-based design, including the prism-based chirped-pulse-replicas generator, light path delayer and BC where the prisms fix directly on brawny metal posts to replace the mirrors. SPIDER is a spectral interferometry, which is very sensitive to the external conditions, such as vibration and temperature. Mirrors installed on adjustable mounts are easily affected by the environmental perturbation. In CTP-SPIDER, the prism-based design can improve the stability as well as the measured SNR of the system.

Figure 5. The measured phase errors by T-SPIDER (blue line) and CTP-SPIDER (red line).

Figure 6. (a) The recovered spectral phases and (b) the temporal characteristics of the laser pulses for different shears from 0.1 to 1.0 nm at $\unicode[STIX]{x1D70F}=0.43$
ps.
$\unicode[STIX]{x1D70F}=0.43$
ps.

Figure 7. The measured pulses by three kinds of SPIDER in small shear: (a) 0.1 nm, (b) 0.25 nm, and (c) 0.35 nm.
Figure 6(a) shows the recovered spectral phases of the laser pulse by CTP-SPIDER for different shears $\unicode[STIX]{x1D6FA}$
from 0.1 nm to 1.0 nm (
$\unicode[STIX]{x1D6FA}$
from 0.1 nm to 1.0 nm ( $0.19{-}1.90$
THz) while Figure 6(b) shows the corresponding temporal shapes and phases of the pulses. The laser pulse is centered at 367.5 THz (796 nm) with a spectral width of 12.7 THz (26.8 nm), and the corresponding Fourier-limited pulse width is 35 fs. The curves coincide well within the range of
$0.19{-}1.90$
THz) while Figure 6(b) shows the corresponding temporal shapes and phases of the pulses. The laser pulse is centered at 367.5 THz (796 nm) with a spectral width of 12.7 THz (26.8 nm), and the corresponding Fourier-limited pulse width is 35 fs. The curves coincide well within the range of $\unicode[STIX]{x1D6FA}$
from 0.25 to 1.0 nm, corresponding to
$\unicode[STIX]{x1D6FA}$
from 0.25 to 1.0 nm, corresponding to $\unicode[STIX]{x1D6FA}/\unicode[STIX]{x0394}\unicode[STIX]{x1D714}=3.7\%{-}15\%$
, as away from this range, the curves begin to separate from others due to the accumulated noise. Fortunately, within the spectral width there gathers the majority of the energy of the spectra, so the shapes and the phases of the pulses agree with others well, as shown in Figure 6(b). The measured pulse width is about 69 fs. The curve of
$\unicode[STIX]{x1D6FA}/\unicode[STIX]{x0394}\unicode[STIX]{x1D714}=3.7\%{-}15\%$
, as away from this range, the curves begin to separate from others due to the accumulated noise. Fortunately, within the spectral width there gathers the majority of the energy of the spectra, so the shapes and the phases of the pulses agree with others well, as shown in Figure 6(b). The measured pulse width is about 69 fs. The curve of $\unicode[STIX]{x1D6FA}=0.1$
nm (
$\unicode[STIX]{x1D6FA}=0.1$
nm ( $\unicode[STIX]{x1D6FA}/\unicode[STIX]{x0394}\unicode[STIX]{x1D714}=1.5\%$
) with pulse width of 74 fs in Figure 6(b) deviates slightly with other curves, which can also reflect the basic feature of the pulse. The shear of 0.1 nm corresponds to three times of the sampling rate or two times of the resolution of the spectrograph we used. Our SPIDER, with a ZAP structure, can operate at
$\unicode[STIX]{x1D6FA}/\unicode[STIX]{x0394}\unicode[STIX]{x1D714}=1.5\%$
) with pulse width of 74 fs in Figure 6(b) deviates slightly with other curves, which can also reflect the basic feature of the pulse. The shear of 0.1 nm corresponds to three times of the sampling rate or two times of the resolution of the spectrograph we used. Our SPIDER, with a ZAP structure, can operate at $\unicode[STIX]{x1D6FA}/\unicode[STIX]{x0394}\unicode[STIX]{x1D714}=3.7\%$
(even 1.5%), which reveals that CTP-SPIDER can control the random phase noise very well. We also compare CTP-SPIDER with traditional and T-SPIDER at small shears, as shown in Figures 7(a)–7(c). For
$\unicode[STIX]{x1D6FA}/\unicode[STIX]{x0394}\unicode[STIX]{x1D714}=3.7\%$
(even 1.5%), which reveals that CTP-SPIDER can control the random phase noise very well. We also compare CTP-SPIDER with traditional and T-SPIDER at small shears, as shown in Figures 7(a)–7(c). For $\unicode[STIX]{x1D6FA}=0.35$
nm, all the curves coincide, which means that the three kinds of SPIDER can operate well under this shear. When we decrease the shear to 0.25 nm, CTP-SPIDER operates well as mentioned above, but the results by traditional and T-SPIDER deviate the curves by CTP-SPIDER as shown in Figure 7. For
$\unicode[STIX]{x1D6FA}=0.35$
nm, all the curves coincide, which means that the three kinds of SPIDER can operate well under this shear. When we decrease the shear to 0.25 nm, CTP-SPIDER operates well as mentioned above, but the results by traditional and T-SPIDER deviate the curves by CTP-SPIDER as shown in Figure 7. For $\unicode[STIX]{x1D6FA}=0.1$
nm, this deviation becomes more obvious. This means that our CTP-SPIDER has very low measured noise that can support a very small shear which needs large phase-connected number. In our opinion, this can be attributed to the prism-based structure and the TSPS measurement that eliminate the dc term of the signals, like that in balanced detection.
$\unicode[STIX]{x1D6FA}=0.1$
nm, this deviation becomes more obvious. This means that our CTP-SPIDER has very low measured noise that can support a very small shear which needs large phase-connected number. In our opinion, this can be attributed to the prism-based structure and the TSPS measurement that eliminate the dc term of the signals, like that in balanced detection.
We use a 6-mm-thick BK7 glass as the Kerr medium to modulate the spectrum; the sheared interferential spectrum is shown in the inset of Figure 8(a) for $\unicode[STIX]{x1D70F}=0.6$
ps. In the Fourier domain, the dc and ac terms of
$\unicode[STIX]{x1D70F}=0.6$
ps. In the Fourier domain, the dc and ac terms of $\tilde{D}(t)$
, both with complex structures, overlap partly with each other, as shown by the gray line in Figure 8. Even so, after applying TSPS, the
$\tilde{D}(t)$
, both with complex structures, overlap partly with each other, as shown by the gray line in Figure 8. Even so, after applying TSPS, the $+$
dc term can be easily filtered (red line). The recovered spectral and temporal characters are shown in Figures 8(b) and 8(c). The measurement can keep available when
$+$
dc term can be easily filtered (red line). The recovered spectral and temporal characters are shown in Figures 8(b) and 8(c). The measurement can keep available when $\unicode[STIX]{x1D70F}$
decreases to 0.4 ps, corresponding to
$\unicode[STIX]{x1D70F}$
decreases to 0.4 ps, corresponding to $N_{f}=44$
, where
$N_{f}=44$
, where $N_{f}$
is the sampling points per interferential fringe. When we use a traditional design, the experiments show that
$N_{f}$
is the sampling points per interferential fringe. When we use a traditional design, the experiments show that $\unicode[STIX]{x1D70F}$
should be no less than 1.3 ps, corresponding to
$\unicode[STIX]{x1D70F}$
should be no less than 1.3 ps, corresponding to $N_{f}=13$
. This means that CTP-SPIDER with larger
$N_{f}=13$
. This means that CTP-SPIDER with larger $N_{f}$
can suppress the random noise (
$N_{f}$
can suppress the random noise ( ${\sim}N_{f}^{1/2}$
) more effectively, or, it has higher capability to measure the pulses that have complex spectral structures.
${\sim}N_{f}^{1/2}$
) more effectively, or, it has higher capability to measure the pulses that have complex spectral structures.

Figure 8. Measured results of complex spectra by inducing Kerr effect.
4 Conclusions
In this paper, we present a complete TSPS prism-based SPIDER (CTP-SPIDER). CTP-SPIDER has combined both ZAP and TSPS into SPIDER. The former implies that this device avoids the unbalanced dispersion from the pulse replicator, and thus can operate for the test pulses with their bandwidths as broad as hundreds of nanometers. The latter can help CTP-SPIDER to cancel the dc term in the sheared interferential spectra, and thereby improve the capability of SPIDER to measure the pulses which have narrow spectra or complex spectral structures. What is more, CTP-SPIDER can apply TSPS not only to the sheared interferograms like the original TSPS SPIDER we have reported, but also to the reference for SPIDER calibration, so it is a complete TSPS SPIDER. TSPS acts as a balanced detection that can not only remove the effect of the dc term of the interferogram, but also reduce measurement noises. In our CTP-SPIDER, some prisms are chosen to replace some vibration or environment-sensitive optical components, especially reflective optics to improve operating stability and improve SNR further.
Based on the design of CTP-SPIDER, our SPIDER measurements show that the ac term containing phase information can easily and accurately be picked out with no need of a filtering window required in traditional SPIDER algorithms. The limitation of the delay $\unicode[STIX]{x1D70F}$
between the SH pulse replicas is greatly relaxed, too. According to our experimental results, CTP-SPIDER can reconstruct a 67-fs pulse available even when
$\unicode[STIX]{x1D70F}$
between the SH pulse replicas is greatly relaxed, too. According to our experimental results, CTP-SPIDER can reconstruct a 67-fs pulse available even when $\unicode[STIX]{x1D70F}$
decreases to 0.125 ps, which means that CTP-SPIDER can work with lower
$\unicode[STIX]{x1D70F}$
decreases to 0.125 ps, which means that CTP-SPIDER can work with lower $\unicode[STIX]{x1D70F}$
, thereby reducing the requirement for the resolution of the used spectrograph. The minimal available spectral sampling interval increases from
$\unicode[STIX]{x1D70F}$
, thereby reducing the requirement for the resolution of the used spectrograph. The minimal available spectral sampling interval increases from $1/8$
to
$1/8$
to $1/2.7$
of spectral modulation fineness
$1/2.7$
of spectral modulation fineness $\unicode[STIX]{x0394}\unicode[STIX]{x1D706}_{M}$
when
$\unicode[STIX]{x0394}\unicode[STIX]{x1D706}_{M}$
when $\unicode[STIX]{x1D70F}$
decreases from 1.0 to 0.3 ps. To verify the improvement of measured SNR, we check the phase error and find that it can keep at the level of 0.1 rad from even when the intensity is lower than 1% of the peak, compared to 10% for T-SPIDER or some other previous reports in Refs. [Reference Bethge, Grebing and Steinmeyer6, Reference Saleh and Teich13, Reference Fan, Li, Xu, Zheng, Cai, Lu and Zeng14]. The high measured SNR means that CTP-SPIDER can work at lower shear
$\unicode[STIX]{x1D70F}$
decreases from 1.0 to 0.3 ps. To verify the improvement of measured SNR, we check the phase error and find that it can keep at the level of 0.1 rad from even when the intensity is lower than 1% of the peak, compared to 10% for T-SPIDER or some other previous reports in Refs. [Reference Bethge, Grebing and Steinmeyer6, Reference Saleh and Teich13, Reference Fan, Li, Xu, Zheng, Cai, Lu and Zeng14]. The high measured SNR means that CTP-SPIDER can work at lower shear $\unicode[STIX]{x1D6FA}$
, or higher spectral resolution. Our experiments show that the available
$\unicode[STIX]{x1D6FA}$
, or higher spectral resolution. Our experiments show that the available $\unicode[STIX]{x1D6FA}$
can be decreased to 0.1 nm for CTP-SPIDER, which is only about
$\unicode[STIX]{x1D6FA}$
can be decreased to 0.1 nm for CTP-SPIDER, which is only about $1/3$
compared with traditional SPIDER or T-SPIDER.
$1/3$
compared with traditional SPIDER or T-SPIDER.
Acknowledgements
The research was supported by the National Natural Science Foundation of China (Nos. 61775142, 61490710 and 61705132), China Postdoctoral Science Foundation (No. 2017M612726) and Shenzhen Basic Research Project on Subject Layout (No. JCYJ20170412105812811).


 Open access