


1 Introduction
Laser systems around the world deliver high peak power pulses in excess of 1 PW[Reference Danson, Haefner, Bromage, Butcher, Chanteloup, Chowdhury, Galvanauskas, Gizzi, Hein, Hillier, Hopps, Kato, Khazanov, Kodama, Korn, Li, Li, Limpert, Ma, Nam, Neely, Papadopoulos, Penman, Qian, Rocca, Shaykin, Siders, Spindloe, Szatmari, Trines, Zhu, Zhu and Zuegel1]. Prior to the results presented in this work, Sung et al. [Reference Sung, Lee, Yoo, Yoon, Lee, Yang, Son, Jang, Lee and Nam2] reported a laser system delivering pulses at 4.2 PW peak power, whereas Zeng et al. [Reference Zeng, Zhou, Zuo, Zhu, Su, Wang, Wang, Huang, Jiang, Jiang, Guo, Xie, Zhou, Wu, Mu, Peng and Jing3] reported 4.9 PW peak power, both using chirped pulse amplification (CPA) schemes[Reference Strickland and Mourou4]. More recently, Yoon et al. [Reference Yoon, Kim, Choi, Sung, Lee, Lee and Nam5] demonstrated 1023 W/cm2 using the CoReLS petawatt laser. Further 10 PW lasers are under construction[Reference Gan, Yu, Wang, Liu, Xu, Li, Li, Yu, Wang, Liu, Chen, Peng, Xu, Yao, Zhang, Chen, Tang, Wang, Yin, Liang, Leng, Li and Xu6–Reference Papadopoulos, Ramirez, Genevrier, Ranc, Lebas, Pellegrina, Le Blanc, Monot, Martin, Zou, Mathieu, Audebert, Georges and Druon8]. These unprecedented power levels provide a solid foundation to perform experimental investigations in fundamental and applied research, from nuclear physics and non-linear quantum electrodynamics to space science and medical applications[Reference Gales, Tanaka, Balabanski, Negoita, Stutman, Tesileanu, Ur, Ursescu, Andrei, Ataman, Cernaianu, D’Alessi, Dancus, Diaconescu, Djourelov, Filipescu, Ghenuche, Ghita, Matei, Seto, Zeng and Zamfir9, Reference Tanaka, Spohr, Balabanski, Balascuta, Capponi, Cernaianu, Cuciuc, Cucoanes, Dancus, Dhal, Diaconescu, Doria, Ghenuche, Chita, Kisyov, Nastasa, Ong, Rotaru, Sangwan, Soderstrom, Stutman, Suliman, Tesileanu, Tudor, Tsoneva, Ur, Ursescu and Zamfir10].
2 Ten petawatt full power laser pulse demonstration
In this paper, we report on the generation of 10.2 PW peak power with the High Power Laser System (HPLS) of the Extreme Light Infrastructure – Nuclear Physics (ELI-NP) facility. The HPLS uses a hybrid CPA – OPCPA (optical parametric CPA) architecture, and has two arms enabling it to deliver two beams with 10 PW laser pulses at a repetition rate of 1 shot per minute.
A detailed description of the HPLS is presented by Lureau et al. [Reference Lureau, Matras, Chalus, Derycke, Morbieu, Radier, Casagrande, Laux, Ricaud, Rey, Pellegrina, Richard, Boudjemaa, Simon-Boisson, Baleanu, Banici, Gradinariu, Caldararu, Boisdeffre, Ghenuche, Naziru, Kolliopoulos, Neagu, Dabu, Dancus and Ursescu11]. It includes the architecture details of the dual arm amplification chain from the 6 fs Ti:Sa laser oscillator in the front-end to the compressors and diagnostics benches corresponding to the six outputs of the system: two at 100 TW and 10 Hz repetition rate, two at 1 PW and 1 Hz repetition rate, and two at 10 PW and 1 shot per minute repetition rate. In addition to the description of the entire HPLS, the operation of the amplifiers, which deliver more than 300 J at the entrance in the 10 PW compressors, was reported. In that work, fully amplified pulses were attenuated and sent to the diagnostics benches placed after the compressors, demonstrating compressibility of the pulses down to 22.7 fs. It was not possible at that time to propagate the full energy of the amplified pulses through the compressor, as the potential back-reflection of the pulse in the absence of a dedicated beam blocker would have posed problems to the integrity of the laser system.
The present paper reports on the first demonstration of the production and propagation of full energy 10 PW pulses down to the experimental area where they will be used. For this demonstration, the full aperture and full energy laser pulses were compressed in the dedicated 10 PW compressors and transported in vacuum over 30 m distance to one of the experimental areas, using the Laser Beam Transport System (LBTS) (Figure 1). In the experimental area, the pulses were absorbed in a 10 PW beam dump (manufactured by Gentec-EO). This beam dump is placed in a vacuum enclosure and uses absorptive glass plates that are placed at different angles of incidence in order to absorb the majority of light and to suppress any back-reflected laser light that may couple into the laser system (Figure 2).

Figure 1 Schematic diagram of the setup showing relevant elements used during the tests: G1–G4, large size gratings of the compressor; M1, leaky mirror; M2 and M3, steering mirrors; WP, high optical quality vacuum viewport; BS, beam splitter; ENERGY, energy-meter; WIZZLER, self-referencing spectral interferometer.
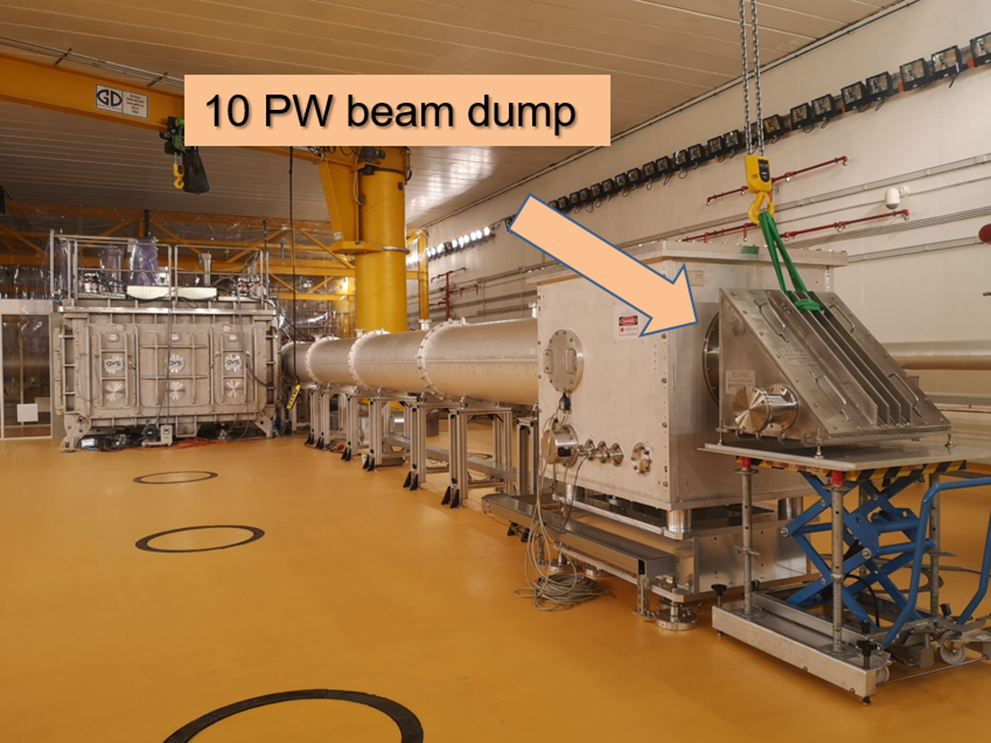
Figure 2 Picture of the 10 PW beam dump installed for this experiment at the end of the transport line.
Please note that in the report of Lureau et al. [Reference Lureau, Matras, Chalus, Derycke, Morbieu, Radier, Casagrande, Laux, Ricaud, Rey, Pellegrina, Richard, Boudjemaa, Simon-Boisson, Baleanu, Banici, Gradinariu, Caldararu, Boisdeffre, Ghenuche, Naziru, Kolliopoulos, Neagu, Dabu, Dancus and Ursescu11] we gave a detailed design description of the laser system at ELI-NP and we demonstrated the system’s capability to deliver 10 PW pulses, while in this report we show the results from the full production and propagation of the 10 PW pulses.
We used a calibrated diagnostics bench, placed after the compressor, as schematically depicted in Figure 1, to measure the on-shot energy of the laser pulses, their duration and the beam profile. The first mirror of the demagnification telescope is an aspherical mirror with a clear aperture of 580 mm and with a curvature at the pole of 9695 mm. We calibrated the energy-meter against the fully amplified energy at the output of the last amplifier. During the shots with high-energy pulses, the calibrated energy-meter on the diagnostics bench measures the fraction of the total energy that is transmitted by M1 and the two beam splitters, BS. Considering the compressor efficiency of 74.2%[Reference Lureau, Matras, Chalus, Derycke, Morbieu, Radier, Casagrande, Laux, Ricaud, Rey, Pellegrina, Richard, Boudjemaa, Simon-Boisson, Baleanu, Banici, Gradinariu, Caldararu, Boisdeffre, Ghenuche, Naziru, Kolliopoulos, Neagu, Dabu, Dancus and Ursescu11], we provide the output energy for the HPLS at the exit of the compressor, in vacuum, reaching up to 251 J.
The pulse duration was measured on the diagnostics bench at low energy levels obtained by attenuating the full aperture and full energy beam in front of the compressor using wedges, as described by Lureau et al. [Reference Lureau, Matras, Chalus, Derycke, Morbieu, Radier, Casagrande, Laux, Ricaud, Rey, Pellegrina, Richard, Boudjemaa, Simon-Boisson, Baleanu, Banici, Gradinariu, Caldararu, Boisdeffre, Ghenuche, Naziru, Kolliopoulos, Neagu, Dabu, Dancus and Ursescu11]. Depending on the specific spatio-temporal distortions of the pulse, sub-aperture measurement of the pulse duration at different locations in the aperture of the pulse might vary. As a consequence, we have chosen to determine the pulse duration of the full aperture of the beam. In order to accomplish this, the pulse is attenuated and demagnified to match the Wizzler input requirements, and the values were cross-checked with a second-order autocorrelator. We used a self-referencing spectral interferometer (Wizzler, manufactured by Fastlite) to measure the spectral phase (Figure 3) and to determine the pulse shape and duration (Figure 4). In order to reach the best compression on the diagnostics bench, the spectral phase was optimized using an acousto-optic programmable dispersive filter (Dazzler, manufactured by Fastlite) installed in the laser system[Reference Lureau, Matras, Chalus, Derycke, Morbieu, Radier, Casagrande, Laux, Ricaud, Rey, Pellegrina, Richard, Boudjemaa, Simon-Boisson, Baleanu, Banici, Gradinariu, Caldararu, Boisdeffre, Ghenuche, Naziru, Kolliopoulos, Neagu, Dabu, Dancus and Ursescu11]. The optimized pulse duration of the central peak measured at full width at half maximum (FWHM) was 21.7 fs, as shown in Figure 4. The Fourier transform-limited pulse duration was numerically calculated to be 19.9 fs. By numerical integration, we calculated that 88% of the energy was delivered in the main peak (between the blue dashed lines in Figure 4), while the remaining 12% of the energy corresponded to the two symmetric temporal lobes.

Figure 3 Spectrum and spectral phase measured using the Wizzler.

Figure 4 Temporal profile of the pulse measured using the Wizzler. The limits used to compute the energy ratio contained under the main peak are indicated with blue dashed lines. A total of 88% of the energy is contained in the main peak.
The pulse duration, measured on the diagnostics bench in air, differs from the pulse duration at the compressor output in vacuum, as it is altered by the dispersion introduced by the leaky mirror M1, the vacuum extraction window WP and a beam splitter BS, which is installed before the Wizzler in the diagnostics bench (see Figure 1). All of these optical components are made of fused silica with a thickness of 91.6 mm for M1 at 45°, 65 mm for WP and 2 mm for BS. We calculated dispersions of  ${\varPhi}^{(2)}=5730$ fs2, ${\varPhi}^{(3)}=4350$ fs3 and ${\varPhi}^{(4)}=-1809$ fs4 introduced by these optical components. We used the previously mentioned acousto-optic programmable dispersive filter to compensate for the dispersion introduced by these optical components. In this way it is ensured that approximately the same pulse duration of 21.7 fs is delivered at the main output of the HPLS.
A sequence of 10 shots at full energy through the entire system (including the compressor, LBTS and beam dump) was fired, as shown in Figure 5, with the pulse duration optimized to be minimum at the main output. During the first eight shots, we gradually increased the pump energy of the last amplifiers to reach a total of 575 J, the required energy for 10 PW peak power generation, by gradually starting the corresponding pump lasers. The last three pulses were fired using the same pumping conditions in the last two high-energy Ti:Sa amplifiers, 169 and 406 J pump energy, respectively. The output energy for each of these pulses was measured using the calibrated energy-meter on the diagnostics bench. The energy in the peak – the left vertical axis of Figure 5 – represents the amount of energy contained in the main peak. This corresponds to 88% of the measured energy, where the percentage was determined as explained in Figure 4. The peak power, illustrated using the right vertical axis of Figure 5, was calculated by dividing the energy in the peak by the pulse duration. Considering the maximum of energy in the compressed laser pulse measured during this sequence of pulses, E = 251.3 J, the 88% of energy under the main peak and the pulse duration  $\tau =21.7$ fs, a ${P}_{\mathrm{p}}$ peak power of 10.2 PW was calculated using the equation ${P}_{\mathrm{p}}=0.88$ $E/\tau$.
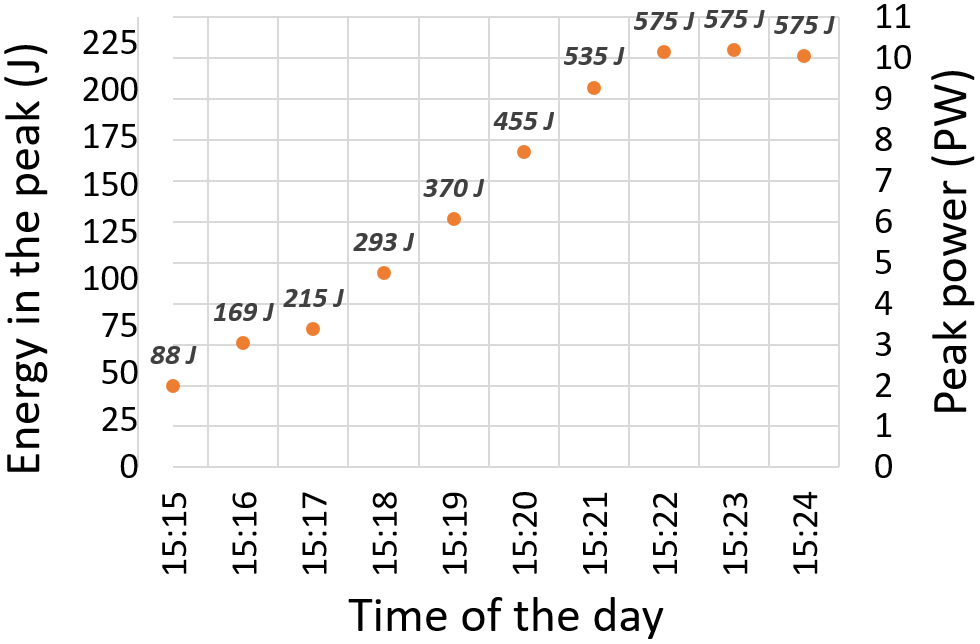
Figure 5 Power evolution during the 10 PW demonstration. Pulses were delivered within 10 minutes. The pump energy in the 10 PW level amplifiers is shown as a label on top of each data point.
The beam profile during the sequence of shots has a stable flat-top shape. This is demonstrated by the recorded near-field images presented in Figure 6 for the last three pulses of the sequence, at a peak power larger than 10 PW. These near-field images of the beam are recorded on-shot using a camera on the diagnostics bench and appropriate optics in order to image the plane of the last grating of the compressor. We used the near-field beam profile to calculate the peak fluence on critical optical components. The calculated local maximum peak fluence on the 45 degrees angle of incidence mirrors was 208 mJ/cm2 with an average fluence of 112 mJ/cm2. For the gratings, placed at a 56 degrees angle of incidence, the local maximum peak fluence was calculated to be 165 mJ/cm2 (average fluence of 88 mJ/cm2), which is well below the measured damage threshold of the peak intensity of the grating at 300 mJ/cm2[Reference Simon-Boisson12].

Figure 6 Beam profile for the last shots fired at more than 10 PW peak power. The label represents the time for the specific measured pulse.
The spectrum stability during this sequence of shots is shown in Figure 7. The spectra presented here are recorded for each presented pulse, at the output of the last amplifier, showing a stable spectrum profile, increasing in amplitude as the pulse energy increases during the ramp up of the laser system. The green curves show the spectra for the three pulses at 10 PW power.

Figure 7 Spectrum at the output of the last amplifier for each pulse. In green are the last three pulses with power larger than 10 PW. In pink are the pulses during the ramp up of the energy.
After the propagation of the high-power pulses through the entire system, all the optical components were inspected for damage with emphasis on the compressor gratings and the 10 PW transport optics. No visual damage was observed on any of the optical components.
3 Conclusion
Laser pulses with peak power above 10 PW were generated for the first time to our knowledge. From the output of the ELI-NP HPLS they were transported in vacuum to the experimental area, using the LBTS. When tightly focused with parabolic mirrors with a focal distance of 1500 mm, currently under installation at ELI-NP, this peak power corresponds to irradiances in the range of 1022–1023 W/cm2[Reference Dancus, Lureau, Matras, Chalus, Derycke, Morbieu, Radier, Casagrande, Laux, Ricaud, Rey, Pellegrina, Richard, Boudjemaa, Boisson, Baleanu, Banici, Gradinariu, Caldararu, Boisdeffre, Ghenuche, Naziru, Kolliopoulos, Neagu, Dabu and Ursescu13] with a worldwide impact in fundamental scientific research and applications that are also envisaged to be pursued at ELI-NP.
Funding
Extreme Light Infrastructure Nuclear Physics (ELI-NP) Phase II, is a project co-financed by the Romanian Government and the European Union through the European Regional Development Fund and the Competitiveness Operational Programme (1/07.07.2016, COP, ID 1334). We also acknowledge the support contract sponsored by the Romanian Ministry of Research and Innovation: PN 19 06 01 05.
Acknowledgements
The authors gratefully acknowledge the contribution of the entire Thales, Alsyom/Seiv and ELI-NP teams and collaborators.


 Open access