


1. Introduction: Manhattan, Berlin and everywhere else
The locations of choice in Leonard Cohen's lyrics “First we take Manhattan, then we take Berlin” are a nightmare for the urban greenhouse gas (GHG) emission accountant. Manhattan's inhabitants emit low amounts of CO2 per capita; but as part of the larger New York context, with ample commuting from surrounding areas where less efficient building densities prevail, this positive example is compromised. Researchers are similarly perplexed by how Berlin's GHG emissions can be properly accounted. Berlin's geographical area is unclear: should the administrative boundaries be chosen, including numerous parks and forests? Or only the built-up area, which itself requires proper definition, be included in calculations? Or, different again, should accounting include the Brandenburg hinterland, which produces large amounts of renewable energy for the city itself?
These kind of urban data challenges derive from the open system character of cities. It is one of the main reasons that a coherent global urban data-based sustainability science is still in its infancy. However, the urgency to tackle this conundrum could not be greater. Urbanization is a megatrend of the 21st century and has a huge impact on climate change and other global environmental challenges such as land-use change. At the same time, cities are the focal points of social challenges as enshrined in Sustainable Development Goal 11 – making cities and human settlements inclusive, safe, resilient and sustainable. With an expected increase in global urban population to 66% by 2050 (UN-DESA, 2018), cities will also need to play a decisive role in the reduction of global CO2 emissions. By 2010, emissions from urban building and transport sectors amounted to about 10 GtCO2, of which 2.8 GtCO2 came from transport, and 6.8 GtCO2 from buildings (Creutzig et al., Reference Creutzig, Agoston, Minx, Canadell, Andrew, Le Quéré and Dhakal2016). By 2030, buildings could account for 12.6 GtCO2 (UN Environment, 2017). Researchers have awakened to these trends and repeatedly call for building a global urban science (Grubler et al., Reference Grubler, Bai, Buettner, Dhakal, Fisk, Ichinose and Weisz2012; Solecki et al., Reference Solecki, Seto and Marcotullio2013; Creutzig, Reference Creutzig2015; Bai, Reference Bai2016; McPhearson et al., Reference McPhearson, Parnell, Simon, Gaffney, Elmqvist, Bai and Revi2016 b; McPhearson et al., Reference McPhearson, Pickett, Grimm, Niemelä, Alberti, Elmqvist and Qureshi2016 c; Acuto et al., Reference Acuto, Parnell and Seto2018; Bai, et al., Reference Bai, Elmqvist, Frantzeskaki, McPhearson, Simon, Maddox, Roberts, Elmqvist, Bai and Frantzeskaki2018 b; Parnell et al., Reference Parnell, Elmqvist, McPhearson, Nagendra and Sörlin2018). However, development towards such global urban science remains stuck in well-trodden paths, as even conferences dedicated to the global dimension of urbanization continue to focus on individual case studies.
Gathering and interpreting urban emissions, climate and ancillary data is important but troublesome for at least four reasons. First, boundaries of analysis are ambiguous and often inconsistent, making city-to-city comparison done on equal footing challenging. This applies to all cities, not only to Manhattan and Berlin.
Second, gathering data is cumbersome, and can easily turn into multi-million dollar efforts. Most of the best data exist for the richest cities and those most committed to addressing climate change issues, such as Paris and Los Angeles. This leads to a huge bias in the data representation of cities. Urban agglomerations with the highest expected growth rate are medium-sized cities and those with a population below one million in Asia and Africa (UN-DESA, 2018). The group of 47 least developed countries (LDCs) currently have the largest population growth rate at 2.4% per year (UN-DESA, 2017). It is precisely these cities that will be most affected by urban growth and its climate change adaptation and mitigation consequences; yet they are the ones lacking the economic resources and infrastructure capacities to systematically collect and assess required urban data.
Third, the data which is collected on cities is often not that which is the most useful for addressing urban climate solutions. For example, cities need building-stock data to understand and quantify the impact of retrofitting, and expanding their built-up area. This is also closely related to the first issue: the data surveyed usually are of varying quality and methodology, making inter-city comparisons cumbersome.
Fourth, qualitative data on contextual information are often missing. Some of the most policy-relevant information is not captured in the quantitative data, but rather in narratives – for example, who, why and how do city inhabitants do things the way they do? These contextual factors are critical for understanding causal relations and socially acceptable pathways to reform. Such information, both for individual cities and across cities, is crucial for building up transferable knowledge, enabling city-to-city learning, and guiding urban policy and practice (Bai et al., Reference Bai, Roberts and Chen2010).
Overcoming these issues is central to developing knowledge-based climate solutions that can be upscaled individually to cities worldwide, while still respecting the differences between cities. A harmonized and large-scale data infrastructure is required to pave the way.
In this paper, we extensively review the efforts of different communities to collect and make use of urban data for addressing climate challenges. We then outline three routes for upscaling urban data science for global climate solutions: 1) Mainstreaming and harmonizing data collection in cities worldwide; 2) Exploiting big data and machine learning to scale solutions while maintaining privacy; 3) Applying computational techniques and data science methods to analyse published qualitative information for systematizing and synthesizing understanding of first-order climate effects and solutions. Together, these efforts will help the creation of a global urban data platform (GUDP), intended to support both scientific efforts and urban decision-makers worldwide. We review the quantitative foundations of global research on cities with specific focus on urban climate solutions; nonetheless, both approach and data will be useful also for other sustainability challenges, such as air pollution and equity in access to water, sanitation and health infrastructures. Hence our contribution also intends to help in building the foundations of Global Urban Sustainability Science.
2. Current state of data-based efforts at the urban-climate-change nexus
A number of disciplines and epistemic communities attempt to provide the data and understanding of urban characteristics relevant and pertinent for climate mitigation and adaptation. Here we review and organize these approaches by looking into:
➢ Accounting for urban GHG emissions by considering urban metabolism studies, data science approaches and assessment studies
➢ Making use of spatially gridded data based on remote sensing to characterize and typologize cities according to climate and other characteristics
➢ Utilizing big data approaches at the scale of individual cities
➢ Data-based approaches for urban climate policies, based on insights from econometrics, urban economics and planning, and ex-post policy analysis
➢ Integrated urban climate, weather and environmental systems and services for sustainable cities.
2.1. Accounting for urban GHG emissions
Cities are open systems. They can be well described by investigating inflows, outflows and storage of energy, water, materials, emissions and wastes, which is the subject of urban metabolism studies (Wolman, Reference Wolman1965; Brunner, Reference Brunner2007; Kennedy et al., Reference Kennedy, Cuddihy and Engel-Yan2007; Kennedy & Hoornweg, Reference Kennedy and Hoornweg2012; Dijst et al., Reference Dijst, Worrell, Böcker, Brunner, Davoudi, Geertman and Zeyringer2018). Over approximately the last two decades, urban metabolism studies have accumulated ample evidence for understanding cities as open systems, for example, energy and material budget and pathways; flow intensity; energy and material efficiency; rate of resource depletion, accumulation and transformation; self-sufficiency or external dependency; intra-system heterogeneity; intersystem and temporal variation; and regulating mechanism and governing capacity (Bai, Reference Bai2016). The importance of such a systemic assessment of all direct and indirect flows increases as the size of the unit of observation decreases. Smaller spatial units such as cities are less self-sufficient and are more dependent on trade and material flows arising outside the city boundaries in the supply chain of traded products used within city limits (Minx, Reference Minx2017).
Urban density and the spatial configuration of activities shape the urban metabolism. For example, the dense city centre of Paris imports its food consumption but exports all waste. Paris’ surrounding areas consume high levels of construction materials and fuel (Barles, Reference Barles2009). A similar case can be made for city infrastructure, such as airports, power plants or wastewater facilities, that are often located outside of urban administrative boundaries (Ramaswami et al., Reference Ramaswami, Hillman, Janson, Reiner and Thomas2008; Hillman & Ramaswami, Reference Hillman and Ramaswami2010). Economic disparity within the city is a key factor that causes large disparities in household carbon footprints and underlying spatial resource flows (Lin et al., Reference Lin, Yu, Bai, Feng and Wang2013; Baiocchi et al., Reference Baiocchi, Creutzig, Minx and Pichler2015; Wiedenhofer et al., Reference Wiedenhofer, Guan, Liu, Meng, Zhang and Wei2017).
2.1.1. GHG assessment frameworks
The urban metabolism literature has served as a blueprint for the discussion on urban GHG assessments: choosing adequate spatial boundaries for the research or policy question under consideration is crucial for assessing urban GHG emissions and directly determines the level and quality of emissions. First, the spatial boundaries of the study region itself need to be determined under consideration of dynamic relationships between the urban core and surrounding periphery. For example, supposedly green and compact cities such as Freiburg and Barcelona or Paris (Beekmann et al., Reference Beekmann, Prévôt, Drewnick, Sciare, Pandis, Denier van der Gon and Baltensperger2015) still display substantial levels of transport emissions mainly driven by commuters from outside the city (Creutzig et al., Reference Creutzig, Mühlhoff and Römer2012). A focus on the spatial extent of the city only would therefore not allow the consideration of all relevant emission reduction options.
Second, the relevance and scope of indirect GHG emissions that occur outside the city in the supply chain of final energy or other products consumed in cities need to be considered. For example, a study of households in Xiamen City (China) shows that up to 70% of emissions can be attributed to regional and national activities outside the city boundaries (Lin et al., Reference Lin, Yu, Bai, Feng and Wang2013). In fact, accounting for such indirect GHG emissions can change the overall picture of the assessments: additional GHG emissions from higher household consumption levels in wealthy downtown can offset savings from more compact urban forms – compared to neighbouring suburban areas (Heinonen et al., Reference Heinonen, Kyrö and Junnila2011). Similarly, the carbon efficiency of Manhattan is offset by surrounding areas compared to emissions from household consumption in smaller metropolitan areas (Jones & Kammen, Reference Jones and Kammen2014).
For obtaining an adequate picture of urban GHG emissions, researchers commonly choose among several major frameworks for assessing GHG emissions (Kennedy et al., Reference Kennedy, Steinberger, Gasson, Hansen, Hillman, Havránek and Mendez2010; Chavez & Ramaswami, Reference Chavez and Ramaswami2011; Ramaswami et al., Reference Ramaswami, Chavez, Ewing-Thiel and Reeve2011): First, territorial-based emission accounting is most common and straight-forward to compute. It aggregates all emissions occurring within urban administrative or functional boundaries (also denoted as Scope 1 emissions) – also those that arise for the production of exports that are consumed outside the city. While a bulk of the available evidence still provides single or small-N studies, there is a growing number of consistent data sets that can be used to assess GHG emissions across metropolitan areas and within and between metropolitan areas over time (Markolf et al., Reference Markolf, Matthews, Azevedo and Hendrickson2017; Shan et al., Reference Shan, Guan, Liu, Mi, Liu, Liu and Zhang2017 a; Shan et al., Reference Shan, Guan, Hubacek, Zheng, Davis, Jia and Mi2018;).
Second, consumption-based emission accounts include all GHG emissions resulting from final consumption activities within the urban boundary (Scope 3 accounting). Hence, it includes the global GHG emissions in the supply chain of products finally consumed within the urban territory and leaves out export-related GHG emissions. Consumption-based GHG estimates have been rare, but more recently a growing number of studies have been published (Chavez & Ramaswami, Reference Chavez and Ramaswami2011; Heinonen et al., Reference Heinonen, Kyrö and Junnila2011; Sudmant et al., Reference Sudmant, Gouldson, Millward-Hopkins, Scott and Barrett2018) and some have even provided estimates for local administrative units across counties (Minx et al., Reference Minx, Baiocchi, Wiedmann, Barrett, Creutzig, Feng and Hubacek2013) or metropolitan areas (Minx et al., Reference Minx, Wiedmann, Wood, Peters, Lenzen, Owen and Ackerman2009; Jones & Kammen, Reference Jones and Kammen2014).
Third, there are hybrid methods such as Scope 2 accounting and particularly trans-boundary supply chain accounting (TBIA) (Chavez & Ramaswami, Reference Chavez and Ramaswami2011; Ramaswami et al., Reference Ramaswami, Chavez, Ewing-Thiel and Reeve2011). Scope 2 emission accounting extends territorial accounts by including upstream emissions from electricity production (Kennedy et al., Reference Kennedy, Steinberger, Gasson, Hansen, Hillman, Havranek and Mendez2009; Kennedy et al., Reference Kennedy, Stewart, Facchini, Cersosimo, Mele, Chen and Sahin2015). TBIA accounts for all emissions that occur within the city boundary, plus all indirect emissions that serve the city and are relevant to its metabolism. The latter includes electricity, airline and commuter travel, water supply and other infrastructures (Ramaswami et al., Reference Ramaswami, Chavez, Ewing-Thiel and Reeve2011). TBIF leaves out all life-cycle GHG emissions of non-infrastructure items, including goods and services consumption of households, but accounts for production within the city.
There is no superior choice among any of these frameworks for urban analysis. Rather, they complement each other by addressing different policy questions and actors and provide a more complete picture for devising effective urban emission reduction strategies. For example, while TBIA is designed for planning decisions by city administrations, local authorities or communities, consumption-based accounting (CBA) mainly informs household actions.
2.1.2. Accounting for urban GHG emissions at the global scale
Urban climate change assessments have tried to understand urban GHG emissions at the global scale (Grubler et al., Reference Grubler, Bai, Buettner, Dhakal, Fisk, Ichinose and Weisz2012; Seto et al., Reference Seto, Dhakal, Bigio, Blanco, Delgado, Dewar, Lwasa, Edenhofer, Pichs-Madruga, Sokona, Farahani, Kadner and Minx2014; Rosenzweig et al., Reference Rosenzweig, Solecki, Romero-Lankao, Mehrotra, Dhakal and Ibrahim2018). Two major efforts can be distinguished: First, the estimation of the urban contribution to global GHG emissions. One set of studies has upscaled samples of urban emission shares for representative countries or regions to the global level (IEA, 2013). A second set of studies have downscaled global or national datasets to grid cells based on information on emission point sources, population or the extent of urban areas. These studies estimate the global urban emission share somewhere between 50 to almost 80% depending on methods and reporting scope (Grubler et al., Reference Grubler, Bai, Buettner, Dhakal, Fisk, Ichinose and Weisz2012; Marcotullio et al., Reference Marcotullio, Sarzynski, Albrecht, Schulz and Garcia2013; Seto et al., Reference Seto, Dhakal, Bigio, Blanco, Delgado, Dewar, Lwasa, Edenhofer, Pichs-Madruga, Sokona, Farahani, Kadner and Minx2014). Due to the very limited data availability for estimation, large uncertainties remain.
Second, bottom-up accounts of urban GHG emissions and sector-specific drivers have been comprehensively reviewed in global assessment studies such as the Global Energy Assessment (Grubler et al., Reference Grubler, Bai, Buettner, Dhakal, Fisk, Ichinose and Weisz2012; Kahn Ribeiro et al., Reference Kahn Ribeiro, Figueroa, Creutzig, Dubeux, Hupe and Kobayashi2012) or the IPCC AR5 (Lucon et al., Reference Lucon, Ürge-Vorsatz, Zain Ahmed, Akbari, Bertoldi, Cabeza, Vilariño, Edenhofer, Pichs-Madruga, Sokona, Farahani, Kadner, Seyboth, Adler, Baum, Brunner, Eickemeier, Kriemann, Savolainen, Schlömer, von Stechow, Zwickel and Minx2014; Seto et al., Reference Seto, Dhakal, Bigio, Blanco, Delgado, Dewar, Lwasa, Edenhofer, Pichs-Madruga, Sokona, Farahani, Kadner and Minx2014; Sims et al., Reference Sims, Schaeffer, Creutzig, Cruz-Núñez, D'Agosto, Dimitriu and Lah2014), and larger databases of urban energy and GHG emissions have been compiled. Even though great progress has been made in developing emission accounting standards for cities (ICLEI, 2018; Nangini et al., Reference Nangini, Peregon, Ciais, Weddige, Vogel, Bréon and CreutzigIn Press), the greatest challenge of such efforts remain with the limited comparability of the data collected due to differences in data availability, choice of physical urban boundaries, choice of reporting scope as well as calculation methods
A small but growing number of studies have made use of compiled data from Grubler et al. (Reference Grubler, Bai, Buettner, Dhakal, Fisk, Ichinose and Weisz2012) or Grubler and Fisk (Reference Grubler and Fisk2012) and other sources, such as the World Bank, the Carbon Disclosure Project, national statistic bureaus or some of the city network initiatives, to investigate patterns of urban GHG emissions and energy use across hundreds of cities worldwide. These analyses show that despite all challenges, important and robust high-level findings can be derived with in depth-analysis using advanced statistical methods. For example, regression tree analysis has been used to identify distinct types of cities that share configurations of drivers of energy demand and resulting GHG emissions such as GDP per capita, population density, heating degree days and transport fuel prices (Creutzig et al., Reference Creutzig, Baiocchi, Bierkandt, Pichler and Seto2015 a). Building such typologies is key for learning on urban climate solutions and synthesizing evidence.
Since the compilation of these data sets, considerable new city data has been published including larger N samples (Shan et al., Reference Shan, Guan, Hubacek, Zheng, Davis, Jia and Mi2018; Nangini et al., Reference Nangini, Peregon, Ciais, Weddige, Vogel, Bréon and CreutzigIn Press) with larger levels of transparency as reporting standards have been more consistently applied. This will open up new avenues for more advanced and insightful analysis of urban GHG emissions and their underlying drivers.
The construction of urban infrastructure is also creating significant emissions in its own right, and the way future cities are built will determine their energy demand and emissions of tomorrow, given the strong path dependence and lock-in potential of urban form (Creutzig et al., Reference Creutzig, Agoston, Minx, Canadell, Andrew, Le Quéré and Dhakal2016). A high share of urban emissions from buildings and transport will originate from both the construction and the usage in new and emerging cities, particularly in Asia, the Middle East and Africa (Creutzig et al., Reference Creutzig, Agoston, Minx, Canadell, Andrew, Le Quéré and Dhakal2016). It is hence of high importance to properly understand the energy and emission implications of urbanization in these world regions, explored in detail in the data spotlight on Asian cities (Box 1). Prospective studies of urban GHG emissions with a full infrastructure and life-cycle perspective, however, remain scarce and require further investigation.
Box 1. Spotlight on Asian cities.
As the quantitative scale of urbanization is nowhere as prominent as it has been in Asia in the first decades of the 21st century, a focus on Asian cities is warranted. Asian cities are growing at a historically unprecedented scale and speed. While data on Asian cities were scarce und unreliable for a long time, recent efforts provide better and harmonized data across a growing number of cities. In CDP's (cdp.net/en/cities) global data bank of 187 cities, only 18 are from Asia, mostly from Japan, South Korea and Taiwan, with the exceptions of two from the Philippines and two from Indonesia. However, existing city emission data and database systems from Japan, South Korea, Taiwan and Hong Kong provide high detail-resolution, but remain mostly undisclosed. The data are coded in local languages and few efforts have been made to translate them into English except for large cities such as Tokyo, Kyoto and Hiroshima. However, emission data of 50 mid-size Japanese cities has been reported and analysed (Makido et al., Reference Makido, Dhakal and Yamagata2012).
In China, the epicenter of current urbanization, there has been a considerable increase in city data and studies related to city emissions in the last two decades. A recent study showed existence of 177 studies, 80 of them in English and 97 related to cities and emissions (Chen et al., Reference Chen, Cai, Dhakal, Pei, Liu, Shi and Hu2017). 122 (or about 45%) of 283 prefecture-level cities have some emission estimates with various levels of details and explanations of methodologies used, mostly based on city energy consumption data (Figure 1). Other studies have accounted for emissions in 18 (Xu et al., Reference Xu, Huo, Liu, Shan, Li, Zheng and Ouyang2018) and 24 Chinese cities (Shan et al., Reference Shan, Guan, Liu, Mi, Liu, Liu and Zhang2017 a), developed consumption-based emission accounts for 13 Chinese cities (Mi et al., Reference Mi, Zhang, Guan, Shan, Liu, Cong and Wei2016) and have specifically highlighted emissions for Tibet (Shan et al., Reference Shan, Zheng, Guan, Li, Mi, Meng and Ma2017 b). Further efforts summarized data of 637 Chinese cities to estimate cross-sector climate mitigation action potentials (Ramaswami et al., Reference Ramaswami, Tong, Fang, Lal, Nagpure, Li and Shi2017; Tong et al., Reference Tong, Fang, Li, Shi, Wang, Wang and Ramaswami2018) and built a high-resolution database of gridded emissions (Cai et al., Reference Cai, Liang, Zhou, Wang, Cao, Qu and Yang2018).
In India, urbanization is slower than in China, but urban areas are likely to hold 40% of India's population and could contribute 75% of India's GDP by 2030 (compared to 31 and 63%, respectively, in 2010). Only few emissions data have been reported for Indian cities. Selected cities where emission are estimated include Ahmadabad (Shukla et al., Reference Shukla, Pangotra, Bazaz, Agarwal and Agarwal2009) and Delhi (Chavez et al., Reference Chavez, Ramaswami, Nath, Guru and Kumar2012). Another recent study uses survey data to estimate urban household based GHG emissions for the largest 60 municipalities in India, finding efficiency gains in larger cities (Ahmad et al., Reference Ahmad, Baiocchi and Creutzig2015).
Urban data scarcity is also pervasive in other South Asian countries. The Japanese Low Carbon Society supported emissions estimates in a number of smaller cities in Malaysia and Vietnam (National Institute for Environmental Studies, 2018) and a few other studies on specific cities, such as those in Kathmandu, have been reported (Shrestha & Rajbhandari, Reference Shrestha and Rajbhandari2010).
The key data issues faced by Asian cities are similar to those for other world regions, and include a lack of reliable key socio-economic and activity data at the city scale; data boundary mismatches; inconsistent methods application; and a lack of realistic assessments of climate solutions and potentials. Consistent evaluation, e.g., under the Global Protocol for Communities (GPC) and support for database development and analysis are crucial to upscale urban data-based climate solutions both for Asia and globally.
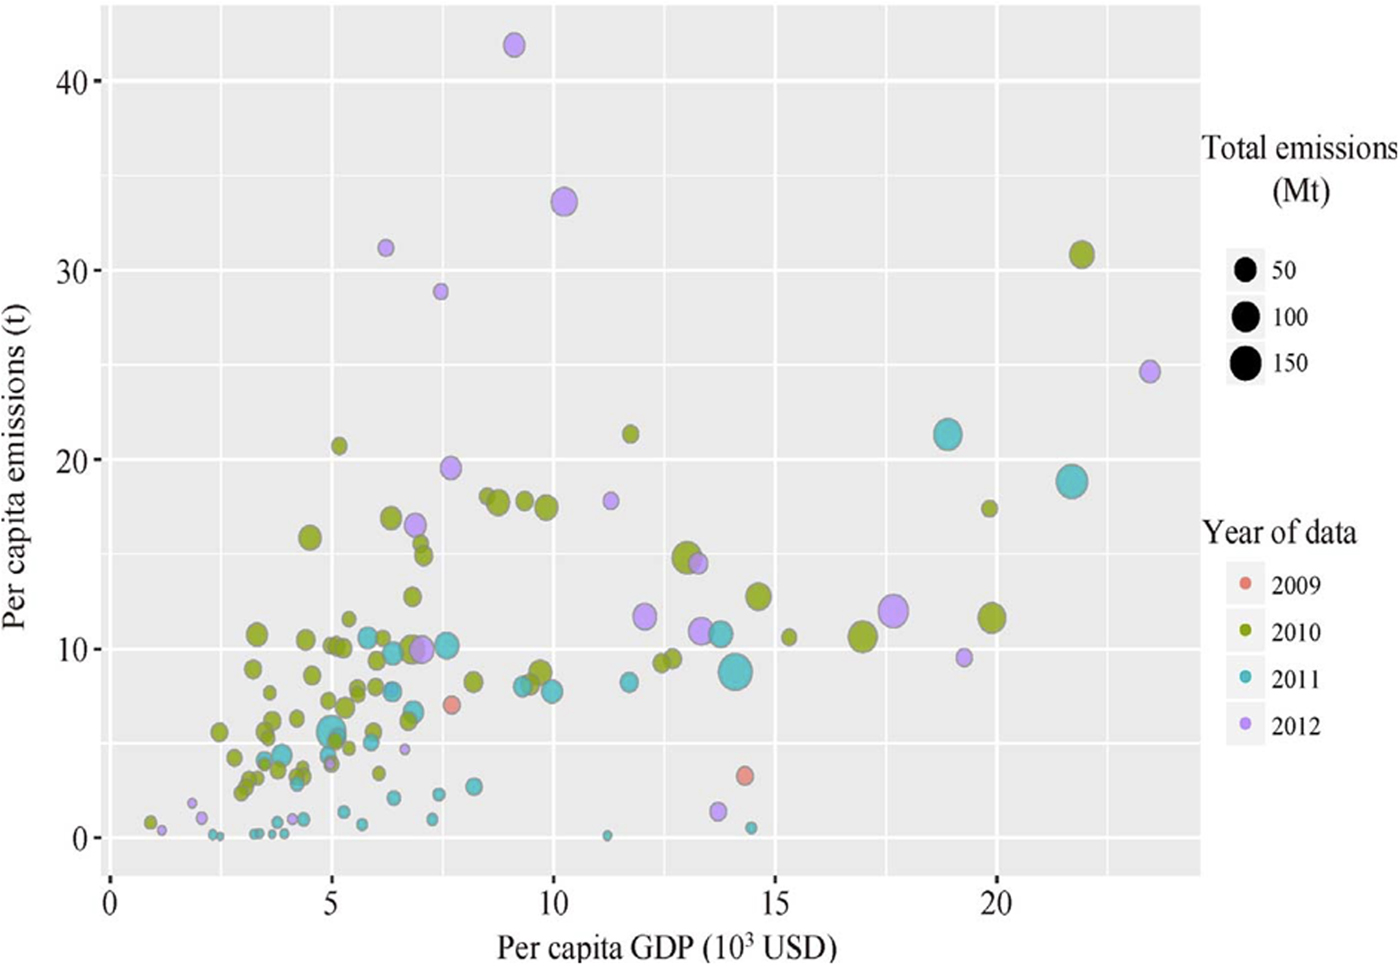
Fig. 1. Per capita emissions and GDP in 122 Chinese cities between 2009 and 2012. Total city emissions vary 1000-fold (from 0.23–305 million tCO2 per year). The time gap between data and publication is significant: the average gap between the year of the city carbon emissions data and the year of publication is reported as 3.9 years.
2.2. Observations and remote sensing in the assessment of cities
In support of post-COP21 actions towards the reduction of climate-disrupting GHG emissions through a sound scientific, measurement-based approach, the 17th World Meteorological Congress (2015) requested a plan for an Integrated Global Greenhouse Gas Information System (IG3IS). A large part of this system, coordinated by the World Meteorological Organization (WMO) with partners, is focusing on observations and detecting mitigation of urban area CO2 and other GHGs (IG3IS, 2016). Within the four implementation objectives, defined by the IG3IS team, one of them is: support subnational government entities such as cities and states that represent large GHG source regions (e.g., megacities) with actionable information on their GHG emissions at the needed spatial, temporal and sectoral resolution to evaluate and guide progress towards emission reduction goals (IG3IS, 2016).
Measuring CO2 concentrations with very high spatial and temporal resolutions would enable unforeseen opportunities in urban GHG emission source allocation and accounting, and the corresponding identification of climate solutions. First steps towards performing such measurements in addition to ground-based observations have already been taken. In the mid-2000s, remote sensing of emissions from huge emitters such as power plants was technologically feasible (Bovensmann et al., Reference Bovensmann, Buchwitz, Burrows, Reuter, Krings, Gerilowski and Erzinger2010). It is becoming increasingly possible to measure lower amounts of CO2 emissions and to take higher resolution measurements thanks to instruments such as NASA's Orbiting Carbon Observatory (OCO-2 and OCO-3) (Eldering et al., Reference Eldering, O'Dell, Wennberg, Crisp, Gunson, Viatte and Chang2017) or ESA's Sentinel-5 for methane emissions (Gurney, Reference Gurney2015). Los Angeles has emerged as a testbed for these advanced monitoring technologies and is following ambitious efforts to provide monitoring to react and reduce its carbon emissions (Newman et al., Reference Newman, Xu, Gurney, Hsu, Li, Jiang and Yung2016). Urban CO2 emissions accounting based on remote sensing will be of increasing relevance in future climate policies and has the potential to alleviate data scarcity in cities in the global south. However, remote sensing data is most valuable when combined with other data that ground-truth it and add additional information from social or economic surveys.
Remote sensing data offers extensive spatial coverage and the potential of temporal consistency. Simple satellite imagery in the visual spectral lengths – photography – allows the inference of structural characteristics such as street networks and the historical development of built-up areas (Yuan et al., Reference Yuan, Sawaya, Loeffelholz and Bauer2005; Xiao et al., Reference Xiao, Shen, Ge, Tateishi, Tang, Liang and Huang2006). Multispectral analysis, aided by established indicators such as the normalized density vegetation index (NDVI) (Gallo et al., Reference Gallo, McNab, Karl, Brown, Hood and Tarpley1993; Tucker et al., Reference Tucker, Pinzon, Brown, Slayback, Pak, Mahoney and El Saleous2005; Grover & Singh, Reference Grover and Singh2015) enables the determination of material properties or the assessment of vegetation properties related to its water content, cover and type (Ridd, Reference Ridd1995), urban land-use structure (Herold et al., Reference Herold, Scepan and Clarke2002), temperature measurements (Tran et al., Reference Tran, Uchihama, Ochi and Yasuoka2006; Imhoff et al., Reference Imhoff, Zhang, Wolfe and Bounoua2010) and pollution (Gupta et al., Reference Gupta, Christopher, Wang, Gehrig, Lee and Kumar2006). A global analysis of the vertical shapes of cities has revealed how cities in different world regions and at different stages of development grow differently: from 1999–2009, Tokyo or New York have grown in the vertical dimension, Indian cities have mostly expanded horizontally, while large Chinese cities have grown in both dimensions (Frolking et al., Reference Frolking, Milliman, Seto and Friedl2013) (Figure 2).

Fig. 2. Changes from 1999–2000 in backscatter power ratio (PR) and nightlight intensity (NL) for 12 global cities. Both metrics represent normalized metrics in the range [0,1]. Higher PR values are interpreted as changes in urban built environment and its 3D structure, whereas changes in NL values correspond to urban growth into peri-urban areas. Large differences in growth characteristics are revealed. From Frolking et al. (Reference Frolking, Milliman, Seto and Friedl2013).
Remote sensing is a powerful tool, but only if combined with other sources (Seto & Christensen, Reference Seto and Christensen2013). Its combination with weather data is an obvious candidate for a global analysis of urban areas and climate change. While weather forecasts and reanalyses are able to provide live assessments and temporally highly resolved meteorological parameters, remote sensing and global climatological climate data sets can inform the long-term climatological characteristics of a city. Particularly interesting are temporal and spatial high-resolution microclimate data, including land surface air temperature and humidity, available for Europe (Haylock et al., Reference Haylock, Hofstra, Klein Tank, Klok, Jones and New2008) and worldwide (Kearney et al., Reference Kearney, Isaac and Porter2014), and urban heat island climatologies (CIESIN, 2016).
Contextualizing remote sensing data with spatialized socio-economic data emerges as an increasingly relevant area of study. In 2010, 4231 cities had a population of more than 100,000 (Atlas of Urban Expansion, 2018). Remote sensing offers the opportunity to assess these cities in a consistent manner and analyse the impacts that these settlements have on land use, GHGs and how they will be impacted by climate change. Night-time imagery has been demonstrated to be a useful proxy for urban extent and economic affluence (Doll et al., Reference Doll, Muller and Elvidge2000) and can be used to estimate spatialized population density data (Bagan & Yamagata, Reference Bagan and Yamagata2015). Visual observations of urban area can be combined with forecasts of economic growth to create spatially-explicit projections of future urban expansion in global cities (Seto et al., Reference Seto, Güneralp and Hutyra2012), allowing an estimation of the associated loss of agricultural land (Bren d'Amour et al., Reference Bren d'Amour, Reitsma, Baiocchi, Barthel, Güneralp, Erb and Seto2017).
Remote sensing information is widely used for climate-change related risk assessment and disaster risk reduction. In particular, understanding flood risks requires a combination of spatially resolved data of physical flood exposure – containing data on elevation, hydrology and built-up area – as well as socio-economic data highlighting economic vulnerabilities to flooding. Such a framework has been presented and applied to case studies, for example, in Copenhagen (Hallegatte et al., Reference Hallegatte, Ranger, Mestre, Dumas, Corfee-Morlot, Herweijer and Wood2011; Ranger et al., Reference Ranger, Hallegatte, Bhattacharya, Bachu, Priya, Dhore and Corfee-Morlot2011) and an overview of future flood risks in 136 major coastal cities has been previously published (Hallegatte et al., Reference Hallegatte, Green, Nicholls and Corfee-Morlot2013).
Downscaled models of climate impacts are crucial to map urban adaptation challenges worldwide. Scheuer et al. (Reference Scheuer, Haase and Volk2017) propose using the Theil-San estimate and Euclidian distance as a measure of magnitude of climate change, both in temperature and humidity, including long-term average changes as well as weather extremes. This method can be applied for any city and hence enables global comparisons and rankings of climate change impacts (Figure 3). A US-specific study combines Landsat and MODIS data in a land model to assess the impact of urbanization on US surface climate, finding relevant warming and increased surface run-off in built-up areas, but with varying patterns across cities (Bounoua et al., Reference Bounoua, Zhang, Mostovoy, Thome, Masek, Imhoff and Toure2015).
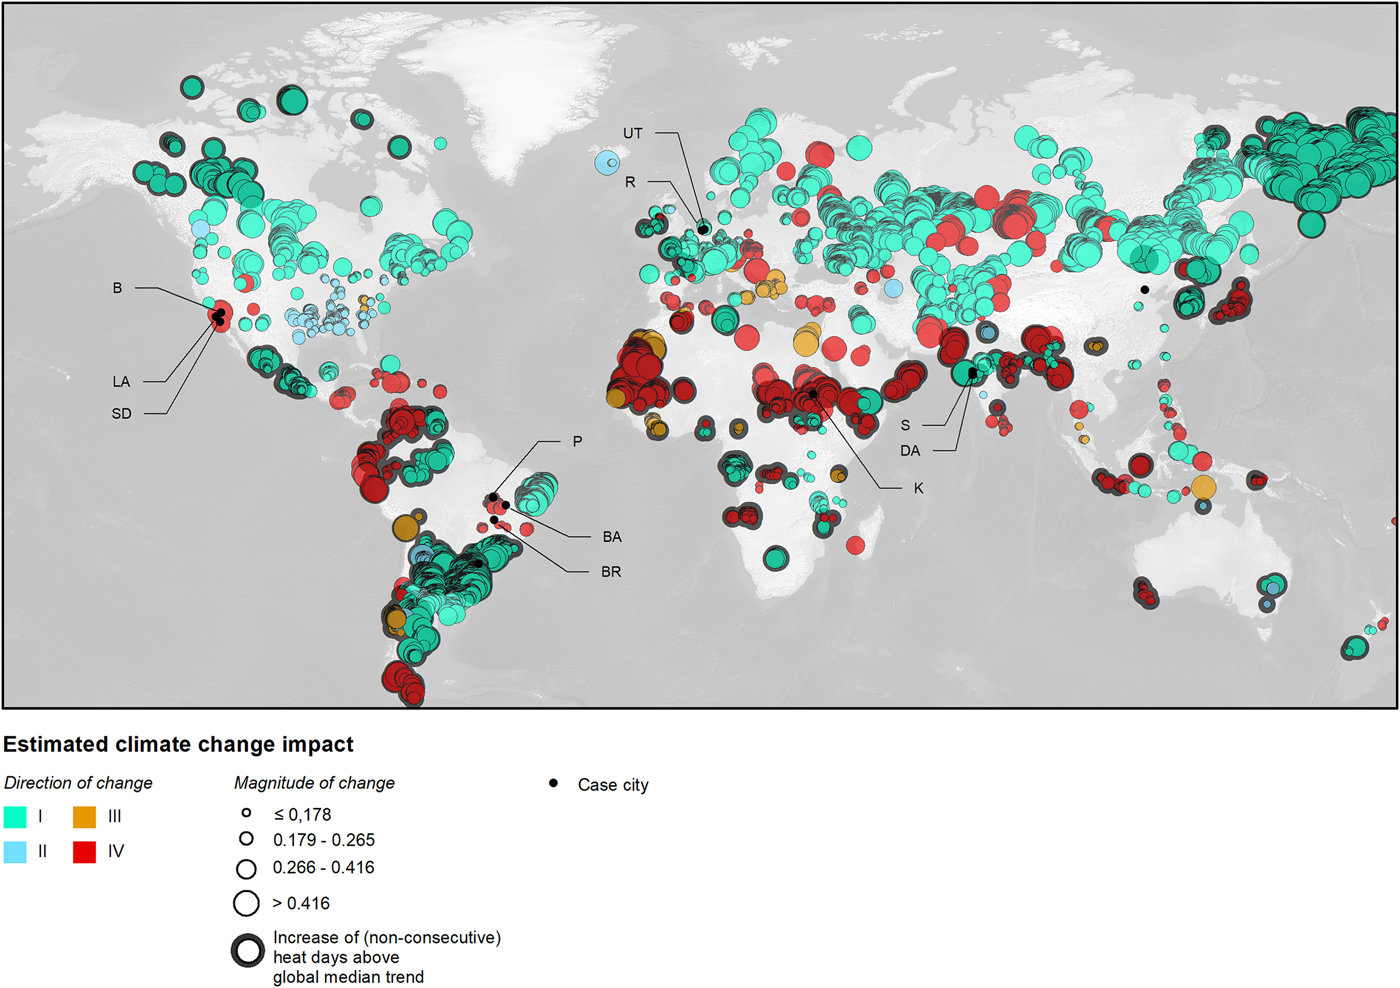
Fig. 3. Mapping direction of change in temperature from 1901 until 2014 and precipitation from 1901 until 2013 in cities. The direction of change is indicated by colour, where I equals warmer and wetter; II colder and wetter; III colder and drier; and IV warmer and drier conditions. Direction of change is measured as Euclidean distance in the 2D space comprising temperature and precipitation change. The classification of the magnitude of change corresponds to quartiles. Examplary city abbreviations are as follows: B, Barstow (San Bernardino County, US); BA, Barreiras (Bahia state, Brazil); BR, Brasilia (DF, Brazil); DA, Daman (India); K, Khartoum (Sudan); LA, Los Angeles (Los Angeles county, US); P, Palmas (Tocantins/Brazil); R, Rotterdam (Netherlands); S, Surat (India); SD: San Diego, US; UT, Utrecht (Netherlands).
Remote sensing can be used to help assess challenges of urban climates, especially the urban heat island effect. Remote sensing allows the application of a consistent methodology across many cities (Peng et al., Reference Peng, Piao, Ciais, Friedlingstein, Ottle, Bréon and Myneni2012). Quantities from satellite remote sensing, such as the NDVI, can predict surface urban heat island (UHI) (Peng et al., Reference Peng, Piao, Ciais, Friedlingstein, Ottle, Bréon and Myneni2012; Zhou et al., Reference Zhou, Rybski and Kropp2017) and remote sensing can reveal the growth of the UHI with growth of the urban area extent (Streutker, Reference Streutker2003). Urban climates will most significantly be impacted by more severe heat waves (Ganguly et al., Reference Ganguly, Steinhaeuser, Erickson, Branstetter, Parish, Singh and Buja2009; Li & Bou-Zeid, Reference Li and Bou-Zeid2013), which can be explicitly scaled down to specific urban locations in climate models. This is of particular importance as heat waves lead to deadly outcomes (Mora et al., Reference Mora, Dousset, Caldwell, Powell, Geronimo, Bielecki and Trauernicht2017; Nissan et al., Reference Nissan, Burkart, Coughlan de Perez, Van Aalst and Mason2017), with currently 30% of the global population living in areas experiencing deadly heat in future climates (Mora et al., Reference Mora, Dousset, Caldwell, Powell, Geronimo, Bielecki and Trauernicht2017). Such spatially-explicit data can help to assess and ease and standardize communications of climate impact and enable the identification of cities with similar adaptation challenges (Creutzig, Reference Creutzig2015). Box 2 provides further examples of how high-resolution maps can assist the integrated assessment of settlement patterns.
2.3. Big data approaches at city-scale
Big data, understood as voluminous and complex data of different qualities, have the potential to generate new hypotheses and new methods for understanding interactions between social, biophysical and infrastructure domains of complex urban systems facing challenges related to climate change (Herold et al., Reference Herold, Scepan and Clarke2002; McPhearson et al., Reference McPhearson, Pickett, Grimm, Niemelä, Alberti, Elmqvist and Qureshi2016 c). Crowd-sourced and big data, such as the movement of people tracked by cell phones, offer manifold new possibilities for assessing the inner workings of a city, and the availability, quality and quantity of data is rapidly evolving (Figure 4). Crowd-sourced information can serve as a reliable proxy, with vastly improved resolution and replication, for more traditional empirical social survey methods (Wood et al., Reference Wood, Guerry, Silver and Lacayo2013). This and similar social media analyses (Keeler et al., Reference Keeler, Wood, Polasky, Kling, Filstrup and Downing2015) offer the opportunity to complement existing traditional approaches to collecting information on human behaviour in cities, that can be brought together with other sources of biophysical and infrastructural data, especially in spatial formats through GIS. Big data can also emerge from municipal hotlines, city planning offices, utility use and repair records, tax assessor databases, and the rapid emergence of sensors and instrumented buildings, roads and even ecological spaces. The utility of big data for understanding urban systems including climate impacts and efficacy of climate solutions will only increase with time (Knox, Reference Knox2014).
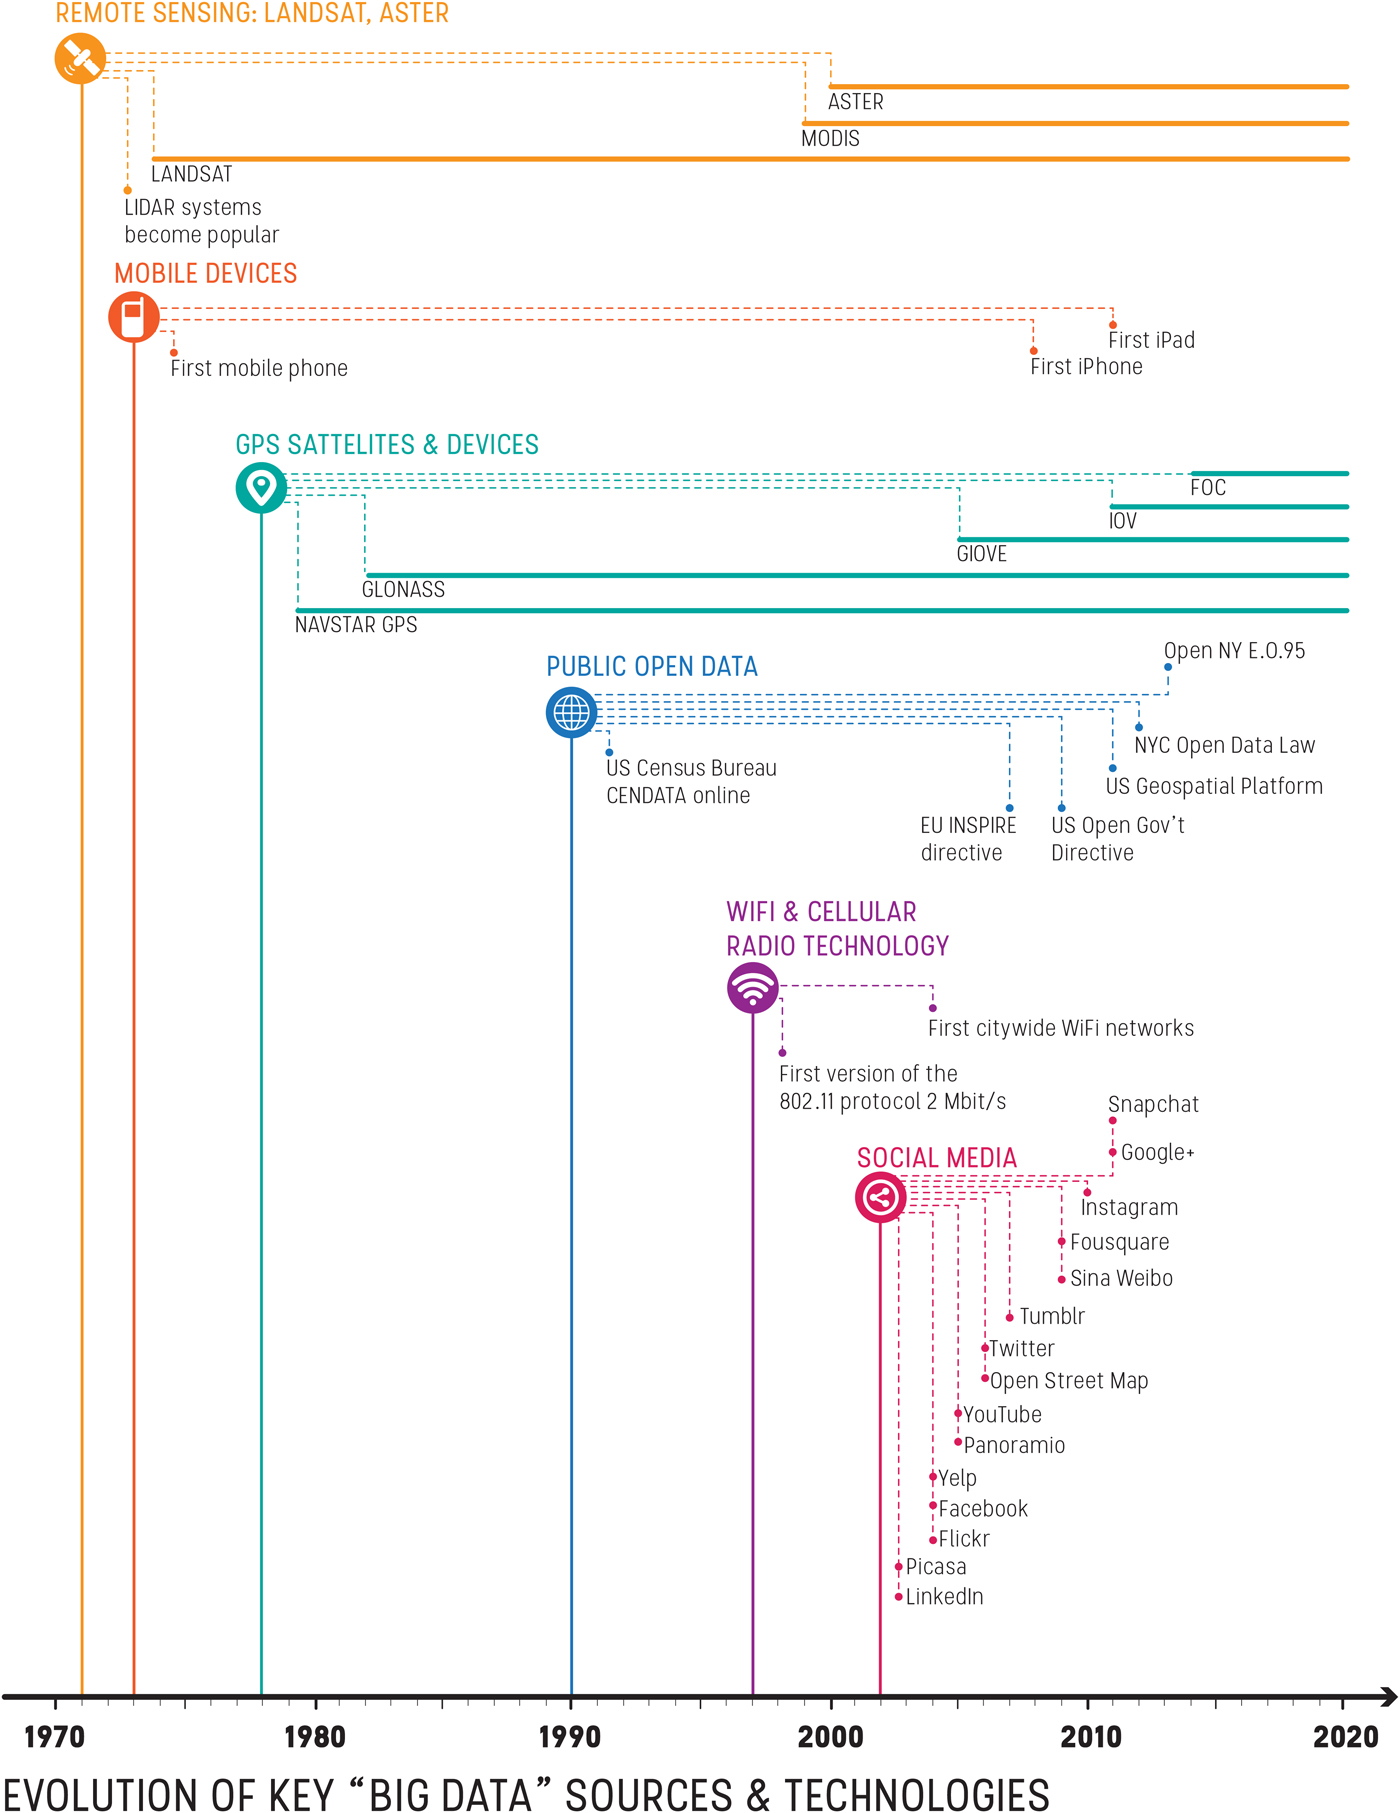
Fig. 4. Evolution of key ‘big data’ sources and technologies and the rise of social media data. The evolving data landscape over the past few decades demonstrates the increasing availability of location-based social, infrastructural and landscape/biophysical data. Social media data represents a major new phase in our ability to understand links between human behaviour, values and preferences, and infrastructural, climatological or other core components of urban, peri-urban and rural systems that are important for driving transformative change for improving sustainability. Source: Ilieva and McPhearson (Reference Ilieva and McPhearson2018).
Urban decision-makers need improved and regularly updated information on human behaviour and perceptions and how they relate to global and local climate change. Linking human behaviour in cities to downscaled climate projections and remotely sensed observations of urban form, land-use patterns, land cover and social-demographic information from national and international databases has the potential to drive a much more nuanced and highly spatially resolved platform for improved decision-making. Over the past decade, with the advance of big data and the digital social sciences, as well as the growing use of social media data (SMD) in geography studies, a host of new opportunities to augment and expand urban systems and climate impacts research have emerged (Ilieva & McPhearson, Reference Ilieva and McPhearson2018).
Geocoded SMD from social media users (e.g., Flickr, Twitter, Foursquare, Facebook, Instagram) offer an important new opportunity to fill data gaps and tackle many of the barriers that prevent researchers and practitioners from understanding the human behaviour component of urban system dynamics and climate change. SMD and other big data enable researchers to ask a wide range of spatially explicit questions at an unprecedented scale. Most social media provide the possibility to manually select the location from where one posts a message, or have it automatically added through geolocation tracking services. Even though, at present, geolocated tweets and Flickr photographs represent a tiny fraction of the overall volume of SMD (e.g., tweets geocoded via GPS constitute only 1% of all tweets) (Crampton et al., Reference Crampton, Graham, Poorthuis, Shelton, Stephens, Wilson and Zook2013) the sheer quantity of these data makes them worth examining. Geotagged tweets can augment traditional control data (e.g., remotely sensed images, roads, parcels). For example, geolocated Twitter messages can serve as control data for modelling population distribution (Lin & Cromley, Reference Lin and Cromley2015).
Research using geolocated SMD to study socioeconomic disparities and their relationship to climate impacts in cities is also starting to take shape. Crowd-sourced data from Foursquare users in London, for instance, has been shown to be a reliable proxy for the localization of income variability and highlighting where more at risk neighbourhoods are across the city (Quercia & Saez, Reference Quercia and Saez2014). Yet, mapping based on demographically unrepresentative data can also reproduce spatial segregation and provide an unfair picture of the places that matter citywide (Cranshaw et al., Reference Cranshaw, Schwartz, Hong and Sadeh2012). This holds true for global-scale analyses as well. The volume of geocoded tweets greatly differs across nations. The US and Brazil are some of the countries where the ratio between geocoded and non-geocoded tweets is the highest, while countries such as Denmark and Norway register significantly lower values (Graham et al., Reference Graham, Stephens and Hale2013). The emergence of multiple forms of big data creates exciting alternatives to assess how people use and respond to urban events, plans, policies and designs for climate change adaptation and mitigation. New forms of data may be a crucial resource in examining the use, value and social equity of particular spaces in the city that provide refuge during climate driven extreme events, such as parks, vacant areas and nonpark open spaces that can provide, for example, cooling during heat waves. Working with big data offers opportunities with multiyear to decadal data sets to understand human–nature interactions in the city as never before and could prove crucial to assessing progress on examining impacts of climate change and of mitigation options in cities (Ilieva & McPhearson, Reference Ilieva and McPhearson2018).
Box 2. High-resolution maps for assessment.
High-resolution maps containing population, settlements and urban footprints form the basis for an integrated assessment of global settlement patterns. Rapid advances have been made in the past decade in the development of such maps. Both new satellite technology – such as the Tandem-X radar satellites – and improved data processing via machine learning have facilitated rapid advances in their accuracy and resolution. Until recently, the MODIS 500 urban land cover (Schneider et al., Reference Schneider, Friedl and Potere2010) represented the state of the art in urban land cover data sets (Potere et al., Reference Potere, Schneider, Angel and Civco2009). It is now outperformed by both the Global Urban Footprint (GUF) data set which provides higher resolution and accuracy than any other urban land cover data set (Esch et al., Reference Esch, Heldens, Hirner, Keil, Marconcini, Roth and Strano2017), even when compared to the high quality Global Human Settlement Layer (GHSL) (Pesaresi et al., Reference Pesaresi, Huadong, Blaes, Ehrlich, Ferri, Gueguen and Zanchetta2013; Pesaresi et al., Reference Pesaresi, Ehrilch, Florczyk, Freire, Julea, Kemper and Syrris2016) or GlobeLand 30 (Chen et al., Reference Chen, Chen, Liao, Cao, Chen, Chen and Mills2015). The GUF features a binary urban footprint at a resolution as high as 0.4” (approximately 12 m) at the equator and 0.6” in the mid-latitudes on a global coverage, and is freely available for scientific use. This high resolution constitutes a paradigm shift in studying urban extent for cities worldwide.
Various sources of big data have already been useful for informing disaster risk management and climate adaptation planning. Kusumo et al. (Reference Kusumo, Reckien and Verplanke2017) used volunteered geographic information through SMD as a source for assessing the desired location and capacity of flood evacuation shelters, while Brouwer et al (Reference Brouwer, Eilander, Van Loenen, Booij, Wijnberg, Verkade and Wagemaker2017) used SMD sourced observations of flooding to develop a method for estimating flood extent in Jakarta, Indonesia. In New York City, following the devastating impact of Hurricane Sandy, researchers used Twitter SMD to reveal the geographies of a range of social processes and practices that occurred immediately after the event (Shelton et al., Reference Shelton, Poorthuis, Graham and Zook2014). Stefanidis et al. (Reference Stefanidis, Crooks and Radzikowski2013) used Twitter data collected during the devastating Sendai (Tohoku) earthquake in Japan (3/11/11) to examine social networks and build a database for studying the human landscape of post-disaster impacts. Understanding interactions between climate change and fire prone landscapes is another important area of concern for both climate change adaptation and disaster risk reduction. Kent et al. (Reference Kent and Capello2013) were able to use SMD (including Twitter, Flickr, Picassa and Instagram data) to examine spatial patterns of situational awareness during the Horsethief Canyon Fire (2012) in Wyoming, USA and demonstrated the utility of SMD for actionable content during a crisis.
Combining satellite data with other datasets and analysing it via state-of-the-art machine learning is another promising route. For example, it allows for the estimation of poverty levels from satellite data (Jean et al., Reference Jean, Burke, Xie, Davis, Lobell and Ermon2016) (see Box 3).
SMD and other sources of big data are not without privacy and ethical challenges. While ethical concerns pertain to all kinds of research methods and data, in SMD-based research they are often due to uncertainty about present and future rules of conduct for data collection and analysis and data access arrangements. Regarding the rules of conduct, a major challenge is the risk of violating social media users’ privacy. This could occur either directly through, for example, the use of user-generated geolocated data (Schwartz & Halegoua, Reference Schwartz and Halegoua2015), or indirectly through the coupling of multiple data sources revealing information that users had no intention to disclose (Acquisti & Gross, Reference Acquisti and Gross2009). The general point of contention is that social media users do not grant consent for the extraction and circulation of the data they author in any formal way, nor do they generally picture researchers as the intended audience of the content they share with relatives, friends and colleagues (Schwartz & Halegoua, Reference Schwartz and Halegoua2015). Thus, the manipulation of SMD can lead to unwanted privacy invasion and transparency evasion. Ilieva and McPhearson (Reference Ilieva and McPhearson2018) suggest seven ways to begin to address privacy and ethical concerns with the use of SMD in sustainability research:
• Anonymize data and ensure that no interaction with the individuals in the sample takes place
• Use only geotagged and time-stamped information without accessing personal details
• Assess how SMD research complies with IRB guidelines
• Secure data and resolve ownership and IP issues
• Host data-download applications on a restricted access website
• Use more integrated analytical tools with privacy protection
• Re-conceptualize privacy
Big data can become a central tool for online monitoring of urban risks and climate policies, enabled by sensor-based cities and the vast amounts of data routinely generated by their inhabitants via social media (Figure 4 illustrates the Newcastle case). Applications include:
➢ Using real-time data feeds from local weather stations, rainfall gauges and sewer gauging to assimilate real-time data within hydrodynamic models for improved flood prediction;
➢ Combining local high frequency observations, with regional/national monitoring and predictions, along with tracking of geospatial social messaging (e.g., tweets of incidents as they occur) to provide improved early warning of potential impacts;
➢ Employing image processed CCTV feeds to understand hazards, e.g., of surface water locations and social media feeds to validate in real-time the emergent patterns of flooding;
➢ Integrating spatially heterogeneous sensor data feeds on flows and movements (e.g., traffic) with geospatial social messaging, CCTV and other data for improved understanding of the temporal dynamics of impacts;
➢ Coupling CCTV monitoring with social media data feeds to better understand citizen reaction and response to emerging impacts for improved future hazard mitigation and planning;
➢ Using knowledge from previous events, including modelling result sets of both hazards and impacts, to improve ‘ahead of event’ response from the site to the city-scale for future ‘events’.
An example for a specific city is the Newcastle Urban Observatory which records one million city observations a day, of over 50 social, environmental and technical processes, across the city. These include transport emissions, precipitation, surface water and river flows, air and water quality, and biodiversity health indices such as beehive weight. The data are openly available through an API and can inform adaptation and mitigation activities in sectors such as transport, building energy, urban greening and flood management. The City Council are already using this high-resolution dataset to inform environmental and transportation strategies.
Box 3. Machine learning approaches to process remote sensing data
Machine learning techniques, such as neural networks, are powerful tools for the analysis of big, multi-dimensional and often complex big data, where complexity needs to be reduced to understand its main drivers (Hinton & Salakhutdinov, Reference Hinton and Salakhutdinov2006). Convolutional neural networks (CNN) serve well to classify images (Krizhevsky et al., Reference Krizhevsky, Sutskever and Hinton2012), and are increasingly used to assess land-use patterns (Castelluccio et al., Reference Castelluccio, Poggi, Sansone and Verdoliva2015). Some researchers have taken this approach further and combined it with the analysis of socio-economic data (Tapiador et al., Reference Tapiador, Avelar, Tavares-Corrêa and Zah2011; Jean et al., Reference Jean, Burke, Xie, Davis, Lobell and Ermon2016). Jean et al. (Reference Jean, Burke, Xie, Davis, Lobell and Ermon2016)’s work is particularly instructive. They predict poverty in five different African countries – Nigeria, Tanzania, Uganda, Malawi and Rwanda – at a ward/village scale using a combination of CNN, daytime satellite imagery and nightlight data. To build their analysis, they use a three-step approach. First the CNN is trained on ImageNet (Deng et al., Reference Deng, Dong, Socher, Li, Li and Fei-Fei2009) to learn how to distinguish visual properties such as edges and corners. In the second step it is fine-tuned so that it is able to predict night-time intensities from daytime images. Nightlights are a globally consistent predictor of poverty, thus the model is trained to focus on the aspects in daytime imagery that are relevant to poverty estimation. In the third and final step, socioeconomic survey data is added to the analysis. It is used to train ridge-regression models on both household surveys and the image features from steps 1 and 2. Their approach exploits night-time data as a globally consistent, but highly noisy proxy for poverty in an intermediate step and ultimately explains 37 to 55% of average household consumption, and 55 to 75% of the variation in average household asset wealth. While using publicly available data, it provides better results than mobile-phone based studies and far outperforms products that rely solely on nightlights. Another recent study uses data taken from Google Street View images and machine learning techniques (feature extraction and v-support regression) to successfully estimate high income areas in US cities (Glaeser et al., Reference Glaeser, Kominers, Luca and Naik2018). The usage of phone records can reveal detailed mobility patterns for improving both the understanding of travel behaviour and traffic management (Toole et al., Reference Toole, Colak, Sturt, Alexander, Evsukoff and González2015).
However, in order to realize the full potential of ‘big data’ sensor networks and social media feeds that are continuously capturing the dynamics of cities in real-time, new approaches are required. These must rigorously evaluate and integrate real-time data and information from traditional and new ‘big data’ sources. The sheer volume of information requires advanced analytics and methods for uncertainty handling to process and assimilate this data for real-time decision-making and long-term planning.
2.4. Data-based approaches for urban climate policies
Urban climate mitigation and adaptation actions encounter many roadblocks (Bulkeley & Betsill, Reference Bulkeley and Betsill2013; Rosenzweig et al., Reference Rosenzweig, Solecki, Hammer and Mehrotra2011). There are inherent spatial, temporal and institutional scale mismatches between urban governance and climate actions, which means urban scale climate policies often encounter more serious roadblocks such as political will, institutional arrangements, financial and knowledge capacity, and are influenced by misinformed perceptions and arguments (Bai, Reference Bai2007 b). However, data is arguably one of the first challenges cities encounter once they embark on the journey to address climate change/urban sustainability issues. Indeed, lack of information and data can become a serious constraint for smaller cities, and in particular for the majority of cities in the Global South (Nagendra et al., Reference Nagendra, Bai, Brondizio and Lwasa2018). We argue that the right data at the right scale is an insufficient but necessary condition for urban climate policies.
Three data-based approaches will help to directly support the design of targeted climate policies, as they will inform their mitigation and adaptation potential. Availability of data may not guarantee climate-friendly policies alone, but can inform about best solutions.
The first approach makes use of GHG data accounting and ancillary variables to identify city-specific drivers of emissions and climate risks, and infer policy levers. The second approach combines urban economics and urban planning insights to properly explain observed data and predict consequences of policy implementations. The third approach performs systematic policy reviews of urban municipalities, providing an ex-post analysis of climate actions. The set of all three approaches is required to upscale urban climate solutions beyond individual cities.
2.4.1. Driver analysis of urban climate data
Data of urban GHG emissions and energy use, combined with ancillary socio-economic, geographical and urban form parameters, allow for the identification of policy levers stratified across types of cities. Globally, urban typologies demonstrate how climate mitigation efforts require different policies for different city types. Advanced statistical analysis of large data sets (decision tree methods) reveal the uniting and dividing drivers of urban energy use across different cities (Creutzig et al., Reference Creutzig, Baiocchi, Bierkandt, Pichler and Seto2015 a). Results demonstrate that transportation fuel taxes are a main lever to not only influence urban transport emissions, but also total urban GHG emissions (Creutzig et al., Reference Creutzig, Baiocchi, Bierkandt, Pichler and Seto2015 a). The same method in identifying levers has also been successfully applied for countries like the UK, enabling a more refined analysis of drivers, such as heating systems and building vintages, at high spatial resolution (Figure 5) (Baiocchi et al., Reference Baiocchi, Creutzig, Minx and Pichler2015). Intertemporally consistent household surveys performed in India similarly enable the spatially complete analysis of household energy demand and GHG emissions, stratified along individual social and economic characteristics (Ahmad et al., Reference Ahmad, Baiocchi and Creutzig2015). Arguably, similar typologies could also be suitable for identifying climate adaptation strategies (Creutzig, Reference Creutzig2015).
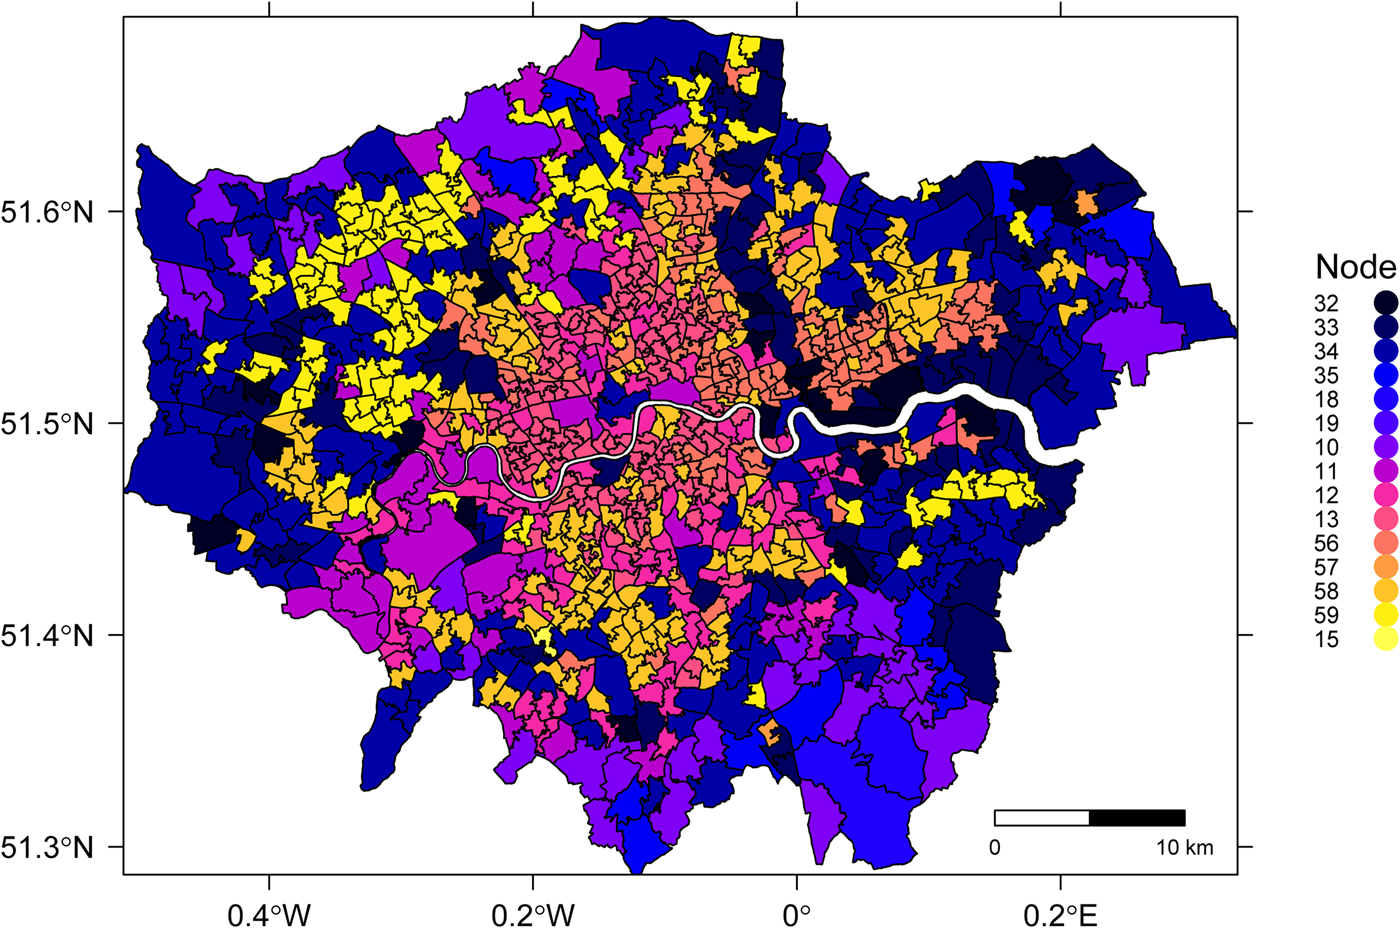
Fig. 5. London administrative units are characterized by patterns of residential emission drivers. Each node corresponds to a statistically distinct combination of housing, climate, urban form and socio-economic characteristics explaining location-specific residential GHG emissions. Source: Baiocchi et al. (Reference Baiocchi, Creutzig, Minx and Pichler2015).
The advantage of this approach is a globally consistent method identifying options stratified across city-specific characteristics. This inter alia allows mayors to learn from best-in-class cities of the same type. Cities can be classified into different types by using urban form, economic activity, transport costs and geographic factors as typical indicators (McPhearson et al. Reference McPhearson, Parnell, Simon, Gaffney, Elmqvist, Bai and Revi2016 b). Distinct city types with varying degrees of centricity emerge, such as spread-out commuter cities or dense cities (Baiocchi et al. Reference Baiocchi, Creutzig, Minx and Pichler2015; Creutzig Reference Creutzig2015). The disadvantage is that this method neither provides city-specific resolution on implementation, nor does it identify barriers and obstacles in the political economy.
2.4.2. Urban economics and urban planning
Theory and conceptual insights on how cities can be influenced to reach mitigation goals are highly relevant for urban policy decisions, especially when empirically founded. Here, both urban economics theory as well as empirically founded analyses on cities as complex systems come into play. Urban economics theory explains the key relationship between land prices, transportation costs and amenities such as schools (Fujita, Reference Fujita1989), which greatly influence land use and energy demand and is well-founded by empirical data pointing to the relationship between urban density and energy requirement (Newman & Kenworthy, Reference Newman and Kenworthy1989). Urban econometric models aim to identify key drivers of emissions that have complex repercussions (Creutzig, Reference Creutzig2014; Borck & Brueckner, Reference Borck and Brueckner2016). This theory supports the strong and non-linear effect of fuel prices on both transport energy demand and urban density (Creutzig, Reference Creutzig2014; see also Figure 6). Population density was shown to be a proxy variable for more specific urban form parameters, such as street connectivity and commuting distance (Mindali et al., Reference Mindali, Raveh and Salomon2004). More general meta-analysis highlights the relevance of the ‘5Ds’ (density, diversity, design, destination accessibility and distance to transit) as key variables of urban planning for reducing GHG emissions (Ewing & Cervero, Reference Ewing and Cervero2010; Stevens, Reference Stevens2017). Population density reveals to be a useful proxy nonetheless: thresholds for energy-efficient public transportation of around 50–150 persons/ha point to sustainable urban development windows, enabling low-carbon mobility (Lohrey & Creutzig, Reference Lohrey and Creutzig2016) and low-carbon residential energy use (Baiocchi et al., Reference Baiocchi, Creutzig, Minx and Pichler2015). Data from many cities reveal some fundamental scaling laws that seem universal across cities, often related to their size (Bettencourt et al., Reference Bettencourt, Lobo, Helbing, Kühnert and West2007). Influential work on understanding cities as complex systems (McPhearson et al., Reference McPhearson, Haase, Kabisch and Gren2016 a; Alberti, McPhearson & Gonzalez, Reference Alberti, McPhearson and Gonzalez2018) using, for example, advanced statistics, fractal geometry or network theory, shows an empirically founded view on the nature of urban areas, adding more dimensions to the relationships described by urban economics theory (Batty, Reference Batty2008).
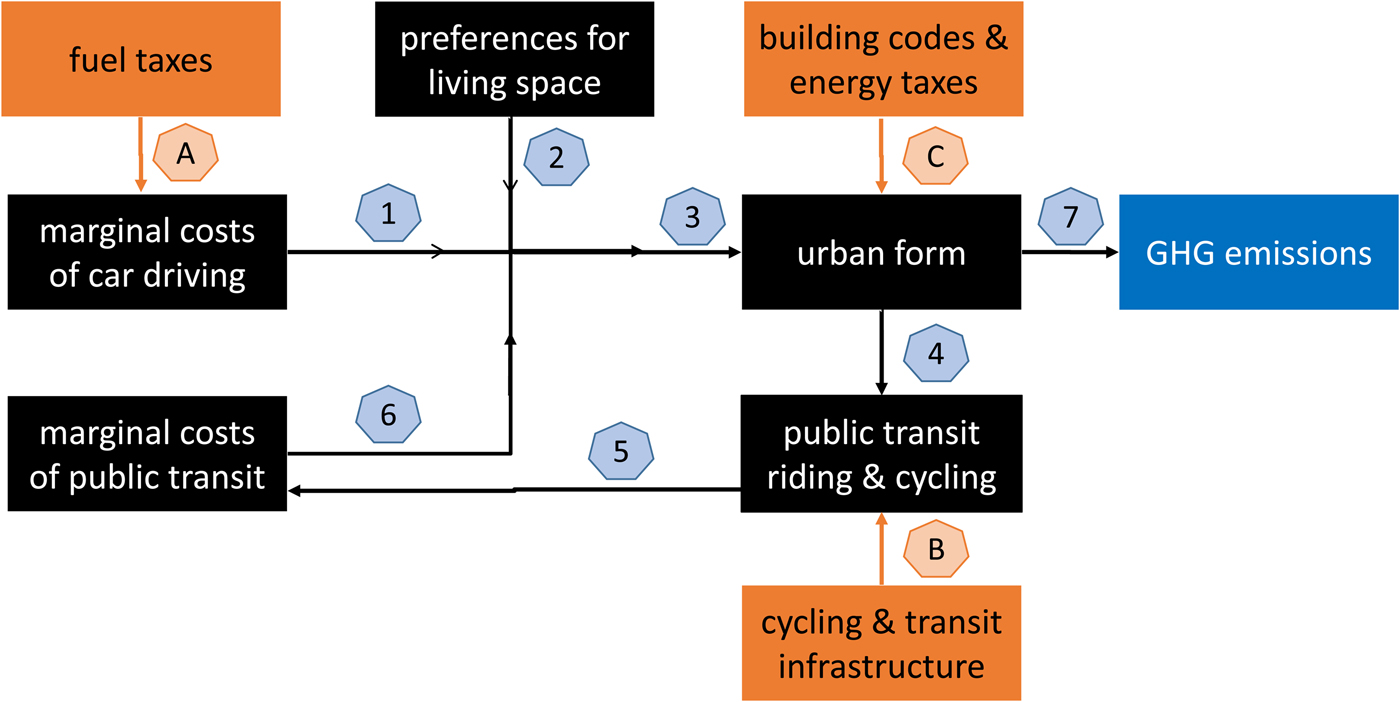
Fig. 6. An urban economic model explains the relationship between transport costs, infrastructures, urban form and resulting GHG emissions from both the transport and building sector. In the urban economic framework, marginal costs of car driving (1), together with available income and preferences for residential living spaces (2) shape the urban density profile and urban form (3). In turn, the urban density profile determines the accessibility of locations with low-emissions modes, such as cycling and public transit, and thus the ridership of these modes (4). In so far as infrastructure provision is a function of ridership density, this density-related dynamic factors into the marginal costs of public transit and cycling (including time costs) (5), which feeds back into urban form formation (6). Urban form is a crucial factor in determining urban transport emissions (the distance required to travel and the mode choices available), and in emissions from buildings (depending on density in building stocks) (7). Fuel taxes (A), transport infrastructures (B) and building codes (C) are all relevant policies reducing urban GHG emissions. However, fuel taxes and transport infrastructures are causally more relevant than building codes. Adapted from Creutzig (Reference Creutzig2014).
At the intersection between urban planning and computational urban economics, detailed land-use and transport models can capture system-wide emission effects of planning decisions over time (Echenique et al., Reference Echenique, Hargreaves, Mitchell and Namdeo2012). Such models are extremely promising but depend on rich data input from municipalities that are not available everywhere and are not easily tractable in terms of identifying key drivers. Similarly, urban econometric analysis can reveal unexpected effects. In the US, urban planning regulations correlate counterfactually to higher emissions: in cities with lax zoning regulations new city construction leads to low density development, and in hot climates there is an extra energy demand for cooling (Glaeser & Kahn, Reference Glaeser and Kahn2010).
2.4.3. Ex-post analysis of urban policies
Triggered by the slow progress in international climate policy over the last two decades, a significant number of bottom-up efforts lead by local governments in cities to combat climate change have emerged with thousands of local governments developing and implementing local climate action plans. Ex-post analysis could answer questions such as: what effect will the combined mitigation plans of the world's cities have on global GHG emissions? How well protected are city inhabitants against floods? What actions have been taken, and how effective have they been, to enhance adaptive capacity and reduce risks within a city? Which combination of city and non-city organizations need to be involved to effectively deliver a particular climate action in a given city?
But even as first case studies are emerging (Ottelin et al., Reference Ottelin, Heinonen and Junnila2018), little is known about the impact these measures have had on reducing emissions (Seto et al., Reference Seto, Dhakal, Bigio, Blanco, Delgado, Dewar, Lwasa, Edenhofer, Pichs-Madruga, Sokona, Farahani, Kadner and Minx2014; Minx, Reference Minx2017). This lack of knowledge is currently a direct barrier to learning about the effects and efficacy of local climate solutions. Hence, developing a body of literature that aims to understand what solutions work for whom under what conditions and why would fill an important information gap for policy makers and practitioners. Yet, conducting such analysis at the local scale is complex and littered by data challenges, even though various work already gathers urban data on sustainability policies. For example, Hawkins et al. (Reference Hawkins, Krause, Feiock and Curley2016), building on the Integrated City Sustainability Database (ICSD) (Feiock et al., Reference Feiock, Krause, Hawkins and Curley2014), analyse six explanations for local governments' motivation to commit to sustainability and find that local priorities, regional governance and participation in a sustainability network are strong factors in influencing communes towards sustainability policies.
Qualitative data is important for improving the understanding of adaptation and mitigation in cities. It is typically descriptive and often concerned with understanding behaviour, institutions and context, which have a strong impact upon climate impacts, vulnerability, and the effectiveness of adaptation and mitigation options (Bulkeley & Betsill, Reference Bulkeley and Betsill2005). Qualitative data often provide a depth of information not available from big data approaches described previously.
Analysis of urban adaptation and mitigation strategies in EU cities (Reckien et al., Reference Reckien, Flacke, Dawson, Heidrich, Olazabal, Foley and Hurtado2014) and specifically in those in the UK (Heidrich et al., Reference Heidrich, Dawson, Reckien and Walsh2013) highlighted that cities often use different baseline years, include different emissions in their accounts and cover different sectors within their strategies. They also often set reduction targets differently and describe policies or approaches to collecting data and information on cities to influence demand in different ways. Analysis of 627 climate actions in 100 cities revealed the heterogeneous mix of actors, settings, governance arrangements and technologies involved in the governance of climate change in cities in different parts of the world (Broto & Bulkeley, Reference Broto and Bulkeley2013). Along the same line, C40 highlighted a diversity of governance structures in 66 cities, which influence the levers available to city actors or other non-city actors to implement change (C40, 2015).
There are a wide range of approaches to reporting governance structure, policies, regulation, culture, institutions, adaptation and mitigation actions, and other factors relevant to climate action. The intra-urban and inter-urban variability of the quality, reliability and completeness of information is huge. The current lack of standardization of records, quality assurance and incomplete data availability poses a significant challenge for understanding climate risks, diagnosing GHG emission sources and assessing the effectiveness of climate action.
2.5. Integrated Urban Weather, Environment and Climate Services (IUWECS)
Polluted air, extreme weather conditions and other hazards create substantial challenges to cities in their role as centers of creativity and economic progress. Increasingly dense, complex and interdependent urban systems leave cities progressively more vulnerable, especially under climate change conditions. Even a single extreme event can lead to a widespread breakdown of a city's infrastructure often through domino effects (Grimmond et al., Reference Grimmond, Tang and Baklanov2014). The WMO's cross-cutting urban focus (WMO, 2018) supports implementation of the UN New Urban Agenda in particular through a novel approach of integrated urban weather, water, environment and climate services for sustainable development and multi-hazard early-warning systems for cities (Baklanov et al., Reference Baklanov, Grimmond, Carlson, Terblanche, Tang, Bouchet and Hovsepyan2018). This is aligned with a general push for multi-hazard early warning systems and a focus on forecasting the impacts of weather by the WMO (WMO, 2015).
Rapid urbanization necessitates new types of information systems in the form of Integrated Urban Weather, Environment and Climate Services (IUWECS), as brought forward by the WMO. These should assist cities in facing hazards as varied as storm surges, flooding, heat waves and air pollution episodes, especially in changing climates, while making the best use of science and technology and considering the challenge of delivering such services to members. The aim is to build services that meet the special needs of cities through a combination of dense observation networks, high-resolution forecasts, multi-hazard early warning systems, and climate services for mitigation and adaptation strategies that will enable the creation of resilient, thriving sustainable cities promoting the Sustainable Development Goals. These advanced information and predictions products should enable targeted climate information and prediction services, and underpin the development of accurate early-warning systems and integrated urban services for cities.
WMO has addressed the increasing demands of urban areas to improve their resilience to environmental, weather, climate and water related hazards, weather extremes and impacts brought about by climate change and variability, through the development of the Guide for Urban Integrated Hydrometeorological, Climate and Environmental Services (WMO, 2018). The focus of the Guide is to document and share the best available practices that will allow members to improve the resilience of urban areas to a great variety of hazards/disasters and help with long-term urban planning. The kind of services that will be required for the urban areas will be defined in consultation with the urban stakeholders and user community.
3. Building the data foundation for a Global Urban Sustainability Science
Urban data science has been compartmentalized for too long. Geography, geomatics, political science, urban planning, industrial ecology, urban economics and, most recently, computer science (with machine learning approaches on big urban data) are all being used to tackle various aspects of building and transport energy demand through data analysis and modelling. Industrial ecology provides frameworks for analysis that take into account indicators across disciplines and scales (Bai, Reference Bai2007 a). Geomatics provides data on urban extent and similar variables that are slowly taken up for global urbanization research (Seto et al., Reference Seto, Güneralp and Hutyra2012; Bren d'Amour et al., Reference Bren d'Amour, Reitsma, Baiocchi, Barthel, Güneralp, Erb and Seto2017; Güneralp et al., Reference Güneralp, Zhou, Ürge-Vorsatz, Gupta, Yu, Patel and Seto2017 a). In a paper published in Nature earlier this year, the Scientific Committee of the IPCC Cities and Climate Change Conference identified data and observation as one of the six research priorities for cities and climate change along with understanding climate interactions, studying informal settlements, disruptive technologies, enabling transformation and recognizing global sustainability context (Bai et al., Reference Bai, Dawson, Ürge-Vorsatz, Delgado, Barau, Dhakal, Dodman, Leonardsen, Masson-Delmotte, Roberts and Schultz2018 a). In working together across these disciplines, unforeseen co-benefit synergies, could be identified and trade-offs avoided to advance global sustainability. But urban research remains disparate, marginalized and ill-prepared to interact effectively with global policy (McPhearson et al., Reference McPhearson, Parnell, Simon, Gaffney, Elmqvist, Bai and Revi2016 b), leading inter alia the inaugural issue of Nature Sustainability to call for a Global Urban Science (Acuto et al., Reference Acuto, Parnell and Seto2018). Vocabulary is however inconsistent across disciplines and cross-citation, and more importantly, cross-fertilization between disciplines is still infrequent.
Here we attempt to bring the insight and approaches from different urban data sciences together, demonstrating that interdisciplinary research conveys the promise of extraordinary synergies, forming the quantitative foundation of Global Urban Sustainability Science (Figure 7).
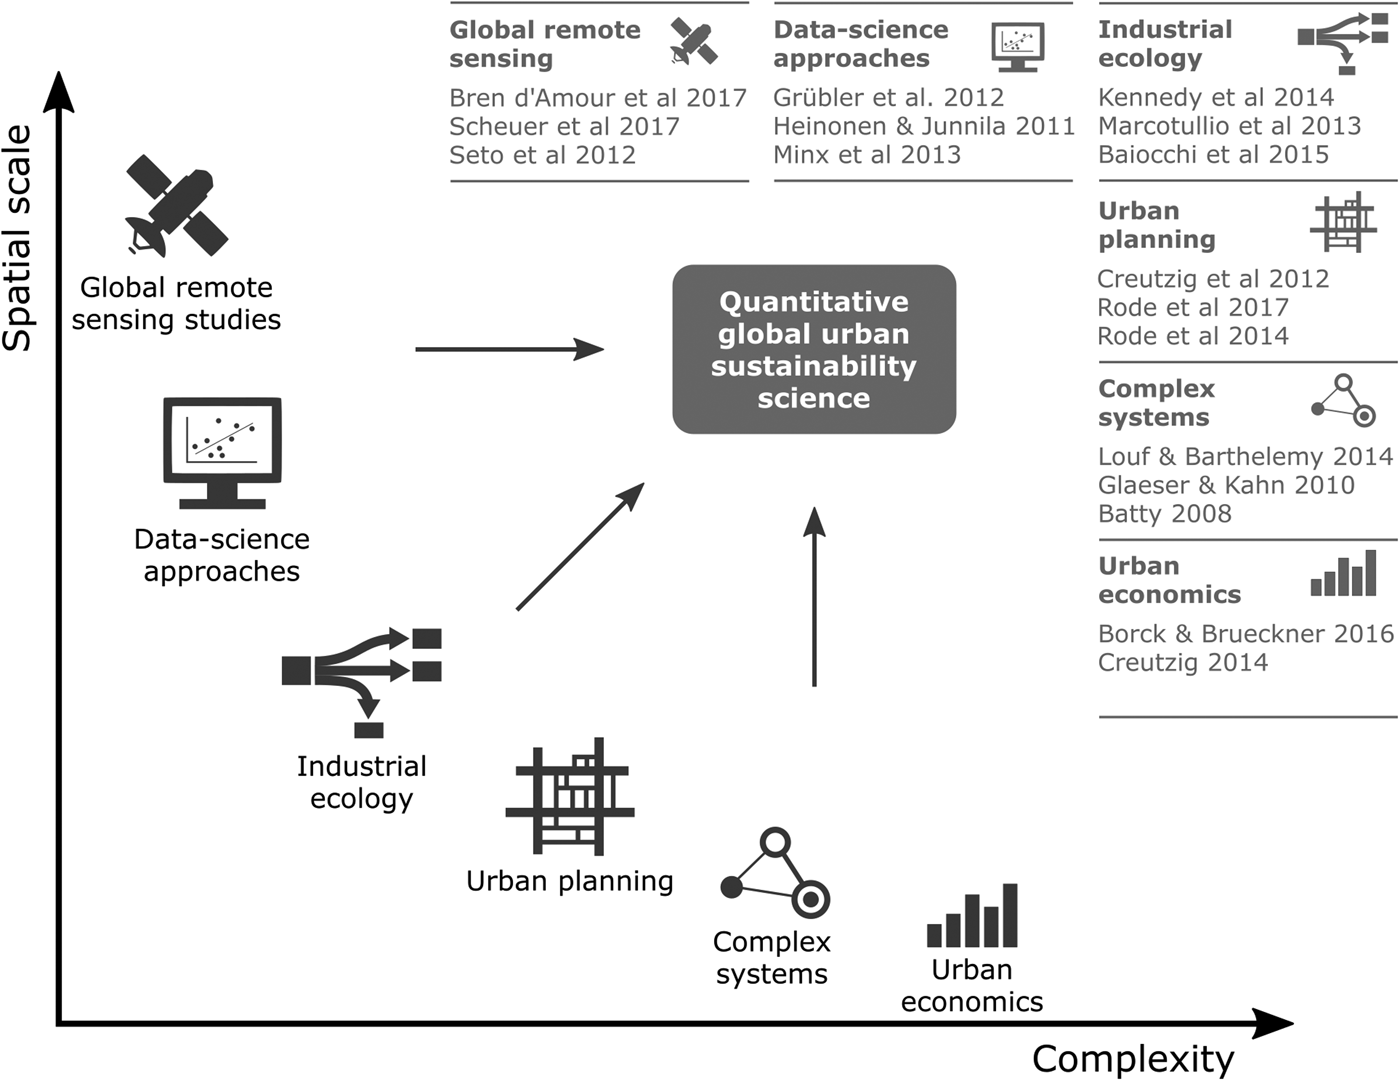
Fig. 7. Interdisciplinary efforts bringing data approaches from various epistemic communities together will provide the quantitative foundations for a globally applicable and consistent urban sustainability science. A multitude of disciplinary efforts tackles empirical and theoretical foundations relevant to quantify climate change issues in cities. Cross-disciplinary research becomes increasingly common, but only a strong joint effort will provide the quantitative foundations of Global Urban Sustainability Science. Some disciplines, such as geomatics and remote sensing studies provide globally consistent data, but not necessarily in metrics directly applicable to climate change issues. Other disciplines, such as industrial ecology, provide relevant metrics, but data gathering is insufficiently harmonized. Even other disciplines, such as theoretical economics developed theoretical explanations of how quantitative variables interact dynamically. Theoretical efforts can help the transformation of empirical variables into climate change relevant metrics; and in turn, empirical data can gauge the models and support the identification of relevant dynamics.
We envision a GUDP for comprehensive and harmonized urban data and methods that is available to urban decision-makers worldwide. This platform should have low transaction costs in knowledge exchange. Incentives should guarantee high level and quality of contributions from scientists and decision-makers alike. We suggest three specific goals:
1) Mainstreaming and harmonizing data collection in cities worldwide;
2) Exploiting big data to upscale solutions, e.g., on agent and/or building scale, while maintaining privacy; using high-resolution remote sensing data and social media data to automatize computation of first-order climate effects and solutions;
3) Using computational and data science methods to analyse published qualitative information, inclusive of case studies with a strong focus on inclusion of indigenous and local knowledge, for systematic understanding of first-order climate effects and solutions.
3.1. Mainstreaming and harmonizing urban data collection
Several attempts have been made so far to collect and present comparable data across cities to foster climate solutions. We present a few relevant examples, and identify their strengths and weaknesses.
• Metabolism of cities (metabolismofcities.org). Recent efforts to realize unified indicators for the study of urban metabolism have led to the creation of ‘Metabolism of Cities’, a collaborative platform and dataset that aims to connect researchers and practitioners (Metabolism of Cities, 2018) working with city data. The Metabolism of Cities project provides a data portal to assess the metabolism of cities, including electricity consumption, waste numbers and GHG emissions. The current data set contains data from 148 cities, with 465 total indicators and 8973 data points. Many of these data stem from Hoornweg et al. (Reference Hoornweg, Sugar and Trejos Gómez2011). Vienna and Brussels have an exceptional abundance of data points (above 1000), with 36 further cities featuring more than 10 data points each.
• WUDAPT (www.wudapt.org).The World Urban Database and Access Portal Tools (WUDAPT) is an international community-based initiative to acquire and disseminate climate relevant data on the physical geographies of cities for modelling and analyses purposes. The current lacuna of globally consistent information on cities is a major impediment to urban climate science for informing and developing climate mitigation and adaptation strategies at urban scales (Ching et al., Reference Ching, Mills, Bechtel, See, Feddema, Wang and Theeuwes2018). WUDAPT consists of a database and a portal system; its database is structured into a hierarchy representing different levels of detail and the data is acquired using innovative protocols that utilize crowdsourcing approaches, Geowiki tools, freely accessible data, and building typology archetypes. With the base level of information (Level 0, or L0), city landscapes are categorized and mapped into Local Climate Zones (LCZ), each category of which is associated with a range of values for model relevant surface descriptors (e.g., roughness, impervious surface cover, roof area, building heights, etc). L0 data and the protocol for acquisition, storage and dissemination is best developed and provides a framework for gathering other data. WUDAPT Levels 1 (L1) and 2 (L2) will provide values for other relevant descriptors at greater precision, such as data morphological forms, material composition data and energy usage.
• CDP (cdp.net/en/cities). The CDP Open Data Portal collects self-reported urban GHG emission data, and currently presents a global dataset based on city self-reported CO2 emissions for the period 1990–2016 for 187 cities in five geographic regions for 2016 and 229 cities for 2017 (153 overlap between the two years) (CDP, 2017 a). CDP reports units of CO2 equivalents correspond to different GHGs with different warming potentials for a standard 100-year time horizon. CDP issues consistent guidelines for reporting (CDP, 2017 b). Of reported emissions, 89% are from the period 2010–2015, including Scope 1 (direct fossil CO2 emissions from residential and industrial heating, transport, industrial sectors), Scope 2 (indirect CO2 emissions from the consumption of electricity and steam generated upstream from the city), and Total Emissions, nominally equal to the sum of Scope 1 and Scope 2. Cities also reported the change in emissions between the most recent and the preceding reporting periods, explanations for this change, methodology details and the gases included in the total emissions in CO2 equivalents. A detailed analysis of this data is in preparation (Nangini et al., Reference Nangini, Peregon, Ciais, Weddige, Vogel, Bréon and CreutzigIn Press).
• UCCRN (uccrn.org/resources/case-study). The urban climate change research network (UCCRN) built up a case study data base of more than 100 cities worldwide, covering topics such as vulnerability, hazards and impacts, mitigation and adaptation actions, and sector-specific themes, such as waste water and flood management.
• CEADS (ceads.net/). China Emission Accounts & Datasets (CEADS) provides up-to-date energy, emission and socioeconomic accounting inventories for China. Datasets published by CEADs are the results of research projects and data is free to download for academic usages. While most data are national or provincial, recent contributions add detail on city-level emissions in Chinese cities (Shan et al., Reference Shan, Guan, Liu, Mi, Liu, Liu and Zhang2017 a).
• The Atlas of Urban Expansion (http://atlasofurbanexpansion.org/). The Atlas of Urban Expansion (Atlas of Urban Expansion, 2018) is a joint project by UN-HABITAT, New York University (NYU) and the Lincoln Institute. It is the output of the first two phases of the Monitoring Global Expansion Program, an initiative that gathers data and evidence on cities worldwide, analysing quantitative and qualitative data on urban expansion in a stratified sample of 200 global cities. Their data is freely accessible from the website above, and an impressive collection of high-quality data that showcases urban growth dynamics and developments based on remote sensing. It is one of the most comprehensive databases of urban spatial data. Among others, the Atlas provides indicators representing the actual urban extent of a city, rather than describing its political or administrative boundaries. Data that applies to the actual urban extent overcomes one of the biggest hurdles in the analysis of urban spaces, but requires a detailed analysis for each individual city. For 30 cities, the historical growth has been mapped and visualized by use of both historical maps and satellite observations.
These exemplary efforts are extremely valuable and enrich our understanding of cities and climate change. The advantage of the CDP, CEADS and Metabolism of Cities projects is that they directly aim to gather GHG emission data. Their disadvantage is that there currently are inconsistencies in methodologies, often rendering interpretation and comparison difficult, as data are obtained from diverse sources. By contrast, the Atlas of Urban Expansion gathers consistent satellite and map-based data.
Further development of platforms for gathering data should build on initiatives such as the CDP, Metabolism of Cities and the Atlas of Urban Expansion, and be based on common protocols and standards, such as the Global Protocol for Communities. This would require data verification and gauging, as done for the CDP data (Nangini et al., Reference Nangini, Peregon, Ciais, Weddige, Vogel, Bréon and CreutzigIn Press).
Building a harmonized platform for global urban data would require combining existing data sources. A standardized tagging system for data sources can help to unify data that is already being collected. One way to build a global data platform is hence to link existing data via a unified, standardized tagging system, rather than duplicating efforts by collecting new data. Machine learning of meta-information, as outlined above, may be an efficient way to develop such a system.
This would also require financial efforts, leadership and willingness from municipal employees worldwide to invest time and resources for improving urban data availability. To overcome current bias in research and data availability, international aid should support cities in least developed countries, especially in smaller (<1 million) and quickly urbanizing municipalities and where informal settlements are abundant. Biases also need to be estimated and made explicit. Importantly, locally generated knowledge about climate issues is not only relevant and should be incorporated in data gathering efforts. It can serve as relevant a precondition for locally motivated action. Though remote sensing and other big data can help to generate consistent and harmonized data for all cities, capacity building to develop local data collection competencies is crucial for urban planning and policy design (Brković-Bajić, Reference Brković-Bajić2008).
3.2. Exploiting big data
Big data is already widely used, but neither remote sensing data, social media or other geolocalized data are used to their full potential in the context of cities (Ilieva & McPhearson, Reference Ilieva and McPhearson2018). Remote sensing data remain insufficiently integrated with other heterogeneous data sources, such as OpenStreetMaps, for example, and SMD remain often constrained to specific applications and cities. These constraints are sometimes due to privacy restrictions, etc. so unlocking and integrating some of this data may have to be done on a case by case basis to alleviate privacy concerns, working with the data holder on specific privacy restrictions. Table 1 lists the availability of data and approaches for different urban climate issues. It reveals that a large amount of data is already available. Much of this data could be exploited to automatize computation of first-order climate effects and solutions, and full integration is likely to lead to relevant synergies. Several methods that have been used at smaller scales and are highlighted below have begun to show some synergies and have high potential.
Table 1. Key urban climate issues and their state of data, a selection of data bases.
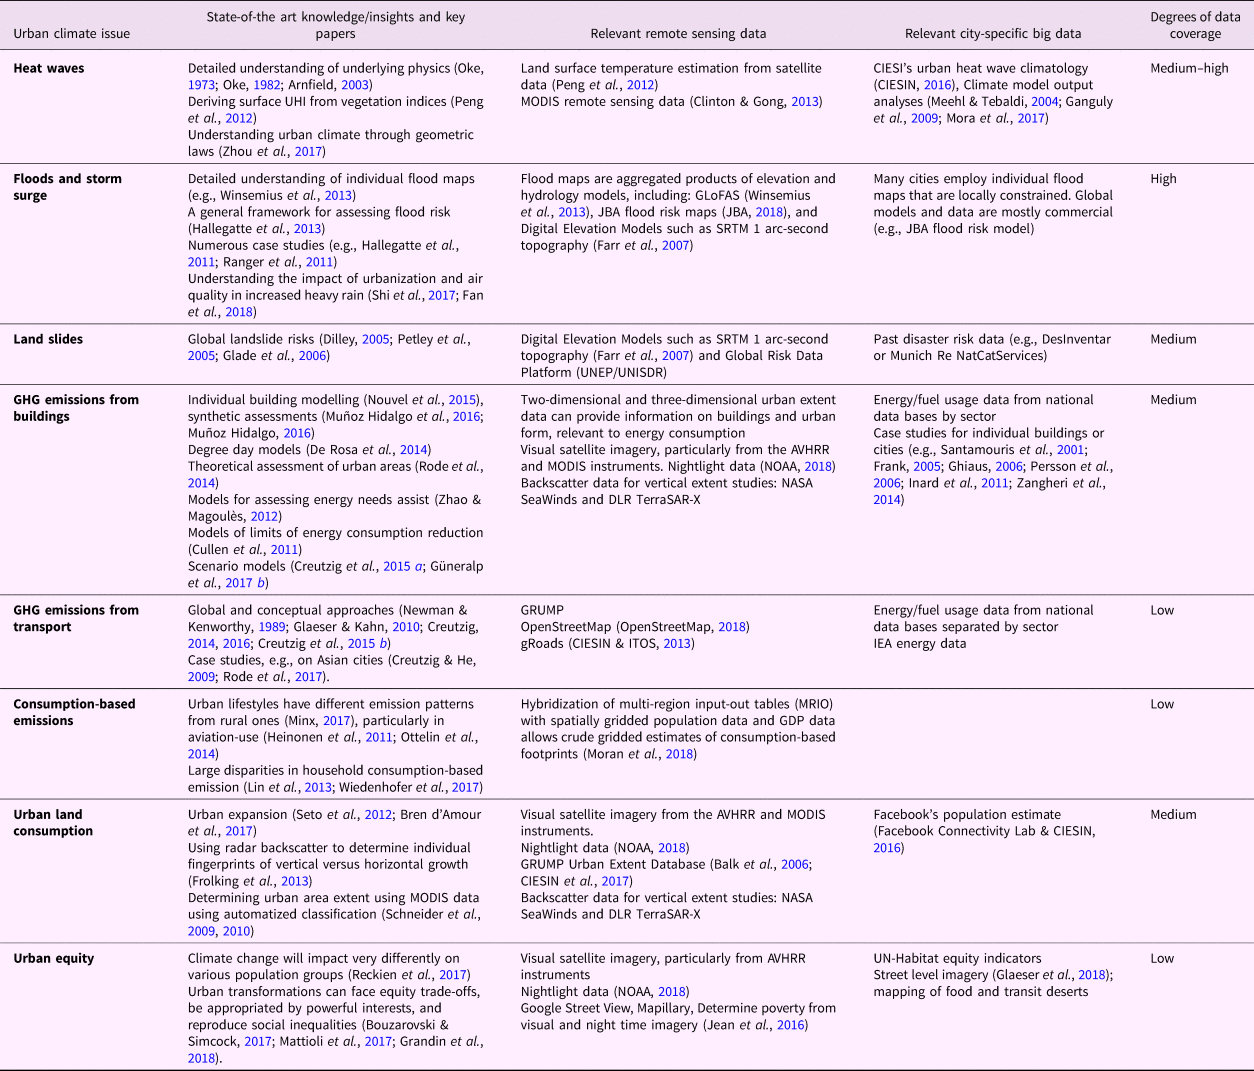
A first approach involves systematic city-wide data collection for the consistent application for multiple climate and sustainability related purposes, as tentatively attempted in Newcastle, where massive data are generated instantly, informing both climate mitigation and adaptation policies (Figure 4). Making big data part of urban policies will produce synergies for reaching different policy goals.
A second approach involves hybridization of data sources and collaboration across disciplines. The need for interoperability between SMD-based research and the work of many public and private organizations by means of intelligible units of analysis (Housley et al., Reference Housley, Procter, Edwards, Burnap, Williams, Sloan and Greenhill2014) and interdisciplinary approaches (Young, Reference Young2014) are common hurdles to big data scholarship. To pool the necessary competencies for climate and sustainability oriented SMD research, it would be key that researchers from different scientific disciplines – computer scientists, computational social scientists, linguists, geographers, urban climate modellers and urban ecologists, among others – join forces and work side by side as part of the same big data research collective (Stefanidis et al., Reference Stefanidis, Crooks and Radzikowski2013). To overcome the relatively slow-pace of urban systems research for addressing pressing, and in many cases, urgent problems faced by cities and urbanized regions (Harris, Reference Harris2012; McPhearson et al., Reference McPhearson, Parnell, Simon, Gaffney, Elmqvist, Bai and Revi2016 b), linking more traditional remotely sensed and local data with new emerging, crowd-sourced data and those working with these types of data is necessary. The training of high-resolution gridded and/or remote sensing data for predicting building or transport energy use in the city of Porto is a promising example combining different qualities of data (Silva et al., Reference Silva, Horta, Leal and Oliveira2017, Reference Silva, Leal, Oliveira and Horta2018). Approaches can also be applied to the transport sector. Street networks can be classified with simple hierarchical clustering, producing distinct street block fingerprints, which can in turn be used to produce a typology of cities (Louf & Barthelemy, Reference Louf and Barthelemy2014).
A third approach includes the upscaling of a specific method and data on agent or building scale from one specific city to national areas and beyond. Synthetic building stocks is an example of a high-resolution method used to investigate strategies for energy conversation in buildings. It matches synthetic building stock data to available cadastre data, providing a transferable and scalable method for assessing the energy use of buildings. The method is outlined in Box 4.
Box 4. Merging big spatial data with models to build synthetic building stocks
Datasets capturing the building stock of cities have become more widely available, collected either through crowd-sourced data (e.g., OpenStreetMap) or through the combination of official property (tax records) and cadastral data sets (geometrical information). Many cities are starting to develop 3D digital cadastre of their building stock at different levels of precision, used to compute heat/cooling demands of individual buildings (Nouvel et al., Reference Nouvel, Mastrucci, Leopold, Baume, Coors and Eicker2015). However, the precise geometry is mostly irrelevant for estimating energy demand (Kim et al., Reference Kim, Plessis, Hubert and Roux2014), and combining spatial data with other data supports the development of more accurate and complete energy demand models.
A novel modelling technique to achieve this goal involves the construction of a ‘synthetic building stock’, benchmarked to available small area census statistics which allows the user to match the synthetic building stock data to available cadastre data (Muñoz Hidalgo et al., Reference Muñoz Hidalgo2016) (Figure 8). This method maintains relevant geometrical information of cadastre data, but additionally imports information from the census or other national surveys (Muñoz Hidalgo et al., Reference Muñoz Hidalgo., Dochev, Seller and Peters2016) to be considered alongside the cadastre data. The main advantage of this method is its transferability and scalability. The model does not depend on local data availability or specific data formats, and a synthetic building stock can be generated at the national level (Muñoz Hidalgo, Reference Muñoz Hidalgo., Dochev, Seller and Peters2016).
The World Bank has successfully implemented this methodology for the estimation and mapping of poverty levels in Ecuador (Hentschel et al., Reference Hentschel, Lanjouw, Lanjouw and Poggi2000; Elbers et al., Reference Elbers, Lanjouw and Lanjouw2003) and UN Environment is currently working on the development of a Spatial Microsimulation Urban Metabolism (SMUM) model for the simulation and projection of resource flows of cities (Muñoz Hidalgo, Reference Muñoz Hidalgo2018). The SMUM model projects resource consumption based on official population projections, which is a standard practice for most statistical offices around the world and an important urban planning tool. Data sets required for the projection of populations (population census or registers) are available for 83% of the global population (UN-DESA, 2016), making these the ideal based input data for cities around the globe. Projections of the buildings stock serve the estimation of future resource consumption of cities. The projections are simulated under a business-as-usual scenario, as well as under transition scenarios.
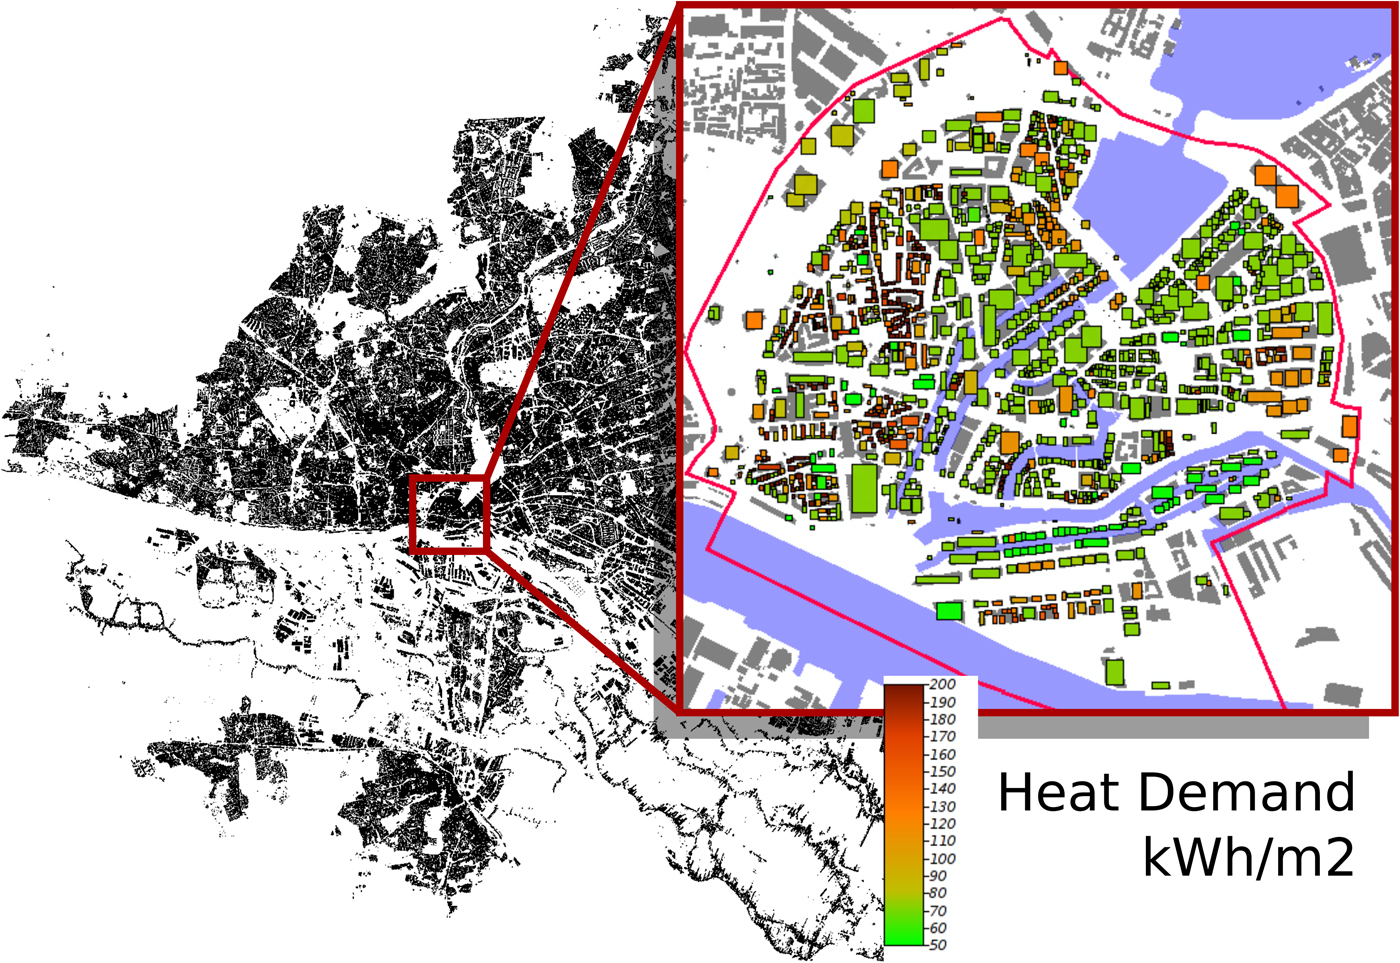
Fig. 8. Estimated heat demand with a synthetic building stock based on 3D cadastre data and synthetic families based on census data. Source: Muñoz Hidalgo et al. (Reference Muñoz Hidalgo2016).
3.3. Analyse published qualitative data for systematic review of first-order climate effects and solutions
Data science should also make use of the data and insights previously published, particularly qualitative data. The literature on climate change is growing exponentially (Minx et al., Reference Minx, Callaghan, Lamb, Garard and Edenhofer2017) and thousands of new articles on urban climate solutions appear annually (Lamb et al., Reference Lamb, Callaghan, Creutzig, Khosla and Minx2018). As this volume of work is quickly becoming unmanageable for individuals to track, bibliometric methods and systematic review techniques are needed to identify, extract and synthesize relevant information. In principle, this may follow similar procedures to those found in data science, that is, gathering, validation, extraction and consolidation (Figure 9).
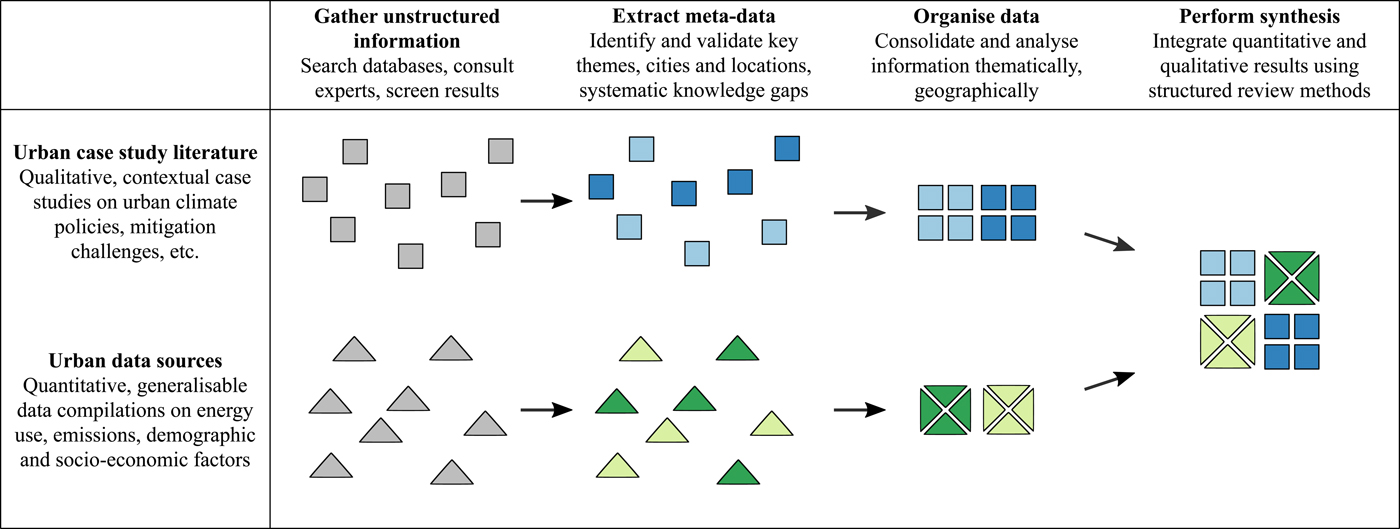
Fig. 9. A parallelized and synergetic processing of data and case study literature, for example, with bibliometric methods and systematic reviews, has the potential to synthesize available information at large scale and help upscaling urban data to a global urban science.
Systematic reviews begin with a literature database search, on platforms such as the Web of Science, Scopus or Google Scholar. Depending on the scope of the intended review, keyword searches will return hundreds or thousands of results. However, the attained bibliometric data – titles, abstracts, keywords and references – can already provide significant insight into literature structure and content: (1) epistemic communities can be inferred from citation patterns; (2) thematic content can be identified using natural language processing; (3) case study locations can be extracted from titles and abstracts using a database of urban location names. Lamb et al. (Reference Lamb, Callaghan, Creutzig, Khosla and Minx2018) demonstrate (1) and (2) for the literature on urban demand-side mitigation policies. They identify, for instance, a considerable body of work on concrete multi-objective policies that consider climate mitigation only as a secondary issue, such as parking management and congestion charging (Figure 10).
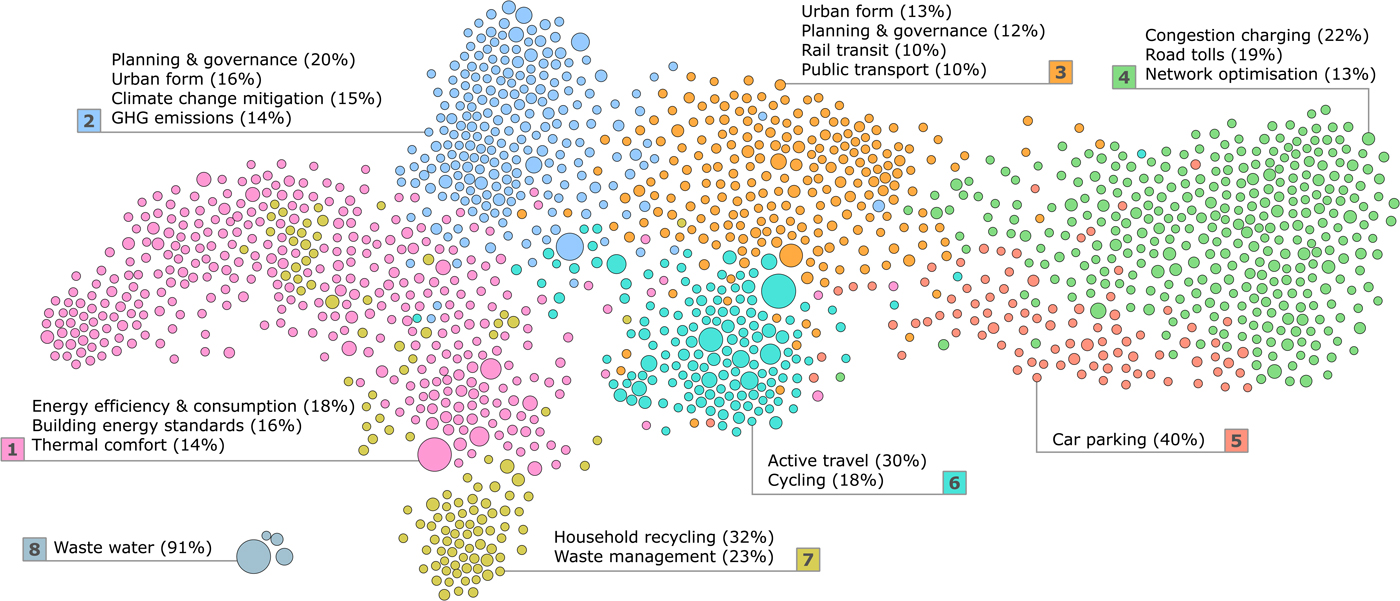
Fig. 10. Bibliographic coupling network of urban mitigation topics. Nodes represent articles (scaled by total citations), edges represent a coupled citation (two nodes citing the same third article). A total of 1500 nodes are shown, with a minimum threshold of five coupled citations. Clusters are identified with a community detection algorithm, then compared to the topic model to identify distinct epistemic communities. Source: Lamb et al. (Reference Lamb, Callaghan, Creutzig, Khosla and Minx2018).
As prior steps to an assessment of the urban literature, these analyses put forth foundational questions: who is researching what topics, on which cities? The full potential of such an approach is found in combination with data-science approaches (Figure 9). Data-science can reveal the structural similarities between cities, generate typologies and identify salient issues that are shared across contexts. By contrast, the urban literature is often highly contextualized and it is difficult to generalize case studies. A combination of approaches – for example, systematic reviews of the case study literature across cities of a particular type, focused reviews on specific policies across multiple (quantitatively expressed) contexts – suggests a route to overcome the current impasse in comparative urban research and case study review methods (Scott & Storper, Reference Scott and Storper2015; Steinberg, Reference Steinberg2015), while bearing the promise of systematic learning and horizontal knowledge exchange between cities.
With state-of-the-art computational tools, even contextual analysis of qualitative data can be automatized. For example, a textual analysis of CDP qualitative data with machine learning methods identifies the transport sector as a focal point for emission reduction policies (Madu et al., Reference Madu, Kuei and Lee2017).
Local non-textual knowledge and narratives provide strong complementary information to scientific study both on climate impact and social response dynamics (Alexander et al., Reference Alexander, Bynum, Johnson, King, Mustonen, Neofotis and Weeks2011). Following Corburn (Reference Corburn2003), local knowledge can improve urban planning in four ways (1) epistemology, adding to the knowledge base of climate policy; (2) procedural democracy, including new and previously silenced voices; (3) effectiveness, providing low-cost policy solutions; and (4) distributive justice, highlighting inequitable distributions of climate impact.
Non-textual traditional knowledge is inherently challenging to capture, and can at best be understood by dedicated and case-specific ethnographic research (e.g., Boyd et al., Reference Boyd, Ensor, Broto and Juhola2014). Comparative analysis of case studies enables a more systematic understanding of non-quantitative outcomes of policies and power dynamics, tentatively bridging the gap between place-specific insights and global dynamics (Creutzig et al., Reference Creutzig, Corbera, Bolwig and Hunsberger2013). Meta-analysis and systematic reviews of ethnographic and human geography research has a larger role to play to better represent at least some dimensions of local knowledge and narratives.
Conferences and scientific events will profit from inclusion of local and indigenous groups speaking on climate challenges, as for example aspired in the CitiesIPCC conference in Edmonton, 2018, where the pre-conference afternoon session was titled ‘A Village of Hope’ and was presented by indigenous knowledge holders. Such events will not only directly help to better integrate local knowledge into scientific discourses, but also serve the purpose by bilateral inspiration for research and action.
4. Designing the global urban data platform
Cities around the world face manifold challenges. Here, we review the state of data relevant for cities to both foster climate change adaptation and mitigation, demonstrating contributions from urban metabolism, urban economics, remote sensing studies, big data sciences and urban climate modelling to rapidly increasing data-based understanding on cities. Resulting data is increasingly collected in central data portals accessible to researchers, practitioners and the general public, and we propose that the collection of urban data be mainstreamed to elucidate undetected synergies through a new GUDP, comprising harmonized and upscaled data gathering and comparison efforts, the systematic application of remote sensing, social media and other big data, and the performance of systematic reviews and as much as is technically possible (technological advancement could also be built into future systems) meta-analysis, integrating qualitative data, narratives and local knowledge. Though teams of researchers are putting increasing effort into building up this information, the GUDP would dramatically facilitate exchange of information and accelerate knowledge accumulation by storing and managing the data in a single hub.
The global urban data platform will not solve the open system challenges central to urban studies. However, GUDP will help upscaling urban climate solutions by facilitating the availability of relevant underlying data, by providing new sources of data enabling comparative learning between cities, and by making best use of combined but diverse disciplinary expertise.
The best design for such a platform is unclear. Here, we suggest that institutions such as Future Earth, the Global Carbon Project, ICLEI, CDP, IG3IS, IUWECS, WUDAPT and C40 are all well positioned to play a role in its development, and that a platform co-designed by these entities would lead to synergies and increase functionality. These organizations and others could come together and form a scientific steering committee responsible for creating and curating the joint platform, organizing annual meetings, and by financing a data analyst to support the committee that brings data together and analyses them, in addition to efforts of research teams. Annual data publications, inspired by the annual Global Carbon Budget publications of the Global Carbon Project, could serve as academic focal points, stimulating the contribution of researchers.
Financing of the global urban data platform is a crucial issue. While private proprietary data efforts are emerging, it would be important to create the GUDP in the public domain. The UN umbrella is an obvious candidate for hosting the data platform, and specifically organizations such as UN-HABITAT, UNDP or the World Bank could accept responsibility for GUDP. GUDP could also take a role in monitoring and evaluating sustainable development goals, especially but not only SDG 11 on cities. Importantly, some open data bases, such as WUDAPT, already exist, and hence, GUDP can possibly focus on coordinating existing data bases, and building interfaces between them.
Municipal policy makers and administrations could be incentivized by high visibility of their cities on the GUDP. Prizes for both urban data gathering and commendable urban climate policies could further motivate urban participation and also increase the profile of climate staff within municipal administrations.
This is a critical phase for global urban sustainability science, establishment of a global urban data platform will enable it to rapidly accelerate progress and support ambitions from policy makers and civil society. The urgency for the need for such a unifying platform becomes increasingly clear as urban contributions to climate mitigation and adaptation become more significant. Increasing data availability enables the common quantitative foundations needed to address climate change challenges. They may not be the only ingredient needed for mitigation efforts to take place, but an important one. We are optimistic, not only for Manhattan and Berlin, but also for everywhere else.
Author ORCIDs
Felix Creutzig, 0000-0002-5710-3348; William F. Lamb 0000-0003-3273-7878
Acknowledgments
Material for this paper was prepared for, and presented at a special session of, the IPCC Cities and Climate Change Conference, 5–7th March 2018. T.M.’s participation was supported by the Urban Resilience to Extreme Weather-Related Events Sustainability Research Network (URExSRN; NSF grant no. SES 1444755).
Author contributions
F. C. designed the paper. F. C. and S. L. performed the literature review and wrote significant parts of the paper. X. B., A. B., R. D., S. D., W. F. L., T. M., J. M., E. M. and B. W. all wrote sections of the paper. All authors edited the paper.
Financial support
None.
Conflict of interest
None.
Ethical standards
This research and article complies with Global Sustainability's publishing ethics guidelines.


 Open access