


1. Introduction
Some breeding populations are characterized by large full-sib family groups. This includes many aquaculture species, such as Atlantic salmon, shrimp and abalone (e.g. Kube et al., Reference Kube, Appleyard and Elliot2007). In a number of outcrossing plant species, the breeding population can have a similar structure, for example perennial rye grass and white clover (e.g. Woodfield & Caradus, Reference Woodfield and Caradus1994).
The cost of DNA marker discovery is falling rapidly with new sequencing technologies and in silico approaches, particularly for single nucleotide polymorphisms (SNPs) (e.g. Cogan et al., Reference Cogan, Drayton, Ponting, Vecchies, Bannan, Sawbridge, Smith, Spangenberg and Forster2007; Hayes et al., Reference Hayes, Lærdahl, Lien, Moen, Davidson, Koop, Adzhubei, Hindar and Høyheim2007; Wheeler et al., Reference Wheeler, Srinivasan, Egholm, Shen, Chen, McGuire, He, Chen, Makhijani, Roth, Gomes, Tartaro, Niazi, Turcotte, Irzyk, Lupski, Chinault, Song, Liu, Yuan, Nazareth, Qin, Muzny, Margulies, Weinstock, Gibbs and Rothberg2008). As more markers become available in aquaculture and outcrossing plant species, the prospect of using such markers in genome wide association (GWA) studies to discover quantitative trait loci (QTLs) affecting economic traits becomes more attractive. However, the large full-sib family structure in these populations poses a unique challenge, namely how to deal with the high level of stratification inherent in such populations? Population stratification has been demonstrated to be a major cause of false positive results in GWA if this is not accounted for (e.g. Pritchard & Rosenberg, Reference Pritchard and Rosenberg1999).
In this paper, we investigate a number of selective genotyping strategies for sampling individuals from populations comprised of large full-sib families for GWA. We investigate the power and precision of the strategies, as well as their false discovery rates.
2. Materials and methods
We first simulated a population of N e=1000 individuals with random mating for 6000 generations. Each individual in the population consisted of a 29 pairs of chromosomes, and was either male or female with probability 0·5. Each chromosome was 1 M long, and had 525 evenly spaced marker loci. To create an offspring, a male and a female parent were randomly chosen from the population. For each parent in a mating pair, a gamete was formed from its chromosome pairs by sampling the number of crossovers for each chromosome pair from a Poisson distribution, with mean of 1. Crossover points were randomly positioned along chromosome pairs according to a (discrete) uniform distribution on the chromosome. The haploid gametes were mutated at a rate that resulted in an expected marker heterozygosity of 0·32 at mutation drift equilibrium. The mutation rate was adjusted to ensure this heterozygosity using the formula u=H/4N e, where H was the desired heterozygosity (0·32) and N e was the effective population size simulated. A check of marker heterozygosity in generation 6000 verified mutation drift equilibrium was achieved. In generation 6001, 150 males and 300 females were chosen at random from the population. Each male was mated to two females, and each mating produced 100 offspring, to give a total population of 30 000 individuals.
We simulated production data for all individuals in generation 6001 with a mean of zero and a phenotypic variance (σ2P)=1. Phenotypes included an additive QTL effect (α), and a polygenic and environmental component. A single SNP was chosen at random to be a surrogate QTL. Then the QTL effect (α) was determined according to the QTL allele frequency (p) so as to maintain a constant QTL variance (σ2qtl), at 0·1, 0·05 or 0·025, following the additive variance relationship with allele frequency (p) σ2qtl=2p(1−p) α2. The SNPs chosen to be surrogate QTLs were excluded from the genotypes used to map the QTL. The environmental variance (σ2E) from which the environmental effects were sampled was fixed at 0·8.
The polygenic variance (σ2PG) from which polygenic effects were sampled was set to maintain a constant total genetic variance of 20% of the phenotypic variance, σ2PG=σ2P−(σ2qtl+σ2E). The polygenic effect was then sampled from N(0, σ2PG) for the sires and dams of the individuals in generation 6001 (normally distributed with a mean of 0 and variance=σ2PG), and their offspring in generation 6001 inherited half the breeding value from each parent, plus a Mendelian sampling term. The simulations were repeated with the same marker genotypes with 25 different QTL locations.
We assumed that 360 individuals from generation 6001 could be genotyped for GWA. Six strategies for selecting these individuals were tested; RAND, 360 individuals were randomly sampled from the population; HILO, the 180 individuals with the largest phenotype and the 180 individuals with the smallest phenotype across the entire population were selected; HILOWF30, 30 full-sib families were selected at random from the 300, and within each of full-sib family the six individuals with the largest phenotype and the six individuals with the smallest phenotype were genotyped; HILOWF60, 60 full-sib families were selected at random from the 300, and within each of these full-sib families the three individuals with the largest phenotype and the three individuals with the smallest phenotype were genotyped; RANDWF, 60 families were selected at random, and six individuals were randomly chosen within the families; MAXV30, the 30 families with the maximum within-family phenotypic variance were chosen, then the highest and lowest six individuals within each family were genotyped; MAXV60, 60 families with maximum within family phenotypic variance chosen, highest and lowest three individuals within each family (e.g. Hayes et al., Reference Hayes, Gjuvsland and Omholt2006).
For the individuals selected by each strategy, the model fitted to the phenotypes for each SNP in turn, was yi=μ+ai+bxi+ei, where ai is a polygenic breeding value, and a~N(0,AσA2), with A being a matrix of additive genetic relationships among the individuals in the population, σ2A is the additive genetic variance, b is the effect of the SNP and xi is the genotype of the SNP for individual i, e.g. 0 if the genotype is 11, 1 if the genotype is 12 and 2 if the genotype is 22, and ei is a random normal deviate. The significance level was P<0·001. The polygenic term was included in the model as inclusion of the polygenic term has previously been suggested as a mechanism to control false positives due to family structure (MacLeod et al., Reference MacLeod, Hayes, Savin, Chamberlain, McPartlan and Goddard2009).
3. Results and discussion
The number of false discoveries from RAND, and to a lesser extent HILO, strategies were much greater than that from the other strategies, and was almost twice than that expected by chance (Fig. 1). Inflated false discovery rates have previously been observed with selective genotyping (Macleod et al., Reference MacLeod, Hayes, Savin, Chamberlain, McPartlan and Goddard2009). All other strategies had low to moderate rates of false discovery. The number of false discoveries from RANDWF were considerably less than that from RAND.

Fig. 1. Number of false discoveries at P<0·001 from the strategies with QTL explaining 10, 5 or 2·5% of the phenotypic variance. Markers within 100 positions (20 cM) on either side of the QTL were not considered.
When the QTL explained 10% or 5% of the phenotypic variance, the power of the HILO, MAXV30 and MAXV60 strategies were similar and considerably higher than the HILOWF30 or HILOWF60 strategies (Fig. 2). When the QTL explained 2·5% of the phenotypic variance, the power of the MAXV strategies was somewhat reduced relative to the HILO strategy. Power from the RAND and RANDWF strategies were both low, but increased as the proportion of variance explained by the QTL increased.

Fig. 2. Power of alternative strategies to detect QTL. A QTL was considered to be detected in a replicate if the SNP with the lowest P value was within ±2 cM of the QTL. Power was defined as the proportion of (25) replicates in which the QTL was detected.
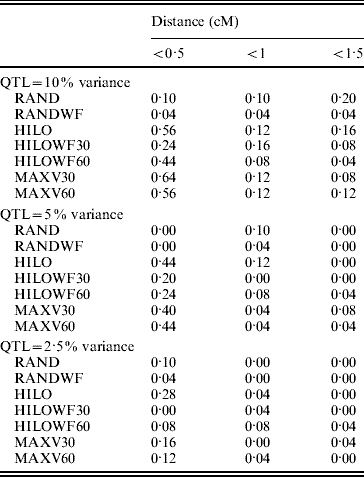
The MAXV30, MAXV60 and HILO strategies gave the most precise locations of the QTL (Table 1). As the proportion of variance explained by the QTL fell, precision was reduced. The power of the MAXV strategies is likely to be dependent on family size – the larger the family size the more power there will be to correctly choose the families with QTL segregating for genotyping. However, the families can be much smaller than simulated here for MAXV to still have an advantage. Hayes et al. (Reference Hayes, Gjuvsland and Omholt2006) demonstrated an increase in power with MAXV over other strategies, in QTL mapping experiments using both linkage and linkage disequilibrium, when full-sib family size was as low as 10.
Table 1. Precision of QTL location. Values in the table show the proportion of replicates in which the most significant SNP is a given distance from the QTL
The low numbers of false discoveries from the HILOWF and MAXV strategies clearly demonstrate that balancing the contribution of families across high and low phenotypes can reduce rates of false discovery in GWA when populations are composed of large full-sib families. For both the RAND and the HILO strategy, the highly skewed representation of families in the individuals sampled for genotyping led to very poor estimates of the genetic variance. As a result much of the genetic variance was erroneously attributed to the SNPs, leading to the high rate of false discoveries. By choosing at least six individuals per family, as in the RANDWF strategy, the false positive rate was reduced. Another option would be to use an estimate of the genetic variance from another experiment. When we fixed the genetic variance at its true value in the analysis, the number of false positive results from the RAND strategy was reduced to 23, 15 and 13 when the QTL explained 10, 5 and 2·5% of the phenotypic variance respectively (close to the numbers of false positives expected by chance). The RAND strategy with a fixed genetic variance gave similar results for power to detect the QTL to RAND.
Another possibility to control false discoveries due to not-missing at random data is to include all the phenotypes in the analysis, including those for non-genotyped animals. This requires some strategy for imputing or estimating the genotypes of missing animals. In the populations we are dealing with here, which consist of large full-sib families, this could involve genotyping the parents and estimating the genotypes of their un-genotyped progeny as the average of the parental alleles. In the absence of parental genotypes, the strategy suggested by Foulley et al. (Reference Foulley, Gianola and Planchenault1987) could be used to derive probabilities that an individual is the offspring of a particular sire and dam. However, the advantage of reduction in false discovery rate due to inclusion of all phenotypes would have to be balanced against the large computational cost incurred in such an analysis.
The power and precision of the strategies described here will reflect the level of linkage disequilibrium between the markers and the QTL in the simulation. The level of linkage disequilibrium in turn reflects the effective population size. We simulated an N e of 1000, with a marker density of 1 marker per 0·2 cM. This gave an average r 2 between the markers, or between the markers and surrogate QTL, of 0·12, close to the expected value of 1/(4N ec+1)=0·11 (Sved, Reference Sved1971). Luo (Reference Luo1998) demonstrated the dependence of the power of GWA on the level of r 2 between markers and QTL. If effective population sizes of aquaculture or plant species are much larger than those simulated here, the power of experiments will be reduced relative to our results. The breeding programs for Atlantic salmon in Norway use approximately 150 males and 300 males each year, which would give an N e of (4N mN f/N m+N f)=400, which is less than simulated here. However, the extent of linkage disequilibrium at short genetic distances is likely to reflect historic population size rather than recent population size (Hayes et al., Reference Hayes, Visscher, McPartlan and Goddard2003). The historic population size in Atlantic salmon should be similar to that in the wild population as Atlantic salmon have been domesticated relatively recently. Palstra et al. (Reference Palstra, O'Connell and Ruzzante2009) gave estimates of N e for wild Atlantic salmon returning to spawn in different regions of Newfoundland between 331 and 2097 depending on spawning location and method used to calculate N e. This suggests the N e we used in the simulation of 1000 may be appropriate for Atlantic salmon at least. The past and recent N e of other aquaculture species will be dependent on population history.
In outbreeding plant species, the N e may be much larger than we simulated, leading to a very limited extent of linkage disequilibrium. For example in cultivars of perennial rye grass, Ponting et al. (Reference Ponting, Drayton, Cogan, Dobrowolski, Spangenberg, Smith and Forster2007) found that marker–marker linkage disequilibrium decayed to r 2 values of 0·2 between 500 and 3000 bp. In such species, very high marker densities will be required for powerful GWA.
Nevertheless, provided marker density is adequate, the power and precision of the MAXV strategies demonstrate that successful GWA can be conducted in such populations by sampling only a fraction of the population. The strategies described here should also be useful for reducing rates of false discovery in DNA pooling experiments.


