


1. Introduction
The force of gravity acts on all living things. Gravity provides organisms with cues as to their position in space, and all organisms move and orient themselves in response to this gravitational force. For example, plants can direct their growth in response to gravity: their roots grow in the same direction as the gravity vector, and their shoots grow in the opposite direction to the gravity vector, towards sunlight. Also, aquatic animals sense gravity to orient themselves in water. This directed movement in response to gravity is known as gravitaxis (geotaxis).
Most animals and plants have specialized organs that sense the gravitational force and signal the organism to respond accordingly. While much is known about the structure of these gravity-sensing organs, less is understood about the genetic and molecular mechanisms underlying the sensation of, and behavioural response to, gravitational force.
Drosophila melanogaster is an excellent model organism to study the genetic basis of behavioural response to gravity. Drosophila are easy to maintain, and there are a wide array of tools available for genetic manipulation. Adult fruitflies exhibit walking behaviour in response to gravity: walking up, or away from gravity, is negative gravitaxis, whereas walking down, or towards gravity, is positive gravitaxis. Drosophila adults also exhibit negative gravitaxis (walk upward) when startled. In a gravitaxis maze, Drosophila are forced to move either up or down at each choice point in order to move through the maze. The number of up or down choices in the gravitaxis maze is used to quantify the response to gravity.
Early studies on the genetic analysis of Drosophila gravitaxis are almost 50 years old. Gravitaxis was used by Erlenmeyer-Kimling & Hirsch (Reference Erlenmeyer-Kimling and Hirsch1961) to demonstrate that a behavioural phenotype can be analysed genetically. They selected for high and low gravitaxis lines and then analysed the contributions of the various chromosomes to differences in gravitaxis behaviour (Erlenmeyer-Kimling & Hirsch, Reference Erlenmeyer-Kimling and Hirsch1961). Their results showed that these differences in gravitaxis were polygenic and were distributed on the X, second and third chromosomes. Interestingly, the X and second chromosomes contributed to positive gravitaxis, whereas the third chromosomes contributed to negative gravitaxis (Hirsch & Erlenmeyer-Kimling, Reference Hirsch and Erlenmeyer-Kimling1962; Bourguet et al., Reference Bourguet, Gair, Mattice and Whitlock2003).
Many years later, a microarray study by Toma et al. (Reference Toma, White, Hirsch and Greenspan2002) identified approximately 250 genes that showed expression differences between Hirsch's positive and negative lines. Further investigation revealed that three genes affected gravitaxis behaviour: Pigment-dispersing factor (Pdf), Pendulin (Pen) and cryptochrome (cry). Pdf and cry also affect the circadian rhythm (Nitabach & Taghert, Reference Nitabach and Taghert2008). Interestingly, Mertens et al. (Reference Mertens, Vandingenen, Johnson, Shafer, Li, Trigg, De Loof, Schoofs and Taghert2005) showed that the Pigment-dispersing factor receptor (Pdfr) also influenced both circadian and gravitaxis behaviours. Finally, Armstrong et al. (Reference Armstrong, Texada, Munjaal, Baker and Beckingham2006) identified yuri as a candidate gene for gravitaxis behaviour through a forward genetic screen. Interestingly, yuri is located very close to Adh, a gene that mapped close to the difference in gravitaxis between Hirsch's artificially selected lines (Stoltenberg & Hirsch, Reference Stoltenberg and Hirsch1996).
Gravitaxis appears to be a complex behaviour under the regulation of many genes. Quantitative trait locus (QTL) mapping is a common and effective strategy used for the genetic analysis of behavioural traits (Mackay, Reference Mackay2001). QTL mapping uses natural allelic variation to identify genomic regions influencing behaviour (Moehring & Mackay, Reference Moehring and Mackay2004; Jordan et al., Reference Jordan, Morgan and Mackay2006; Riedl et al., Reference Riedl, Riedl, Mackay and Sokolowski2007; Bailey et al., Reference Bailey, Grabowski-Boase, Steffy, Wiltshire, Churchill and Tarantino2008). Candidate genes within these QTL regions are then assayed using quantitative complementation (Anholt & Mackay, Reference Anholt and Mackay2004).
We used QTL mapping in D. melanogaster to identify significant QTLs for gravitaxis behaviour tested in vertical choice mazes. We screened 88 recombinant inbred (RI) lines that exhibit natural variation in gravitaxis behaviour. Four significant QTLs affecting this phenotype were identified, and we further dissected the QTL region with the highest significance. Candidate genes were selected from this QTL region based on their expression in the chordotonal organ, a structure thought to play a role in gravitaxis in flies. Quantitative complementation allowed us to map the skittles gene to this QTL.
2. Materials and methods
(i) Strains
All strains and crosses were maintained on a standard yeast–sucrose–agar medium at 25°C in a 12 h light:12 h dark cycle with lights on at 08·00 h.
(a) RI lines
The RI lines used are described in Nuzhdin et al. (Reference Nuzhdin, Pasyukova, Zeng and Mackay1997). The RI lines were derived from two unrelated parental lines (Oregon R and 2b), each containing multiple roo transposable element insertions distributed throughout the genome. Briefly, the parental lines were crossed and the F1 progeny were backcrossed to 2b. The progeny of the backcross were then randomly mated for four generations. At the fifth generation, individual pairs were mated, and their progeny underwent 25 generations of full-sib mating. All lines were subsequently maintained by small mass matings of 20 pairs of flies per line per generation. Finally, ten additional generations of mass matings within each line produced the final isogenic RI lines.
Each RI line has a unique combination of the ancestral roo transposable element insertions. The presence or absence of these elements in the RI lines indicates the parental origin of the corresponding chromosomal region. The cytological insertion sites of 92 roo transposable elements were scored for five individuals per line (Nuzhdin et al., Reference Nuzhdin, Pasyukova, Zeng and Mackay1997). Most lines were homozygous for all markers, but there was some residual heterozygosity for some markers in several lines. Heterozygous markers were considered missing data in subsequent analyses. The recombination frequencies between pairs of roo elements were estimated using a Kosambi mapping function (Gurganus et al., Reference Gurganus, Nuzhdin, Leips and Mackay1999; Viera et al., Reference Viera, Pasyukova, Zeng, Hackett, Lyman and Mackay2000), allowing these elements to act as genomic markers.
(b) Quantitative complementation
Oregon R and the introgressed line 50D-60F were used for quantitative complementation tests of mutations in candidate genes. The genome of 50D-60F is the same as Oregon R, except in the cytological region of 50D-60F, where the genome is the same as 2b.
(c) Genetic mutants
The following mutations in candidate genes were obtained from the Bloomington Drosophila Stock Center: insc22/CyO, sktlΔ20/CyO and inscP49/CyO. The skittles (sktl) gene is nested within an intron of insc (Hassan et al., Reference Hassan, Prokopenko, Breuer, Zhang, Paululat and Bellen1998). The insc22 allele was generated by ethyl methanesulfonate mutagenesis, which created a nucleotide substitution resulting in a premature translational termination codon near the amino-terminus of the coding region and therefore a truncated protein (Buescher et al., Reference Buescher, Yeo, Udolph, Zavortnik, Yang, Tear and Chia1998). This allele affects only insc and not sktl. sktlΔ20 is a loss-of-function deletion mutant missing at least part of the open reading frame (Hassan et al., Reference Hassan, Prokopenko, Breuer, Zhang, Paululat and Bellen1998). This mutant allele affects only sktl. inscP49 is an amorphic, loss-of-function deletion mutant that affects both insc and sktl (Kraut & Campos-Ortega Reference Kraut and Campos-Ortega1996).
(ii) Gravitaxis maze
Gravitaxis behaviour was tested using the maze design described in Armstrong et al. (Reference Armstrong, Texada, Munjaal, Baker and Beckingham2006). Briefly, the maze was assembled from 4·76 mm transparent polypropylene tubing and plastic T-shaped and Y-shaped connectors. This vertical maze design has a single entrance point (in the middle of the maze) and nine exit points, offering a total of eight choice points throughout the maze. Flies chose to walk either upwards (geonegative) or downwards (geopositive) at each choice point. The maze was attached to a piece of cardboard (0·79 mm thick) for stability and was covered by a piece of Bristol board.
To place flies in the maze, an 11-cm-long entrance tube was used. This tube was made from a piece of 4·76 mm polypropylene tubing plugged with cotton at one end and covered in black electrical tape. To collect flies from the maze, collecting tubes (15-ml glass test tubes) were attached to each of the nine exit points via plastic tubing that ran through rubber stoppers. These collecting tubes were numbered from 1 to 9, from top to bottom, as was done by Kessler et al. (Reference Kessler, Rockwell and Levine1982). A fly with a score of one made all ‘up’ choices (high gravitaxis), whereas a fly with a score of nine made all ‘down’ choices (low gravitaxis). To score the flies in the maze, the total number of flies in each of the nine collecting tubes was counted.
The collecting tubes contained a small amount of yeast paste (distilled water and Baker's yeast) as an attractant. In addition, a 76·2 cm 40 W fluorescent light bulb was positioned vertically at the end of the maze, seven inches away from the collecting tubes. This light source acted as an additional attractant to entice the flies to go through the maze. There was minimal variation in light intensity along the height of the maze. Flies were loaded and run through the maze in red light, so the fluorescent light bulb at the end of the maze was the only source of light in the testing room. A schematic diagram of the maze is shown in Fig. 1.
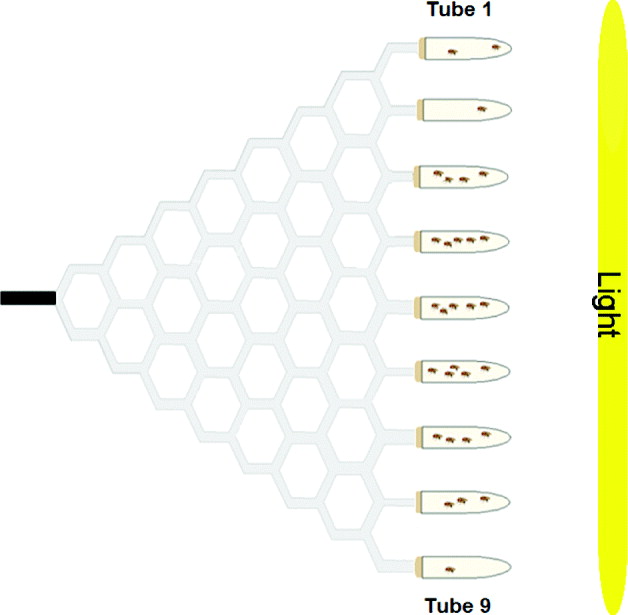
Fig. 1. Choice maze used to assay adult gravitaxis behaviour. D. melanogaster flies are loaded into the black entrance tube, and move through eight choice points throughout the maze. At the end of the maze, flies are collected into glass test tubes containing yeast paste. There is a light source at the end of the maze to act as an attractant.
(iii) Gravitaxis assay
Adult male flies (3–7 days old) of a single strain were tested in each gravitaxis maze (n=24±6 flies per maze). Male flies were used to avoid complicating the effects of female oviposition site preference on maze performance. Young adult (0–72 h old) male flies were collected using CO2 anaesthesia 2 days prior to the test and were kept on food until the test. Twenty minutes prior to the test, flies were starved on a distilled water–agar substrate (13·89 g agar per litre of dH2O). To load the flies into the maze, flies were transferred into an entrance tube, and the tube was attached to the maze entrance. Flies were allowed to run through the maze for a total of 3 h. After 1 h, the entrance tube was manually flicked to encourage all flies to leave the tube and enter the maze. After an additional 2 h, the collecting tubes were removed from the maze and plugged with cotton. The number of flies in each collecting tube was counted and a mean exit position was calculated for the strain. Any flies remaining in the mazes were removed.
All experiments were run during the day at room temperature. Up to 40 mazes were tested at the same time. Strain and maze locations were randomized for each test day.
(iv) QTL screen
The previously described RI lines were used to identify QTLs that may affect gravitaxis behaviour in adult D. melanogaster. Males from 88 different RI lines were screened using the aforementioned gravitaxis assay. All 88 lines were tested each day over five consecutive days. A similar QTL analysis investigating pupation position in Drosophila has been performed and is described in Riedl et al. (Reference Riedl, Riedl, Mackay and Sokolowski2007).
Briefly, QTL Cartographer (v.1.17) software (Basten et al., Reference Basten, Weir, Zeng, Smith, Gavora, Benkel, Chesnais, Fairfull, Gibson, Kennedy and Burnside)1994; Basten et al., Reference Basten, Weir and Zeng2003) was used for the QTL analysis of adult gravitaxis behaviour. This software can map QTLs for a particular phenotype to specific genomic regions by plotting a likelihood ratio (LR; the likelihood that a QTL is present at a given genomic location) against the relative genomic positions of the roo transposable elements. This ratio reveals the degree of correlation between a certain behaviour and a given genomic position. QTL Cartographer implemented composite interval mapping to calculate the LR=−2ln(L 0/L 1) and to test the hypothesis that an interval between two neighbouring markers contains a QTL (Basten et al., Reference Basten, Weir, Zeng, Smith, Gavora, Benkel, Chesnais, Fairfull, Gibson, Kennedy and Burnside)1994, Reference Basten, Weir and Zeng2003; Zeng, Reference Zeng1994; Gurganus et al., Reference Gurganus, Nuzhdin, Leips and Mackay1999). L 0/L 1 is the ratio of the likelihood under the null hypothesis (there is no QTL in the given interval) to the likelihood under the alternative hypothesis (there is a QTL in the given interval). Two thresholds of significance (5 and 1%) were used and were calculated by 10 000 random permutations of the data (Churchill & Doerge, Reference Churchill and Doerge1994; Doerge & Churchill, Reference Doerge and Churchill1996). For further details, please refer to the QTL Cartographer user's manual (Basten et al., Reference Basten, Weir and Zeng2003).
(v) Candidate genes
Subsequent experiments focused on one of the four genomic regions identified by the QTL screen. Candidate genes within this genomic region were identified based on functions related to gravity perception and these genes were tested using quantitative complementation. Quantitative complementation is commonly used to uncover genes underlying significant QTL regions (Gurganus et al., Reference Gurganus, Nuzhdin, Leips and Mackay1999; Mackay, Reference Mackay2001).
Briefly, virgin females with heterozygous balanced mutations in candidate genes were crossed with males of two parental strains with opposing gravitaxis phenotypes (Oregon R and 50D-60F). Heterozygous male progeny (parental/mutant and parental/balancer) were tested using the gravitaxis assay. We looked for an interaction where the magnitude of the difference in the gravitaxis phenotype between the parental strains is greater in the presence of the chromosome carrying the mutation compared with the balancer chromosome (a strain-by-chromosome interaction (Riedl et al., Reference Riedl, Riedl, Mackay and Sokolowski2007)), indicating that the candidate gene contributes to adult gravitaxis behaviour (Mackay, Reference Mackay2004). At least three replicates (mazes) per cross were tested over 2 days.
(vi) Statistical analysis
Statistical analyses were performed using SigmaStat. There was never a significant day effect and there was never a significant strain-by-day or chromosome-by-day interaction, so in all cases data for the two test days were pooled and analysed using a two-way ANOVA with strain (parental strain, either Oregon R or 50D-60F) and chromosome (mutant chromosome versus balancer chromosome) as sources of variation. A significance value of 0·05 was used.
3. Results
(i) QTL screen
The gravitaxis behaviour of adult male flies from 88 RI lines, and from the parental strains Oregon R and 2b, was tested in a large-scale QTL screen. These 88 lines showed behavioural variation in adult gravitaxis, with a mean exit tube position of approximately 4 across all of the lines (Fig. 2). Typically, flies tend to move against the direction of gravity, which may explain the asymmetry in the distribution of RI line scores.
Fig. 2. Gravitaxis behaviour of 88 recombinant D. melanogaster inbred lines. These lines showed natural variation in gravitaxis behaviour and a mean exit tube position of approximately 4.
QTL Cartographer identified four significant gravitaxis QTLs on the second and third chromosomes via composite interval mapping (Zeng, Reference Zeng1994; Basten et al., Reference Basten, Weir and Zeng2003). QTL A (LR=16·24, effect size=0·46, proportion of variance=27·4%, second chromosome, cytological region 57C-60E) had an LR above the 1% threshold of significance (LR above 16·03), whereas QTL B (LR=13·39, effect size=1·09, proportion of variance=84·7%, cytological region 61D-65A), QTL C (LR=13·79, effect size=0·73, proportion of variance=65·6%, cytological region 76B-79E) and QTL D (LR=13·92, effect size=0·79, proportion of variance=69·3%, cytological region 85A-85F), all on the third chromosome, had LRs above the 5% threshold of significance (LR above 12·24) (Fig. 3). Subsequent work focused on gravitaxis QTL A, since it had the highest level of significance in the QTL analysis.

Fig. 3. Results of the QTL screen for gravitaxis behaviour of 88 RI lines of D. melanogaster. The genome is divided into the three major chromosomes, and four plots represent the linkage groups. (Since these are RI lines, multiple generations of recombination occurred during their construction, expanding the recombination map (Nuzhdin et al., Reference Nuzhdin, Pasyukova, Zeng and Mackay1997). Because the recombination distance between markers 50F and 57C on chromosome 2 exceeds 50 cM on the expanded map, chromosome 2 is divided into two linkage groups.) The relative marker positions of the roo transposable elements are represented by the triangles along the horizontal axis. The likelihood ratio (LR), as calculated by composite interval mapping, is plotted against the recombination map. The LR represents the correlation between the behaviour and variation at each marker position. The solid and dashed lines within the plots indicate the 5 and 1% thresholds of significance, respectively. Four significant QTLs were found: one on chromosome 2 (QTL A) and three on chromosome 3 (QTLs B, C and D).
(ii) Oregon R and 50D-60F
Two lines, Oregon R and the introgressed line 50D-60F, were used as parental strains for quantitative complementation tests with candidate genes. The introgressed region of 50D-60F covers the entire QTL A region. Oregon R had significantly lower gravitaxis behaviour than did the introgressed line 50D-60F (N=10 mazes per strain, Oregon R mean=4·867±0·3072, 50D-60F mean=2·698±0·2203, F (1,18)=32·92, P=0·0001). We concluded that these lines differed in their upward versus downward movement in the mazes and were responding to gravitational forces, because when the flies were tested in mazes placed in a horizontal position rather than a vertical position, no strain differences were found (data not shown).
(iii) Locomotion
A correlation analysis was performed to ensure none of the RI lines had locomotor difficulties that might affect their performance in the gravitaxis maze. The analysis revealed an r-squared value of 0·02 (P=0·18), indicating no significant relationship between locomotor ability and maze performance.
(iv) Candidate genes
Candidate genes within QTL A were chosen based on their expression in the chordotonal organ, which is a sensory organ in the adult fly that functions in sound or vibration reception (Eberl, Reference Eberl1999; Beckingham et al., Reference Beckingham, Texada, Baker, Munjaal and Armstrong2005; Stölting et al., Reference Stölting, Stumpner and Lakes-Harlan2007). The chordotonal organ is related to vertebrate auditory hair cells (Eberl, Reference Eberl1999) and is thought to play a role in sensing gravitational forces (Eberl, Reference Eberl1999; Beckingham et al., Reference Beckingham, Texada, Baker, Munjaal and Armstrong2005). Two candidate genes expressed in this organ were identified within QTL A: inscuteable and skittles. inscuteable (insc) encodes a cytoskeletal adaptor protein and is known to be involved in chordotonal organ formation in D. melanogaster (Burchard et al., Reference Burchard, Paululat, Hinz and Renkawitz-Pohl1995; Kania et al., Reference Kania, Salzberg, Bhat, D'Evelyn, He, Kiss and Bellen1995; Knirr et al., Reference Knirr, Breuer, Paululat and Renkawitz-Pohl1997). insc is located at 57B3, which falls just outside the region identified in the QTL screen (57C-60E). Candidate genes underlying QTLs are sometimes located just outside the boundaries of the QTL region (Moehring and Mackay, Reference Mackay2004), making insc a possible candidate for QTL A.
The other candidate gene, skittles (sktl), is nested within an intron of insc (Hassan et al., Reference Hassan, Prokopenko, Breuer, Zhang, Paululat and Bellen1998). sktl encodes a 1-phosphatidylinositol-4-phosphate 5-kinase, and is also known to be involved in chordotonal organ development (Kania et al., Reference Kania, Salzberg, Bhat, D'Evelyn, He, Kiss and Bellen1995). We determined whether one or both of these genes are responsible for the gravitaxis differences that mapped to QTL A.
Three mutant alleles, insc22/CyO, sktlΔ20/CyO and inscP49/CyO, were tested using quantitative complementation with Oregon R and 50D-60F. Tests with inscP49 (affecting both insc and sktl) revealed a significant strain (parental strain, either Oregon R or 50D-60F) by chromosome (mutant versus balancer chromosome) interaction, where the magnitude of the difference between Oregon R and 50D-60F was significantly greater in the presence of the mutant chromosome than the balancer chromosome (strain F (1,28)=18·716, P<0·001, chromosome F (1,28)=53·972, P<0·001, strain×chromosome F (1,28)=20·453, P<0·001 (Fig. 4 a)). The results with insc22 (affecting only insc) revealed no significant strain-by-chromosome interaction (strain F (1,30)=4·286, P=0·047, chromosome F (1,30)=29·618, P<0·001, strain×chromosome F (1,30)=0·222, P=0·641 (Fig. 4 b)). The sktlΔ20 (affecting only sktl) results revealed a significant strain-by-chromosome interaction (strain F (1,34)=10·389, P=0·003, chromosome F (1,34)=62·345, P<0·001, strain×chromosome F (1,34)=8·297, P=0·007 (Fig. 4 c)). Taken together, these results suggest that skittles is a candidate gene involved in natural variation in adult gravitaxis behaviour in D. melanogaster.

Fig. 4. Quantitative complementation tests of candidate genes with 50D-60F (solid circle) and Ore (open circle). (a) inscP49 shows a significant strain by chromosome interaction (two-way ANOVA, P<0·001). (b) insc22 shows no significant strain by chromosome interaction (two-way ANOVA, P=0·641). (c) sktlΔ20 shows a significant strain-by-chromosome interaction (two-way ANOVA, P=0·007). Since inscP49 affects both insc and sktl, these results suggest that skittles is involved in adult gravitaxis behaviour in D. melanogaster.
4. Discussion
Little is known about the genetic and molecular bases of gravitational response in D. melanogaster. Previous studies have demonstrated that natural variation in gravitaxis behaviour is likely a complex trait influenced by multiple genes (Hirsch & Erlenmeyer-Kimling, Reference Hirsch and Erlenmeyer-Kimling1962; McGuire, Reference McGuire1992; McMillan & McGuire, Reference McMillan and McGuire1992). More recent studies (see below) have begun to identify not only the genes influencing this behaviour, but the physiological and molecular mechanisms by which fruitflies sense and respond to gravity (Toma et al., Reference Toma, White, Hirsch and Greenspan2002; Beckingham et al., Reference Beckingham, Texada, Baker, Munjaal and Armstrong2005; Armstrong et al., Reference Armstrong, Texada, Munjaal, Baker and Beckingham2006; Baker et al., Reference Baker, Beckingham and Armstrong2007). In the present study, we found four QTL regions responsible for natural variation in adult gravitaxis behaviour in our D. melanogaster RI lines. We also identified skittles as a gene important for variation in gravitaxis behaviour in these lines.
(i) QTL screen
Previous studies have used microarrays or forward genetics to investigate genes that influence gravitaxis behaviour. The present study is the first to perform a genome-wide QTL screen of D. melanogaster gravitaxis behaviour. Further screens using different parental lines will undoubtedly identify more genes that contribute to natural variation in gravitaxis behaviour. We identified four genomic regions that contribute to natural variation in gravitaxis behaviour in our RI lines. While this study focused on only one of the four QTL regions, each of the remaining three regions contains at least one gene influencing gravitaxis. For example, atonal is located at cytological position 84F and falls just outside the boundaries of QTL D (85A-85F). atonal is an intriguing candidate gene because it disrupts chordotonal neuron differentiation, where atonal mutants completely lack the chordotonal sense organs (Jarman et al., Reference Jarman, Sun, Jan and Jan1995).
(ii) Candidate genes
Most animals have specific organs that sense gravitational forces. For example, the vestibular apparatus of the vertebrate ear contains small particles (otoliths) that move and stimulate mechanosensory hair cells within the ear in response to gravity. The stimulation of these hair cells sends a signal to the brain prompting the animal to orient and balance itself accordingly (Beckingham et al., Reference Beckingham, Texada, Baker, Munjaal and Armstrong2005). Similar organs and mechanisms are found in marine invertebrates, but there is no known specific gravity-sensing organ in most arthropods, including D. melanogaster.
While specific organs have not yet been identified in Drosophila, gravitational response is believed to be mediated by mechanosensory structures, similar to the hair cells in the vertebrate ear. In insects, both bristle type and scolopidial type mechanoreceptors appear to play a role in gravity response (Horn, Reference Horn, Kerkut and Gilbert1985). Scolopidial mechanoreceptors respond to stretch and are found in chordotonal organs, which are related to vertebrate auditory hair cells (Eberl, Reference Eberl1999; Kernan, Reference Kernan2007). The Johnston's organ (JO) is a chordotonal type organ analogous to the vertebrate ear and is found in the second antennal segment of Drosophila (Eberl & Boekhoff-Falk, Reference Eberl and Boekhoff-Falk2007; Kernan, Reference Kernan2007). The JO responds to sound, vibration and gravity (Eberl, Reference Eberl1999; Jarman, Reference Jarman2002; Kernan, Reference Kernan2007; Kamikouchi et al., Reference Kamikouchi, Inagaki, Effertz, Hendrich, Fiala, Göpfert and Ito2009).
Three previous studies have implicated the JO in adult gravitaxis behaviour in Drosophila (Armstrong et al., Reference Armstrong, Texada, Munjaal, Baker and Beckingham2006; Baker et al., Reference Baker, Beckingham and Armstrong2007; Kamikouchi et al., Reference Kamikouchi, Inagaki, Effertz, Hendrich, Fiala, Göpfert and Ito2009). Kamikouchi et al. (Reference Kamikouchi, Inagaki, Effertz, Hendrich, Fiala, Göpfert and Ito2009) identified a role for specific neuronal clusters of the JO in adult gravitaxis behaviour. Inactivation of these neuronal clusters abolished the typical negative gravitaxis behaviour seen in wild-type flies. Interestingly, ablation of the second antennal segment (that which contains the JO) did not completely abolish the typical negative gravitaxis behaviour. It is therefore possible that other organs are involved in gravity sensation in Drosophila.
Baker et al. (Reference Baker, Beckingham and Armstrong2007) showed that disrupting synaptic transmission in neurons projecting from the JO to the brain inhibits gravitaxis maze behaviour in Drosophila. Taken together, this information led to the selection of our gravitaxis behaviour candidate genes for QTL A (insc and sktl) based on their role in chordotonal organ development. Our results show that sktl but not insc influences adult gravitaxis behaviour. sktl encodes a phosphatidylinositol 4-phosphate 5-kinase involved in signal transduction and thus could act in the sensory mechanotransduction pathway that converts gravity sensation into a behavioural response (Hassan et al., Reference Hassan, Prokopenko, Breuer, Zhang, Paululat and Bellen1998).
Baker et al. (Reference Baker, Beckingham and Armstrong2007) also looked at known expression patterns of lines with aberrant gravitaxis maze behaviours and found that many of these lines have significantly increased expression in certain neural structures, such as the central complex (CC) and the antennal lobes. Synaptic transmission was inactivated in these candidate neural structures using the GAL4-UASshi ts system, and this inactivation altered gravitaxis behaviour, implicating the CC and antennal lobes as neural structures important for gravitaxis behaviour. The CC is a central region of the fly brain known to play a role in the integration of sensory information and motor output. Several substructures of the CC have been identified and manipulated in Drosophila, making this an excellent candidate region for the investigation of the neural substrates and circuitry underlying gravitaxis behaviour (Strauss & Heisenberg, Reference Strauss and Heisenberg1993).
Interestingly, a recent publication studied graviperception in Zea mays (Perera et al., Reference Perera, Heilmann and Boss1999). The authors studied the pulvinus (the joint at the base of a leaf that facilitates movement), a part of the plant known to be involved in graviperception and gravity response. They measured phosphatidylinositol 4-phosphate 5-kinase activity in this plant following gravistimulation (plants were placed horizontally and the direction of growth changed to restore the vertical orientation). They found that this kinase is involved in plant orientation in response to the gravity vector (Perera et al., Reference Perera, Heilmann and Boss1999). Specifically, the activity levels of phosphatidylinositol 4-phosphate 5-kinase increased during gravistimulation. In the present study we showed that sktl, which also encodes a phosphatidylinositol 4-phosphate 5-kinase, affects gravitaxis behaviour. This suggests that the role for phosphatidylinositol 4-phosphate 5-kinase in gravitational response in both Drosophila and Z. mays may extend to other organisms.
This research was supported by grants from the Canadian Space Agency and the Natural Sciences and Engineering Research Council of Canada (NSERC) to MBS and by National Institutes of Health grant R01 GM45146 to TFCM. CED was supported by an NSERC graduate scholarship and CALR by a training grant from the Canadian Institutes for Health Research. We thank Kate Beckingham and Doug Armstrong for advice on how to set up the geotaxis mazes and for encouragement during the early stages of this project.


