1. Introduction
Circadian rhythms are a basic property of living systems that impose a 24 h temporal organization of behavioural and metabolic activities in many higher and some lower organisms. These rhythms are determined by endogenous oscillators that can be entrained by environmental stimuli. In higher eukaryotes, circadian rhythms are mediated at the molecular level by autoregulatory feedback loops. In the model organism Drosophila melanogaster, the period (per) gene has been demonstrated to play a fundamental role in the control of circadian eclosion and adult locomotor activity rhythms (Hall, Reference Hall2003). Mutations within per can abolish the expression of 24 h behavioural rhythmicity or modify its periodicity, by either increasing or decreasing the circadian cycle in constant darkness (Konopka & Benzer, Reference Konopka and Benzer1971). Furthermore, circadian clocks have also been implicated in the control of pre-adult developmental time in both D. melanogaster (Kyriacou et al., Reference Kyriacou, Oldroyd, Wood, Sharp and Hill1990; Paranipe et al., Reference Paranipe, Anitha, Chandrashekaran, Joshi and Sharma2005) and the melon fly Bactrocera cucurbitae (Miyatake, Reference Miyatake1996; Shimizu et al., Reference Shimizu, Miyatake, Watari and Arai1997) in that positive correlations have been observed with both these species between the free-running periods of various clock mutants and various measures of development time. In Drosophila, per 01 null mutants show a faster development than all other per genotypes, even under conditions of constant bright light, when PER expression should be minimal and all flies are behaviourally arrhythmic (Kyriacou et al., Reference Kyriacou, Oldroyd, Wood, Sharp and Hill1990; Konopka et al., Reference Konopka, Pittendrigh and Orr1989). This suggests that a developmental pleiotropy that is not based on the circadian clock, but which involves the per locus, is mediating these pre-adult phenotypes.
B. mori displays circadian rhythms in both egg-hatching behaviour (as quoted in Sehadova et al., Reference Sehadova, Markova, Sehnal and Takeda2004) and adult eclosion (Shimizu & Matsui, Reference Shimizu and Matsui1983). These circadian phenotypes are common to many Lepidoptera. In particular, in the giant moth Antheraea pernyi, egg-hatching could be controlled by the cycling expression of Apper in a restricted number of brain neurons, although no compelling experimental data have been presented (Sauman & Reppert, Reference Sauman and Reppert1998). While A. pernyi encodes a family of three types of sex-linked per genes (Gotter et al., Reference Gotter, Levine and Reppert1999), B. mori is characterized by a single copy of per, expressed in both adult heads and peripheral tissues (Iwai et al., Reference Iwai, Fukui, Fujiwara and Takeda2006). Specifically in heads, it is rhythmically expressed under different light:dark (LD) regimes, with a maximum just after lights-off. The B. mori putative master clock has been identified in three clusters of brain neurons, where PER protein is expressed with a cycling profile in 12:12 LD (Sehadova et al., Reference Sehadova, Markova, Sehnal and Takeda2004).
In B. mori (or A. pernyi) no per mutant alleles have yet been isolated, so we have used a dsRNAi strategy to produce a gene knock-down (KD). The possibility of using RNAi in B. mori was first demonstrated by Quan and co-workers (Reference Quan, Kanda and Tamura2002), who showed that the injection of dsRNA into preblastoderm eggs inhibited the expression of a target gene. Subsequently, transgenic silkworms were produced that carried a construct for generating a stable dsRNAi (Isobe et al., Reference Isobe, Kojima, Matsuyama, Quan and Kanda2004). In our study, we have generated transgenic silkworms that carry a construct that induces a stable and heritable per dsRNAi (per-IR).
In our system the per KD was able to modestly but significantly alter egg-hatching circadian behaviour in 12:12 LD. This is particularly interesting in the light of work by Sauman and co-workers (Reference Sauman, Tsai, Roca and Reppert1996), in which the ‘hatching gate’ in A. pernyi was reported to be disrupted by anti-sense injections of Apper. However, this result could not be replicated by the same group, who subsequently retracted their finding (Sauman et al., Reference Sauman, Tsai, Roca and Reppert2000). Our results thus reopen the possibility that per may indeed play a functional role in the hatching rhythm of Lepidoptera. In addition, the per dsRNAi construct caused a reduction in egg-to-adult developmental time, as predicted by the studies in Diptera mentioned above. Finally, the transgenic per KD silkworms did not show any significant modification in female fertility, nor in cocoon silk percentage, important production parameters in sericulture.
2. Methods
(i) Strain and rearing conditions
The Nistari polyvoltine Indian strain was obtained by Dr G. Chavancy (Institut National de la Recherche Agronomique, Unité Nationale Séricicole, France). B. mori eggs were incubated at 26±1°C and 85±5% relative humidity (RH). Silkworms were reared in 12:12 LD and constant darkness (DD). Larvae were fed with an artificial diet (Cappellozza et al., Reference Cappellozza, Cappellozza, Saviane and Sbrenna2005). All the molecular and behavioural experiments were carried out on newly laid eggs, avoiding egg preservation at low temperature (5°C) after laying.
(ii) per-IR plasmid construction
The per-IR construct was characterized by two per inverted repeats (IR), under the control of the B. mori Actin promoter in the piggyBac[3 X P3-EGFP] vector (Piccin et al., Reference Piccin, Salameh, Benna, Sandrelli and Mazzotta2001; Horn & Wimmer, Reference Horn and Wimmer2000).
(a) First step: Introduction of the Act promoter and SV40 terminator in the pBac[3 X P3-EGFP] vector
A 241 bp Act promoter fragment (Act-prom) and 282 bp SV40 terminator (SV40-Term) were amplified using the pPIGA3GFP plasmid (Tamura et al., Reference Tamura, Thibert, Royer, Kanda and Abraham2000) as template. The primers were as follows: (i) for Act-prom, act-5 (5′-AAAAGGCGCGCCCACAGGAAA CAGCTATGACC-3′) and act-3 (5′-TACTAGTCTGATGCACTGTTCGAGCACACC-3′), both carrying a tail (underlined) containing the restriction sites AscI and SpeI, respectively; (ii) for SV40-Term, SV40-5 (5′-CATCAGACTAGTAAGCGGCCGCGACTCT-3′) and SV40-3 (5′-AAAAAGATCTCGCGTATCGATAAGCTTTAAG-3′), carrying a tail (underlined) containing the restriction sites SpeI and BglII, respectively. The underlined regions in the act-3 and SV40-5 primers indicate complementary sequences that permit the joining of the two fragments in a chimeric segment. Therefore, equimolar amounts of the two amplified fragments were mixed together and subjected to PCR with act-5 and SV40-3 primers, which allow only the amplification of the 517 pb Act-SV40 chimeric segment. This tract was then cloned as an AscI–BglII fragment in the pBac[3 X P3-EGFP] vector, obtaining the pBac[3 X P3-EGFP]-exp vector.
(b) Second step: Construction of the per-IR fragment
A 825 bp fragment from the B. mori per coding sequence was obtained via RT-PCR using the 5′ primer 5′-CGGTACGCAAGAAAAAGCTC-3′ and the 3′ primer 5′-CTGTGGTCCGGATCCTGTATTTC-3′ (positions 991–1011 and 1792–1816, respectively, in GenBank AB179829) and cloned in the pCR2-Topo vector (Invitrogen). This fragment was sequenced to exclude PCR-induced nucleotide substitutions and subcloned as a SpeI–ApaI fragment in the pBC KS+ vector (Stratagene). In parallel, a 419 bp fragment from the lacZ gene, serving as a heterologous spacer to favour hairpin-dsRNA formation, was amplified using the 5′ primer 5′-GCATTATCCGGACCATCC-3′ and the 3′ primer 5′-TCTCTCCAGGTAGCGAAAGC-3′, both containing an AvaII restriction site (underlined). PBC-per was then digested using KpnI and AvaII restriction enzymes and recircularized in the presence of a 402 bp AvaII–AvaII lacZ fragment and AvaII–KpnI per fragment, obtained from pCR2-per plasmid.
(c) Third step: Preparation of the pBac-EGFP-per-IR construct
Finally, the SpeI–SpeI fragment containing the per-IR separated by the lacZ spacer was subcloned between the Act promoter and SV40 terminator in the pBac[3 X P3-EGFP]-exp vector, obtaining the approximately 9·1 kb pBac-EGFP-per-IR (per-IR) construct (Fig. 1).
Fig. 1. Schematic representation of the pBac-EGFP-per-IR construct. 825 pb per inverted repeats separated by the lacZ spacer were subcloned between the Actin promoter and SV40 poly A terminator in the pBac[3 X P3-EGFP] vector. The marker EGFP is under the control of the 3 X P3 promoter, active at the level of stemmata and in the developing embryonic nervous system (Horn & Wimmer, Reference Horn and Wimmer2000). piggyBac R and L, inverted terminal repeats of piggyBac; Amp R, ampicillin-resistance gene.
(iii) Transgenesis and screening of transformed B. mori
Syncytial preblastoderm wild-type Nistari embryos were injected with a 1:1 mixture of pBac-EGFP-per-IR construct and helper plasmid, as described in Tamura et al. (Reference Tamura, Thibert, Royer, Kanda and Abraham2000). G1 embryos were screened on the seventh day of development under a fluorescence stereomicroscope, equipped with appropriate filters for GFP detection. From 4353 Nistari injected embryos, 463 G0 fertile moths were obtained. After sibling mating, one G1 brood with GFP-positive embryos was isolated, giving a transformation efficiency of 0·2%. The G1 individuals were allowed to develop in a mass culture with non-transformed embryos and the GFP fluorescence was rechecked at the pupal stage. Five GFP-positive single G1 individuals were then selected and backcrossed to wild-type Nistari moths, obtaining five different G2 transgenic broods. Subsequently, in order to obtained stable transgenic lines, GFP-positive individuals of each G2 transgenic brood were selected and separately intercrossed for about 10 generations.
(iv) DNA extraction and Southern blot analysis
Genomic DNA (10 μg per sample) was prepared according to Sambrook et al. (Reference Sambrook, Fritsch and Maniatis1989). Wild-type DNAs were digested with BamHI or HindIII or XbaI restriction enzymes, singly or in combination; transgenic DNA samples were digested separately with ApaI or PstI or SacI restriction enzymes. Wild-type blots were hybridized with a 160 bp per [γ-32P]dCTP probe (1035–1194 in GenBank Accession number AB179829; Takeda et al., Reference Takeda, Chuman, Shirasu, Sato and Matsushima2004). Transgenic blots were probed with a 380 bp lacZ [γ-32P]dCTP fragment, corresponding to the portion used as spacer sequence in the transgene. Each Southern blot experiment was repeated twice.
(v) RT- and real-time PCR
For RT-PCR, transgenic embryos were collected after 5, 6 and 7 days of development; for quantitative PCR, 7-day-old embryos from transgenic and wild-type synchronized cultures in 12:12 LD were collected and frozen 3 h after lights-on (Zeitgeber 3 (ZT 3), with ZT 0 and ZT 12 representing lights-on and lights-off, respectively). For each sample, total RNA was extracted from 25 frozen embryos and cDNA was synthesized as in Mazzotta et al. (Reference Mazzotta, Sandrelli, Zordan, Mason and Benna2005). To amplify the lacZ spacer in RT-PCR experiments, a nested PCR was carried out. The first PCR was performed by using the 5′ primer 5′-GCTTTCGCTACCTGGAGAGA-3′ and the 3′ primer 5′-GCTGTGGTACACGCTGTGCG-3′, obtaining a 401 pb amplicon. The second was performed employing the 5′ primer 5′-TGTGGTGGATGAAGCCAATA-3′ and the 3′ primer 5′-GATACAGCGCGTCGTGATTA-3′ and 2 μl of the first amplification as template, in order to obtain a 194 bp amplified fragment. Both PCR reactions were carried out using the following programme: 95°C for 10 min then 95°C for 30 s, 60°C for 30 s, 72°C for 30 s, for 40 cycles, followed by a final 7 min at 72°C.
The real-time PCR experiments were performed on a Rotor Gene 3000 (Corbett Research), as in Zordan et al. (Reference Zordan, Cisotto, Benna, Agostino and Rizzo2006). The primers used were the following: 5′-GTTGGGTAACACCGAGGAG-3′ and 5′-CGCTGGAATATGGTGATCGG-3′ for per mRNA (positions 2996–3016 and 3212–3233, respectively in GenBank AB179829; Takeda et al., Reference Takeda, Chuman, Shirasu, Sato and Matsushima2004) and 5′-TCAATCGGATCGCTATGACA-3′ and 5′-GGAATCCATTTGGGAGCATA-3′ for the housekeeping rp49 mRNA (positions 7–26 and 142–161 respectively in GenBank AB048205). SYBRGreen (Applied Biosystems) fluorescent molecule was used to generate semiquantitative data. The PCR reaction was carried out using the following programme: 95°C for 15 s, 60°C for 15 s, 72°C for 30 s, for 40 cycles, followed by a final 10 min step at 72°C. The amplification efficiencies of each sample were calculated on the basis of the results of three amplification reactions, with different quantities of the template (30, 60, 120 ng of total reverse-transcribed RNA), according to Pfaffl (Reference Pfaffl2001). Each reaction was done in duplicate. The relative levels of per mRNA in both transgenic lines were compared with those of the wild-type at the same developmental stage (chosen as reference). All real-time PCR experiments were performed on three independent RNA extractions.
(vi) Analysis of egg-hatching circadian behaviour
For each line, batches of 150–250 eggs, laid in 4 h periods, were checked during development and the numbers of hatched larvae were recorded by three operators at 2 h intervals, as previously described for the lepidopteran A. pernyi (Sauman et al., Reference Sauman, Tsai, Roca and Reppert1996; Sauman & Reppert, Reference Sauman and Reppert1998). For each line the experiments were performed at least twice, in 12:12 LD. In order to evaluate the egg-hatching behaviour, each egg was given an hourly score that represented the time it hatched, from the initial observation period which was ZT 19, day 1 (score 1), until ZT 18, day 3 (score 72). Subsequently, for each egg-batch, a ‘mean hatching time’ score was calculated.
(vii) Life cycle analysis
The developmental rate analyses were conducted in 12:12 LD and DD.
(a) Egg collection and egg development analysis
For each line, 20 mother moths were allowed to lay for 2 h periods. For each environmental condition, 4 h of egg-laying was collected, from ZT 10 to ZT 14 (and at the corresponding CTs, with CT 0 and CT 12 representing the beginning and the end of the subjective day in DD), and subdivided into two 2 h egg-laying sessions. For each 2 h egg-laying session at least three replicates per experimental condition were evaluated. Number of eggs per replicate ranged from 100 to 400. Egg-hatching was examined three times per day (at ZT 0, 4, 12, and at the corresponding CTs) for three consecutive days, and for each transgenic or wild-type egg-laying replicate, the number of hatched individuals per day were recorded.
(b) Larval cycle
Fertilized eggs were obtained from silkworms grown in 12:12 LD. Ten egg batches for each line were placed in 12:12 LD and DD. Hatching larvae were placed in transparent boxes and the number of larvae per box was progressively reduced from 100 for the first instar, to 30 for the fifth instar. The synchronization of the cultures was performed as described in Bosquet et al. (Reference Bosquet, Fourche and Guillet1989). Briefly, during moulting periods, relative humidity was progressively decreased to 60–65% in order to permit food desiccation and to avoid early moulters resuming feeding before late moulters. Feeding was suspended when larvae showed moulting behaviour. Interruptions of feeding in concurrence with moulting periods never lasted more than 24 h, as larvae were well synchronized and feeding was resumed when 80% of moulting larvae had ecdysed. For each line, three replicates were established. At 4–5 days after spinning, cocoons were cut and pupae were separated from their shells and sexed.
(c) Eclosion and mating
New-emerged adults were consecutively recorded for 4–5 days. Three replicates per line for females in 12:12 LD and two replicates for females in DD and males in 12:12 LD and DD were analysed. The number of individuals per replicate ranged from 30 to 50. Eclosed moths (single couples) were mated for 2 h, males were eliminated and females were allowed to lay eggs.
In order to analyse the data, for each developmental stage, each individual was given a daily score that represented the time it required to complete the specific developmental stage, from day 1 (score 1) to day 3 (score 3) for larval hatching and moults and from day 1 (score 1) to day 5 (score 5) for adult eclosion. Subsequently, for each transgenic or wild-type replicate, a ‘mean developmental time’ score (the mean time required to complete a specific developmental stage) was calculated.
(viii) Production parameters
(a) Analysis of oviposition
For each line, 20–30 fertilized females were allowed to lay in 12:12 LD. Overall 8 h ovipositions were collected, from ZT 8 to ZT 16. For each genotype, the percentage of eggs laid in each 2 h interval was recorded. In order to analyse the oviposition profile data, each egg was given an hourly score that represented the time it was laid, from ZT 8–10 interval (score 1) to ZT 14–16 interval (score 4) and for each transgenic or wild-type female the ‘mean oviposition score’ value, an individual index of the temporal pattern of oviposition, was calculated.
(b) Analysis of cocoon silk ratio
For each line, at least 30 female and 30 male cocoons, spun in 12:12 LD, were individually weighed. A ‘cocoon silk’ ratio was calculated as silk shell/cocoon weights.
(ix) Statistical analysis
Analysis of variance was performed using one-way ANOVA and the a posteriori LSD-least significant difference test with the Statistica 5.0 package (Statsoft Inc.).
3. Results
(i) Characterization of transgenic per-IR B. mori
Our data indicate that, unlike A. pernyi (Gotter et al., Reference Gotter, Levine and Reppert1999), the wild-type Nistari B. mori strain encodes a single per gene in both sexes (Fig. 2A). Five transgenic lines were characterized by Southern blot analysis using a lacZ fragment as a probe, which allowed the specific identification of the per-IR insert (see Section 2 for details). Each sample showed a different hybridization pattern, variable both in position and number of insertions (Fig. 2B). Specifically, three transgenic lines (Ta, C3, XE) carried only one copy of the transgene, while the others (Tb, T5) had two inserts. The C3 and T5 transgenic lines were subsequently selected in order to characterize the effects of per post-transcriptional silencing. For both transgenic lines, the per-IR insert was actively transcribed 5 days after fertilization, approximately 72 h before hatching, and persisted in all later stages examined, until approximately 24 h before hatching (Fig. 2C). In fact, in all tested samples the RT-PCR experiments showed an active transcription of the lacZ spacer, characteristic of the per-IR transgene and not present in the host B. mori genome. Fig. 2D shows per mRNA expression evaluated via real-time PCR in 7-day-old C3, T5 transgenic and wild-type embryos, sampled at the same time of the day, 3 h after lights-on (ZT 3). The results indicate a partial but nevertheless significant decrease in per mRNA levels in both the transgenic lines tested compared with wild-type (F 2,6=57·75, P<0·001).

Fig. 2. Molecular characterization of the wild-type and the C3 and T5 transgenic lines. (A) Genomic Southern blots of wild-type adult males or females DNAs digested with BamHI (Ba), HindIII (H) or XbaI (X), singly or in combination, and hybridized with 160 bp per probe. Letters above lanes identify restriction enzyme(s). (B) Genomic Southern blots of transgenic DNAs from adult males digested with ApaI (Ap), PstI (P) or SacII (S) and probed with a 380 bp lacZ fragment. Ta, Tb, T5, C3 and XE represent five independent transgenic lines. Letters above lanes identify restriction enzyme(s). (C) RT-PCR of a per-IR transgene fragment on transgenic C3 and T5 embryonic cDNAs, at different developmental stages. Numbers above lanes identify the number of days after fertilization. (D) per mRNA levels (via real-time PCR) in 7-day-old transgenic C3, T5 and wild-type embryos (mean±SEM of three independent experiments; one-way ANOVA F 2,6=57·75, P<0·001).
(ii) Circadian egg-hatching in transgenic lines
Fig. 3 shows the temporal profiles of hatching times for C3, T5 transgenic and wild-type individuals in 12:12 LD. Wild-type B. mori showed modal egg-hatching around the dark–light transition with an ‘anticipation’ of lights-on. Under LD entrainment conditions both the per KD lines showed a similar behaviour to that of the wild-type strain, although it is clear that in both lines, particularly C3, the main ‘hatching gate’ had spread into the day compared with the control. ANOVA of three replicate experiments for wild-type and T5, and two for C3, revealed no significant differences in the mean temporal interval in which hatching occurs (F 2,5=0·63, n.s.). However, when we examined the coefficient of variation (CV) for hatching, we obtained a highly significant result, even with such small sample sizes (F 2,5=13·65, P<0·01, CV mean for wild-type=0·052, T5=0·107, C3=0·196). A posteriori analysis of the mean CVs revealed that the wild-type showed a significantly reduced CV compared with C3 (P<0·005) and a marginal effect compared with T5 (P=0·07). Thus there appears to be a significant increase in the variances of the ‘hatching gate’, but not in the means, which would be consistent with a mild disruption of the hatching rhythm.
Fig. 3. Percentage of hatching larvae in 12:12 LD. Grey bars represent dark periods, open bars light periods of the day. C3 transgenic line (mean of two replicates); T5 transgenic line (mean±SEM of three replicates); wild-type (mean±SEM of three replicates). Statistical analysis is provided in the text.
(iii) Transgenic per-IR life cycle analysis
We compared the developmental rate of C3 and T5 transgenic lines with that of the wild-type polyvoltine Nistari strain, which at 26°C shows a life cycle length of approximately 40 days. The rate of each developmental stage was analysed in synchronized cultures of the two transgenic and wild-type lines, in 12:12 LD and DD (CT 0, subjective lights-on). Moreover, for each stage, mortality was recorded, but no differences between transgenics and wild-type were found (data not shown). To evaluate the duration of the first developmental stage (from egg to first instar larva), we analysed the developmental time of fertilized eggs laid in two consecutive 2 h periods (ZT 10–12, ZT 12–14, and at the corresponding CTs). From the first day onwards, we noticed an acceleration in development of the transgenic fertilized eggs with respect to those of the control. During B. mori embryonic maturation, the egg-shell pigmentation changes because of the progressive maturation of the enclosed embryo (Pang-Chuan & Da-Chuang, Reference Pang-Chuan and Da-Chuang1992). Specifically, at 26°C, the wild-type Nistari strain shows a uniformly yellow pigmented egg-shell (‘yellow’ stage) 6 days after fertilization. The following day, the egg-shell shows a dark spot, corresponding to the developing embryonic head (‘eye-spot’ stage) and, after a further 24 h, it becomes uniformly grey (‘blue-egg’ stage). For both the transgenic lines the last pigment modification in the egg-shells occurred earlier, in both 12:12 LD and DD, so that by 7 days after fertilization, when the wild-type eggs were at the ‘eye-spot’ stage, most of the transgenic eggs were at the ‘blue-egg’ stage (Fig. 4A). From the eighth day after fertilization, the egg-hatching percentages for C3 and T5 transgenic lines and wild-type strain were evaluated for three consecutive days (Fig. 4B–E). To compare the transgenic and wild-type egg-hatching time, analysis of variance was performed on scores representing the mean time required to hatch, calculated for each transgenic and wild-type replicate (‘mean hatching time’ score) (Table 1). In both 12:12 LD and DD, for each 2 h egg-laying cohort, the transgenic cultures showed a significant acceleration of approximately 24 h in the mean time required to complete the embryonic stage compared with the wild-type. The a posteriori comparisons did not reveal any significant differences in the hatching time between the two transgenic lines, for the CT, ZT 10–12 collections, but the T5 line showed a significant acceleration compared with C3 for the subsequent collection in CT 12–14 (P<0·05; see notes to Table 1).
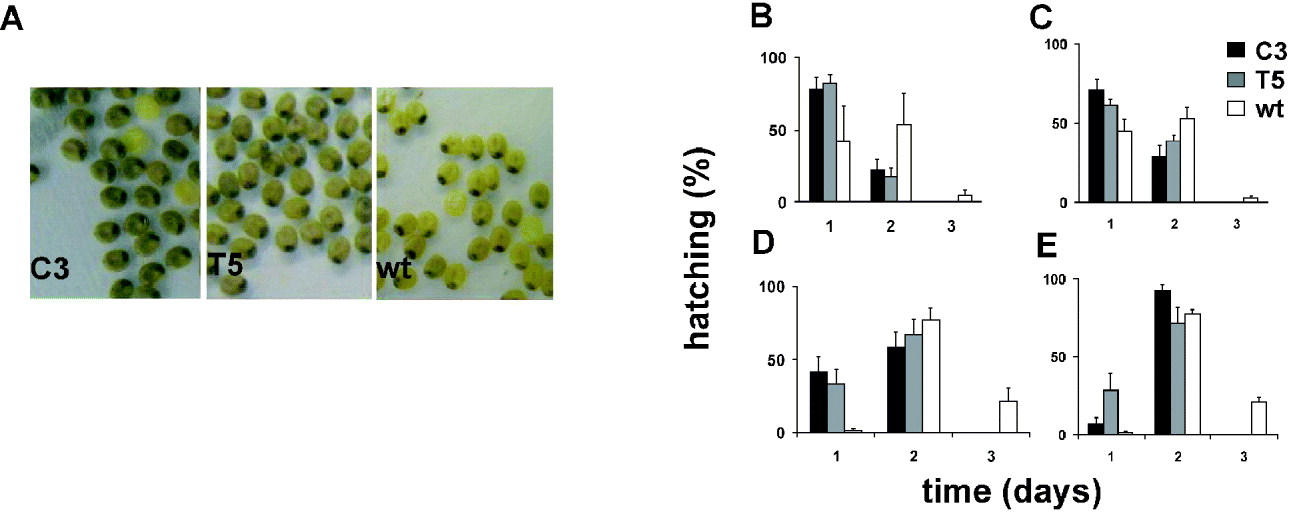
Fig. 4. Egg-hatching in transgenic C3, T5 and wild-type synchronized cultures in 12:12 LD and DD. (A) Seven-day-old transgenic C3, T5 and wild-type embryos derived from synchronized eggs laid in the ZT 12–14 interval. Percentage of hatched larvae from eggs laid in (B) the ZT 10–12 and (C) the ZT 12–14 intervals, in 12:12 LD, and in (D) the CT 10–12 and (E) the CT 12–14 intervals, in DD. For each egg-laying interval, the mean±SEM of at least three replicates is shown.
Table 1. Egg-hatching time in transgenic C3 and T5 and wild-type B. mori
Score represents the mean time required to hatch (comparison between C3, T5 and wild-type for eggs laid in: a ZT 10–12 interval: F 2,6=12·47, P<0·01; post-hoc LSD tests were not significant between C3 and T5; b ZT 12–14 interval: F 2,15=6·30, P<0·01; post-hoc LSD tests were not significant between C3 and T5; c CT 10–12 interval: F 2,6=11·74, P<0·01; post-hoc LSD tests were not significant between C3 and T5; d CT 12–14 interval: F 2,15=13·40, P<0·001; post-hoc LSD test: C3 vs T5, P=0·03).
N, number of replicates.
During the three subsequent moults, no significant differences in the developmental timing between transgenic and wild-type lines were recorded (Table 2). At the last moult, in 12:12 LD, most of the transgenic individuals reached the moulting phase 24 h earlier than the wild-type (F 2,6=39·59, P<0·001; Table 2). In DD, the faster developmental rate of both the transgenic lines was more evident, with the moulting phase approximately 48 h before the controls (F 2,6=271·36, P≪0·0001; Table 2). In both 12:12 LD and in DD, a posteriori comparisons revealed significant differences in the moulting time between the two transgenic lines (see notes to Table 2).
Table 2. Timing of larval development in transgenic C3 and T5 and wild-type B. mori
Score represents the mean time required to complete a specific developmental stage (comparison for the IV moult between C3, T5 and wild-type: a in 12:12 LD F 2,6=39·59, P<0·001, post-hoc LSD test: C3 vs T5 P<0·001 and b in DD F 2,6=271·36, P≪0·0001, post-hoc LSD test: C3 vs T5 P<0·01).
In Fig. 5A and 5 B the percentages of transgenic and wild-type emerging adult females, analysed for five consecutive days in 12:12 LD and DD, are reported. The transgenic and wild-type eclosion times obtained in 12:12 LD were compared by performing an ANOVA on ‘mean eclosion time’ scores, calculated for each transgenic or wild-type replicate. The temporal eclosion pattern of both the transgenic lines was approximately 24 h earlier compared with that of the wild-type strain (F 2,6=13·82, P=0·005; Table 3). In fact the wild-type females showed few emerging individuals on the second day of analysis and the main emerging cohort was on the third day. For both the transgenic lines, few individuals eclosed during the first day of observation, while a massive emergence occurred on the second day, and by the third day both the transgenic lines had essentially completed eclosion. An a posteriori comparison did not reveal significant differences in the eclosion profiles between the two transgenic lines (see notes to Table 3). In DD the same experiment was performed twice, giving a similar accelerated temporal eclosion profile for the transgenic lines compared with that of the wild-type. Moreover, a comparable 24 h acceleration was detected on analysing the emerging activity in males, in both 12:12 LD and DD (Fig. 5C, D).
Fig. 5. Adult eclosion in transgenic C3, T5 and wild-type synchronized cultures for 5 consecutive days in 12:12 LD and DD. Percentage of eclosion in (A) females in 12:12 LD (mean±SEM of three replicates); (B) females in DD (mean of two replicates); (C) males in 12:12 LD (mean of two replicates); (D) males in DD (mean of two replicates).
Table 3. Eclosion timing in transgenic C3 and T5 and wild-type B. mori in 12:12 LD
Score represents the mean time required to eclose in 12:12 LD (a comparison between C3, T5 and wild-type F 2,6=13·82, P=0·005; post-hoc LSD test: C3 vs T5 P=0·58, n.s.).
Number of replicates=3.
(iv) Estimation of transgenic per-IR productivity
To estimate the productivity parameters for the per KD lines, we compared the fertility of C3 and T5 transgenic females with those of wild-type, in 12:12 LD. Therefore we recorded the number of eggs laid per female in an 8 h interval, from ZT 8 to ZT 16; no significant differences between genotypes were found (F 2,69=0·59, P=0·56; Table 4). Fig. 6 shows egg-laying temporal profile for transgenic and wild-type females evaluated for four consecutive 2 h periods (ZT 8–10, ZT 10–12, ZT 12–14, ZT 14–16 intervals). The statistical analysis shows that the ‘mean oviposition time’ of both types of transgenic females was not significantly different from that of controls, over this 8 h interval (F 2, 69=1·80, P=0·17, n.s.; Table 4).
Fig. 6. Oviposition of transgenic C3, T5 and wild-type females during an 8 h interval in 12:12 LD. Percentage of oviposition (mean±SEM) of transgenic 23 C3, 29 T5 and 30 wild-type females during four consecutive periods (ZT 8–10, ZT 10–12, ZT 12–14, ZT 14–16 intervals).
Table 4. Female fertility and oviposition time in 12:12 LD
Comparison between number of laid eggs by C3, T5 and wild-type females: F 2,69=0·59, P=0·56, n.s. For each genotype, score represents an index of the temporal pattern of oviposition. It was calculated as the mean of the values obtained for each analysed female in the ZT 8–16 interval (see Section 2 for details), in 12:12 LD (comparison between C3, T5 and wild-type females score values: F 2,69=1·80, P=0·17, n.s.).
Table 5 reports the silk percentage for transgenic and wild-type males and females, calculated as the cocoon shell/whole cocoon weight ratio. Both C3 and T5 transgenic males and females showed a significant decrease in the whole cocoon weight with respect to the wild-type by ANOVA (males: F 2,87=9·2, P<0·001; females: F 2,87=4·56, P<0·01) but no significant modifications in the cocoon shell weight (males: F 2,87=0·11, P=0·89, n.s.; females: F 2,87=3·0, P=0·054, n.s.). These modifications suggest a slight but significant increment in the silk percentage for males of both the transgenic lines with respect to the wild-type (F 2,87=4·03, P<0·05). In the transgenic females no significant effect was observed (F 2,87 =1·51, P=0·23, n.s.).
Table 5. Transgenic productivity: silk percentage
4. Discussion
The 7-day-old per-IR transgenic embryos showed a significant decrease of per mRNA (in the 40–75% range) with respect to the wild-type, suggesting that the B. mori RNAi molecular machinery is active in the induction of the post-transcriptional silencing from at least approximately 24–48 h before hatching. This level of reduction is clearly not a complete knock-down and this might be due to positional effects of the insert(s) in the host B. mori genome, which might influence the Actin promoter activity in the transgene. Partial and variable mRNA KD levels were also obtained in Drosophila melanogaster, when an Actin-driven early RNA interference was induced following a similar strategy (Zordan et al., Reference Zordan, Cisotto, Benna, Agostino and Rizzo2006). The per mRNA reduction obtained in B. mori KD transgenic lines is nevertheless at least at about the level that would be expected in a heterozygous per null mutation in this species. In D. melanogaster, per +/per 01 individuals, heterozygous for the recessive per 01 null allele, show a periodicity slightly longer than normal (24·6±0·2 vs 24·0±0·1; Citri et al., Reference Citri, Colot, Jacquier, Yu, Hall, Baltimore and Rosbash1987; Dushay et al., Reference Dushay, Konopka, Orr, Greenacre, Kyriacou, Rosbash and Hall1990), revealing an apparent dosage effect. In addition, partially dominant behavioural effects due to heterozygosity for the classic mutants per s and per L1 can also be detected (Konopka & Benzer, Reference Konopka and Benzer1971; Dushay et al., Reference Dushay, Konopka, Orr, Greenacre, Kyriacou, Rosbash and Hall1990). In Bombyx mori, the per KD levels obtained in both the per-IR transgenic lines were able to detectably modify the circadian gate of egg-hatching behaviour, under entrainment conditions. There was no difference in the mean hatching time of the strains, but the variation around that time was significantly elevated in the transgenic lines, particularly C3, compared with the wild-type. These results indicate a modest disruption of the hatching rhythm when per mRNA is downregulated under these conditions, and, to our knowledge, the first direct demonstration of an association between per expression and a circadian phenotype in Lepidoptera. A much more dramatic effect on the hatching rhythm was observed with per anti-sense injection in A. pernyi (Sauman et al., Reference Sauman, Tsai, Roca and Reppert1996), but these results were later withdrawn (Sauman et al., Reference Sauman, Tsai, Roca and Reppert2000). Our data are supportive of the original results of Sauman and co-workers (Reference Sauman and Reppert1996), suggesting that their RNAi experiments in the giant silkmoth may have worked at least once. However, one inconsistency in our own work with B. mori is that the transgenic strain T5, which had the largest KD of about 75% of per mRNA, did in fact show the least disruption to the hatching gate, whereas C3, which had an approximately 40% KD, showed a more impressive spreading of the hatching gate. However, real-time PCR was performed on whole embryos before hatching, so it is quite likely that position effects between the two transgenic lines on the Actin driver may have generated a patchy distribution of per KD in the relevant cells for eclosion. Immunohistochemical examination of the PER protein levels will help to map the brain per KD target neurons in these transgenic embryos.
In addition, per mRNA KD modified B. mori developmental timing, in both 12:12 LD and DD. This appears to be a real effect of a faster growth, rather than a carry-over from the more variable eclosion gating of the transgenics, because the mean and modal values for eclosion were not significantly different. Also the eggs were collected in 2 h windows for this experiment, thereby minimizing the ‘spread’ of subsequent eclosions. In fact, we observed significant accelerations in embryonic development, the last larval moulting phase, and during pupal-adult transition, reminiscent of the effect of the per-null mutation in Drosophila (Kyriacou et al., Reference Kyriacou, Oldroyd, Wood, Sharp and Hill1990). Specifically, the last larval moult seemed to be the most sensitive developmental phase, with the strongest temporal anticipation under constant conditions. In contrast, the duration of earlier larval stages was unaffected. These data generally resemble those obtained on D. melanogaster, where different per mutations are able to modify the Drosophila developmental timing, under different environmental conditions (Kyriacou et al., Reference Kyriacou, Oldroyd, Wood, Sharp and Hill1990).
We cannot completely exclude the possibility that the phenotypic effects exhibited by our per KD B. mori lines transgenic lines can derive, at least in part, from alteration in the expression of ‘off-target’ genes. For a non-model organism such as B. mori, web-based tools are not available for planning dsRNA constructs that limit off-target effects, as for Drosophila, Caenorhabditis and mouse (Arziman et al., Reference Arziman, Horn and Boutros2005). The production and analysis of further B. mori lines, transgenic for constructs in which the IR-per involves a different per sequence, would be useful in this respect. Nevertheless, it would be an extreme coincidence if the results that we have obtained with B. mori, which so nicely parallel those for D. melanogaster, were due to such non per-specific targeting of the dsRNAi construct.
In Drosophila, per is expressed in all developmental stages and the translocation of PER protein from cytoplasm to nucleus is fundamental for the ticking of the endogenous clock (Hall, Reference Hall2003). In B. mori, the per gene is actively transcribed in larva, adult, testes and ovaries (Iwai et al., Reference Iwai, Fukui, Fujiwara and Takeda2006). Here, we have demonstrated per mRNA expression during embryogenesis. PER cellular localization has been investigated in the B. mori adult brain and PER-like signals have been detected in the cytoplasm of different neuronal populations of dorsolateral protocerebrum, which represent the conserved site of the circadian clock for many insects (Sehadova et al., Reference Sehadova, Markova, Sehnal and Takeda2004; Zavodska et al., Reference Zavodska, Sauman and Sehnal2003). In addition, PER staining was also observed in some neurons of the pars intercerebralis and in nerve fibre arborizations in the corpora cardiaca and corpora allata, organs involved in moulting and metamorphosis (Sehadova et al., Reference Sehadova, Markova, Sehnal and Takeda2004). In A. pernyi, the dorsolateral PER-expressing neurons of each hemisphere are very close to, and probably communicate with, two neurons expressing the prothoracicotropic hormone (PTTH), a fundamental neuropeptide regulating post-embryonic development in Lepidoptera (Sauman & Reppert, Reference Sauman and Reppert1996). After release from axonal projections in the corpora allata, PTTH induces the production and secretion of ecdysone in the prothoracic gland. Ecdysone, together with juvenile hormone (JH) of the corpora allata, regulates moulting phases and metamorphosis (Bollenbacher & Granger, Reference Bollenbacher, Granger, Kerkut and Gilbert1985; Mizoguchi & Kataoka, Reference Mizoguchi and Kataoka2005). PTTH-expressing neurons with position and projection patterns similar to those of A. pernyi have been identified in B. mori fifth instar larval brains (Kawakami et al., Reference Kawakami, Kataoka, Oka, Mizoguchi and Kimura-Kawakami1990; Dai et al., Reference Dai, Mizoguchi, Satake, Ishizaki and Gilbert1995). These observations in B. mori suggest possible pathways of connections between PER- and PTTH-expressing neurons that may be important in the control of PTTH release during development. In addition, the PER-positive arborizations to the corpora allata may indicate a PER regulatory activity on JH levels. The effect of a general per KD on developmental timing might therefore be explained by a modification in the humoral equilibrium during development. Moreover, the diverse sensitivity of the different developmental stages to per mRNA depletion might be explained by hypothesizing a variable efficiency of per RNAi due to variations in the levels of per-IR insert transcription or in the RNAi activation during development. Alternatively, we might assume that the different developmental stages are characterized by different sensitivities to humoral modifications caused by per mRNA depletion.
Taken together, these results suggest that the clock gene period is involved in the control of similar developmental processes in different species. Recent studies also demonstrate a similar dual function of mPer in mammals, the genetic disruption of mPer (1 and 2) in mice causing a total loss of circadian rhythmicity, premature ageing, and an enhancement of a neoplastic phenotype (Fu et al., Reference Fu, Pelicano, Liu, Huang and Lee2002; Chi Lee, Reference Chi Lee2006). At a practical level, the reduction in developmental time induced in B. mori by per KD does not compromise female egg productivity or the egg-laying temporal profile. In addition, it does not alter the cocoon silk percentage compared with that of the polyvoltine wild-type Nistari strain. Both female fertility and cocoon silk percentage are considered to represent productivity parameters in sericulture, so maintaining their integrity in these transgenic lines is rather encouraging. Perhaps transfer of the per dsRNAi construct into a monovoltine line (which has different hormonal regulation and longer developmental profile in comparison with a polyvoltinerian), may enhance the effect of per dsRNAi. Consequently per mRNA depletion via per KD transgenesis in B. mori may provide a viable commercial strategy to improve the efficiency of rearing, without affecting silk productivity in either mono- or polyvoltine strains. Finally, another application of per dsRNAi may be in the selective transfer of the above-described per construct onto the W sex chromosome. As the silkworm female sex karyotype is ZW, while that of the male is ZZ, the faster development of female larvae may result in an easier and earlier separation of the two sexes, which could reduce the laborious operation of pupal sexing in order to obtain crosses for silkworm egg production.
L. C. and R. C. acknowledge grants from Ministero delle Politiche Agricole, Alimentari e Forestali (D.M. 513/7303/03 del 22/10/2003 – Progetto finalizzato: Nuove tecnologie per il rilancio della gelsi-bachicoltura italiana). R. C. and C. P. K. acknowledge financial support from the European Community (EC-Biotechnology programme ERB-B104-CT960096 and the Sixth Framework Project EUCLOCK No. 018741) and Ministero dell'Università e della Ricerca Scientifica e Tecnologica/British Council. R. C. also acknowledges grants from the Ministero dell'Università e della Ricerca and the Italian Space Agency, DCMC grant and C. P. K. the Royal Society for a Wolfson Research Merit Fellowship. L. C. and R. C. are particularly grateful to Dr Gérard Chavancy (Unité Nationale Séricicole – France) and his staff for providing the Nistari strain and technical training concerning DNA injection into silkworm embryos. Special thanks go also to Dr Yukio Tanaka, National Institute of Genetics and Breeding (Japan), and Dr Yutaka Banno, Institute of Genetic Resources, Kyushu University Graduate School of Bioresource and Bioenvironmental Sciences (Japan), for their support of S. C.