


1. Introduction
Effective population size (N e) is a crucial parameter in population genetics. It plays a vital role in studying the mutation rate, recombination rate, selection pressure and genetic diversity (Palstra & Ruzzante, Reference Palstra and Ruzzante2008; Charlesworth, Reference Charlesworth2009). Recent estimates based on linkage disequilibrium (LD) indicated that the effective population size of humans is much less than the previous estimates and the usually quoted value of 10 000 (Tenesa et al., Reference Tenesa, Navarro, Hayes, Duffy, Clarke, Goddard and Visscher2007). It has been suggested that the differences resulted from the different timescales and methods in N e estimation. The fluctuation of N e is important and the estimated harmonic mean (N e) tends to be dominated by the smallest N e (Hartl & Clark, Reference Hartl and Clark2007). Therefore, both long-term and short-term estimates of N e are important for understanding evolution, and estimating the N e of the current population could be an important step towards studying various past N e values.
There are three different kinds of effective population size based on measuring magnitude: (1) the change in probability of identity by descent (inbreeding effective size); (2) the change in variance in allele frequency (variance effective size); and (3) the rate of loss of heterozygosity (eigenvalue effective size) (Hartl & Clark, Reference Hartl and Clark2007). Various estimation methods have been developed to determine effective population sizes (Wang, Reference Wang2005; Waples, Reference Waples2005; Nomura, Reference Nomura2009), many of which have proven useful for estimating the short-term N e. The temporal method was developed based on the properties of the variance of gene frequency changes (Nei & Tajima, Reference Nei and Tajima1981; Waples, Reference Waples1989). This method requires the collection of at least two samplings of a population, which would usually be more difficult than collecting a single sampling of a population. Therefore, two particular short-term methods, the LD method (Hill, Reference Hill1981) and the heterozygote-excess method (Pudovkin et al., Reference Pudovkin, Zaykin and Hedgecock1996), were examined in this study, which can estimate N e from a single sampling of a population.
Recent advances in genetic technologies have enabled the N e estimation of human populations using LD (Tenesa et al., Reference Tenesa, Navarro, Hayes, Duffy, Clarke, Goddard and Visscher2007). The estimation of N e from LD is primarily based on the tightly linked loci and requires the separate or concurrent estimation of recombination rates. However, the N e estimation using unlinked loci could be more useful, because it could provide more precise estimates without having to estimate recombination rates and could be useful for studying population history (Hill, Reference Hill1981; Waples, Reference Waples2005). In reality, unlinked loci provide the very recent information on N e, which involves only current and several previous generations based on the Wright–Fisher model due to the fast decay of LD (Waples, Reference Waples2005). The previous methods, using linked or unlinked loci, were based on two-locus inbreeding descent measures (Weir & Cockerham, Reference Weir and Cockerham1969; Cockerham & Weir, Reference Cockerham and Weir1973), from which the N e estimate was the inbreeding effective population size. This study is focused primarily on the variances of allele and haplotype frequencies generated during random mating and sampling of a population, deriving different equations for estimating the variance effective population size from the previous methods for the inbreeding effective population size.
The heterozygote-excess method, useful for estimating a small N e, is based on the differences of allele frequencies in males and females (Pudovkin et al., Reference Pudovkin, Zaykin and Hedgecock1996; Luikart & Cornuet, Reference Luikart and Cornuet1999; Nomura, Reference Nomura2009). As summarized previously (Wang, Reference Wang2005), genetic drift generates not only the heterozygote-excess but also deviations from the Hardy–Weinberg equilibrium (HWE), which enables the N e estimation of the current generation. These estimations result in the variance effective size, and could be comparable with the variance effective size based on LE. In this study, the N e estimations for current and recent generations were conducted based on these two, newly developed methods for various populations provided by the HapMap consortium. Then, they were compared with the actual census of human population.
2. Methods
(i) Data
The HapMap Phase III genotype data from the HapMap project were used for the estimations (International HapMap Consortium, 2003, 2005; Frazer et al., Reference Frazer, Ballinger, Cox, Hinds, Stuve, Gibbs, Belmont, Boudreau, Hardenbol, Leal, Pasternak, Wheeler, Willis, Yu, Yang, Zeng, Gao, Hu, Hu, Li, Lin, Liu, Pan, Tang, Wang, Wang, Yu, Zhang, Zhang, Zhao, Zhou, Gabriel, Barry, Blumenstiel, Camargo, Defelice, Faggart, Goyette, Gupta, Moore, Nguyen, Onofrio, Parkin, Roy, Stahl, Winchester, Ziaugra, Altshuler, Shen, Yao, Huang, Chu, He, Jin, Liu, Sun, Wang, Wang, Xiong, Xu, Waye, Tsui, Xue, Wong, Galver, Fan, Gunderson, Murray, Oliphant, Chee, Montpetit, Chagnon, Ferretti, Leboeuf, Olivier, Phillips, Roumy, Sallee, Verner, Hudson, Kwok, Cai, Koboldt, Miller, Pawlikowska, Taillon-Miller, Xiao, Tsui, Mak, Song, Tam, Nakamura, Kawaguchi, Kitamoto, Morizono, Nagashima, Ohnishi, Sekine, Tanaka, Tsunoda, Deloukas, Bird, Delgado, Dermitzakis, Gwilliam, Hunt, Morrison, Powell, Stranger, Whittaker, Bentley, Daly, de Bakker, Barrett, Chretien, Maller, McCarroll, Patterson, Pe'er, Price, Purcell, Richter, Sabeti, Saxena, Schaffner, Sham, Varilly, Stein, Krishnan, Smith, Tello-Ruiz, Thorisson, Chakravarti, Chen, Cutler, Kashuk, Lin, Abecasis, Guan, Li, Munro, Qin, Thomas, McVean, Auton, Bottolo, Cardin, Eyheramendy, Freeman, Marchini, Myers, Spencer, Stephens, Donnelly, Cardon, Clarke, Evans, Morris, Weir, Mullikin, Sherry, Feolo, Skol, Zhang, Matsuda, Fukushima, Macer, Suda, Rotimi, Adebamowo, Ajayi, Aniagwu, Marshall, Nkwodimmah, Royal, Leppert, Dixon, Peiffer, Qiu, Kent, Kato, Niikawa, Adewole, Knoppers, Foster, Clayton, Watkin, Muzny, Nazareth, Sodergren, Weinstock, Yakub, Birren, Wilson, Fulton, Rogers, Burton, Carter, Clee, Griffiths, Jones, McLay, Plumb, Ross, Sims, Willey, Chen, Han, Kang, Godbout, Wallenburg, L'Archeveque, Bellemare, Saeki, An, Fu, Li, Wang, Wang, Holden, Brooks, McEwen, Guyer, Wang, Peterson, Shi, Spiegel, Sung, Zacharia, Collins, Kennedy, Jamieson and Stewart2007; Altshuler et al., Reference Altshuler, Gibbs, Peltonen, Dermitzakis, Schaffner, Yu, Bonnen, de Bakker, Deloukas, Gabriel, Gwilliam, Hunt, Inouye, Jia, Palotie, Parkin, Whittaker, Chang, Hawes, Lewis, Ren, Wheeler, Muzny, Barnes, Darvishi, Hurles, Korn, Kristiansson, Lee, McCarrol, Nemesh, Keinan, Montgomery, Pollack, Price, Soranzo, Gonzaga-Jauregui, Anttila, Brodeur, Daly, Leslie, McVean, Moutsianas, Nguyen, Zhang, Ghori, McGinnis, McLaren, Takeuchi, Grossman, Shlyakhter, Hostetter, Sabeti, Adebamowo, Foster, Gordon, Licinio, Manca, Marshall, Matsuda, Ngare, Wang, Reddy, Rotimi, Royal, Sharp, Zeng, Brooks and McEwen2010), which included the original and expanded HapMap samples. The original HapMap samples were collected from four geographically diverse populations: the Yoruba in Ibadan, Nigeria (YRI); Japanese in Tokyo, Japan (JPT); Han Chinese in Beijing, China (CHB); and the CEPH (USA Utah residents with ancestry from northern and western Europe, CEU). And, additional samples were collected from seven populations: Maasai in Kinyawa, Kenya (MKK); Luhya in Webuye, Kenya (LWK); Chinese in metropolitan Denver, CO, USA (CHD); Gujarati Indians in Houston, TX, USA (GIH); Tuscans in Italy (TSI); African ancestry in the southwest USA (ASW); and Mexican ancestry in Los Angeles, CA, USA (MEX). The ASW, CEU, MEX, MKK and YRI were family samples, and only the parents were used in this data analysis (indicated as ASWp, CEUp, MEXp, MKKp and YRIp, respectively). A total of 988 samples were analysed, and the sample number of each population was indicated in Table 1. For the accuracy of estimates, single nucleotide polymorphisms (SNPs) with minor allele frequencies greater than 0·4 and without missing data were selected for analysis.
Table 1. Simulated r 2 from different effective population sizes compared with the expected values calculated from eqn (1) (10 000 SNP pairs were simulated; *: calculated from the expected r 2, assuming N e to be constant).
(a) When Ne was constant (the simulated estimates were obtained after 10 initial generations).
(b) When N e was changed from N e1 to N e2 (the simulated estimates were obtained after 10 initial generations with N e1).
(c) When N e was changed from N e1 to N e5 (the simulated estimates were obtained after five initial generations with N e1).
(ii) N e estimation based on unlinked loci between different chromosomes
The LD observed between different chromosomes comes almost entirely from random mating and sampling of populations. In this study, the LD indicates r 2, the correlation coefficient of gene frequencies. For the completely unlinked loci in different chromosomes, if ideal Wright–Fisher population assumptions are held in a population, the variances due to genetic drifts are the only factors for LD between different chromosomes. In diploids, four different mating structures could be considered: (1) monoecious with selfing; (2) monoecious without selfing; (3) dioecious with random pairing (equal number of males and females); and (4) dioecious with a hierarchical mating structure (Weir & Hill, Reference Weir and Hill1980). The r 2 based on descent measures was the same for (1), (2) and (3) in the previous study (Weir & Hill, Reference Weir and Hill1980). The difference between monoecious and dioecious is the division of a population into two separate genders. Because half of the population is assigned to a certain gender randomly, there are negligible actual differences in estimates unless the gender ratios differ. And, if there is no preference for selfing, a monoecious population with selfing does not provide a different r 2 from a monoecious population without selfing. Simulations in this study also indicated that (1), (2) and (3) produced the same result. Therefore, for simplicity, the monoecious with selfing was considered to derive the relationship between N e and r 2.
Each generation is discrete. Let N ec be the population size of the current generation, and let N ep be the population size of the previous generation. The population sampling procedure from one generation to the next is simplified as: (1) sampling of 2N ec individuals from N ep; (2) generating gametes from each individual of selected 2N ec; and (3) random pairing of the generated gametes. The expected r 2 due to random sampling of population (N) is 1/(2N) if each gamete can be observable and there is no disequilibrium (Weir, Reference Weir1996). It should be noted that diploidy gives additional randomness to the existing LD when sampling proceeds for unlinked loci. This is because the randomly paired gametes in N individuals generate variable haplotype frequencies instead of the expected haplotype frequencies from allele frequencies. For example, the haplotype frequency of AB is not the multiplication of the allele frequency of A and B. Therefore, sampling from N individuals provides additional departure from LE with the value of 1/(2N).
When sampling of 2N ec individuals from N ep, the additional departure from the existing r 2 is 1/(2N ep). For unlinked loci, each locus act independently, and the original LD and the randomness from previous generation are reduced by a quarter during gamete transmission. In addition, the 2N ec gametes generated from selected 2N ec individuals are randomly paired to make N ec individuals in the current generation, providing departure from LE (1/(2N ec)). Therefore, the LD between loci in different chromosomes is dependent on the effective population size of current and previous generations as well as the LD at the previous generation as indicated in eqn (1), in which r 02 is the LD of the previous generation, N ep and N ec represent the effective size of the previous and current generation, respectively, and c is 0·5. When the population sizes are constant for each generation, r 2 0 becomes equal to the expected r 2 and can be expressed as 5/(6N e):
Due to the same reason indicated in the explanation of the population sampling procedure, when the n samples were selected from a population, the expected LD in the sampling population was not exactly zero. Therefore, due to randomly paired gametes for two independent loci in each individual in the sampling population, 1/(2N ec) should be added to the original LD of the population as sampling variances. During the inference of haplotypes from genotypes, the maximum-likelihood estimation of haplotype frequencies makes the variances due to sampling of 1/n instead of 1/(2n) (Hill, Reference Hill1974; Weir & Hill, Reference Weir and Hill1980; Hill, Reference Hill1981). Therefore, sampling provides an additional 1/(2N ec)+1/n to the original r 2 in eqn (1). In this case, assuming a constant effective population size of N, the expected r 2 is 4/(3N)+1/n. This approach provides an N e estimate that is four times larger than the inbreeding N e estimate using unlinked loci (Hill, Reference Hill1981; Waples, Reference Waples2006). The r 2 of SNPs in different chromosomes in each HapMap population were calculated based on the parallelized C++ code.
(iii) N e estimation based on HWE
Similar to the estimation of N e based on LD between unlinked loci, the deviations from HWE through genetic drift provide information on effective population size. The estimation of deviation is intrinsically similar to the asymptotic HWE tests (Weir, Reference Weir1996). In the HWE tests, the chi-squared distribution is entirely based on the sample number and the disequilibrium coefficient; however, it actually includes genetic drift of the population as well as the sampling. Due to the random mating of population, the deviation from HWE depends only on the current population. Therefore, through approximations, eqn (2) applies to the estimation of the current effective population size
In the HapMap data, the SNPs that deviated from the HWE for a significance level of 0·001 were removed (2005). However, in this study, all of the data should be used for estimating N e. Therefore, corrections were necessary for the missing data, most of which might naturally deviate from the HWE due to the distributional property. To find the proportion of the mean of the data for the significance level higher than 0·001 to the mean of the total data, simulations were conducted by generating random numbers based on the chi-squared distribution as much as the number of total SNPs used for the estimation. The simulations were repeated 1000 times, and yielded the correction term, 0·9873 using the R statistical package (R Foundation for Statistical Computing, Vienna, http//www.R-project.org). Although the exact tests were conducted for the quality control of the HapMap data (International HapMap Consortium, 2005), the exact test and the asymptotic test showed similar results when the minor allele frequency was high and/or the sample size was large enough (Vithayasai, Reference Vithayasai1973; Hernandez & Weir, Reference Hernandez and Weir1989; Wigginton et al., Reference Wigginton, Cutler and Abecasis2005). Thus, the actual cut-offs were the same for the smallest samples (49 for the parents of ASW and 50 for the parents of MEX), when the minor allele frequencies were higher than 0·4. Therefore, the simulations were based on an asymptotic chi-squared distribution. The deviations from the HWE were also calculated using the parallelized C++ code along with the r 2 calculations.
(iv) Simulation and errors
The derived eqn (1) becomes clearer in simulation studies. The simulation was conducted with 10 000 diallelic loci for various population sizes. The alleles for each locus at the initial generation were generated by binomial draw on the allele frequencies of 0·5, and random mating of the population proceeded for 5–10 generations after the initial generation of the population. The population sampling procedure was the same as that previously described for estimating N e based on unlinked loci between different chromosomes. Similar to the previous notation, let N ep be the population size at the previous generation and N ec be the size at the current generation. First, 2N ec individuals were selected from N ep individuals for mating. Second, from each of the 2N ec individuals, one transmitting gamete was generated. Since each locus is independent, random selection of one allele between two alleles from each locus in an individual was conducted. Third, random pairings of the gametes generated N ec individuals. At the sixth or eleventh generations, the r 2 of the population was determined based on 49 995 000 pairs of loci for a simulation. The unequal gender ratios in a population were tested by dividing the N individuals randomly at each generation into two genders in fixed proportions.
As shown in Table 1, the simulated mean of LD with 10 000 SNP pairs was almost same as the expected mean of LD. In Table 1(a), the N e estimates were similar to the actual N e. When N e fluctuated, it would not be possible to estimate N e at each generation. In the case of Table 1(b) and (c), the current N e was mostly reflected in the mean r 2, and recent changes of N e were also reflected. Therefore, it could be used to infer the current and recent effective population sizes. The simulations also revealed that the mean of subtractions from the sampled r 2 to the original r 2 gives approximately 1/(2N ec)+1/n. The same simulations were conducted for population sampling procedures, and then the sampling of n individuals among N ec individuals was conducted. From the sampled genotypes, the haplotype frequencies for two loci were estimated based on the expected maximisation (EM) algorithm. For each simulation of 1000 or higher, the original r 2 and the sampled r 2 were collected, and the mean of the subtraction between the values was examined.
The square roots of mean-squared errors were obtained from simulations for the population size of 1000 and several sample sizes. The same procedure previously described was repeated for this simulation. Simulations were repeated 100 times for 10 000 polymorphisms to get the mean-squared errors, which provided 10 000 results for the deviation from HWE and 49 995 000 results for the deviation from LE in each simulation. The samplings with replacement and the constant N e were applied. The N e estimates from the simulations were subtracted from the actual N e, and the square roots of mean-squared errors were obtained. As summarized in Table 2, the square roots of the mean-squared errors were smaller for the N e estimates using the deviation from LE than the estimates using the deviation from HWE. Sample sizes were critical for reducing mean-squared errors. Increasing the number of polymorphisms helped in reducing the errors to a certain extent, but the simulation numbers had very little influence. These results indicated that the interpretation of results acquired with small sample sizes should be conducted with caution. All the simulations in this study were executed using the R statistical package with additional C++ coding of the core computation. The generation of every random number was based on the R statistical package.
Table 2. Square root of mean-squared errors (SRmse) from 100 simulations with 10 000 polymorphisms and a population size of 1000
3. Results
In this study, two methods were proposed for estimating the variance effective population size, based on the deviation from linkage equilibrium (LE) and the deviation from the HWE. The estimate of the variance effective size using the deviation from LE was fourfold larger than the previous estimate of inbreeding effective size. Simulation studies exhibited excellent agreement between the estimates produced by the simulations and the theoretically expected values (Table 1). Unequal gender ratios reduce N e estimates using LE, but, as the ratio increased, the estimates became larger than 4MF/(M+F), in which M is the number of males and F is the number of females. There was no difference in N e estimates using HWE depending on gender ratios. More studies would be necessary for determining the effects of the gender ratios on these estimates. As shown in Table 2, if the sample sizes are not large enough, there are considerably large errors in the estimates, especially for the estimate using the deviation from HWE.
These new methods were used to estimate the effective population size of current human populations using the HapMap data. As summarized in Table 3, the estimated effective population sizes were varied (ranging from 622 to 10 437), depending on population and estimates. Since the sample sizes in the HapMap data were small, there were many chances for errors to occur in the estimates. However, the errors in the N e estimates from LE were relatively small enough to allow the approximate determination of the true N e, and, overall, the estimates from LE were similar to the estimates from HWE. Therefore, the estimates in this study could be reliable enough to interpret the results. There were three pairs of cryptic relatedness in the samples of YRIp and CEUp, one pair in YRIp and two pairs in CEUp (International HapMap Consortium, 2005). The relatedness could increase the departure from HWE, and decrease the N e estimate. However, estimates of both YRIp and CEUp based on HWE were higher than other estimates in this study. More detailed studies are needed to explain the effects further.
Table 3. Estimated effective population sizes from the mean of LD coefficients between different chromosomes (Mean r 2) and the mean disequilibrium coefficient of the HWE ( M dc); (N ei: inbreeding effective population size; N e: variance effective population size estimated from LE; N ec: variance effective population size based on the deviation from HWE; ASWp: African ancestry in the southwest USA; CEUp: USA Utah residents with ancestry from northern and western Europe; CHB: Han Chinese in Beijing, China; CHD: Chinese in metropolitan Denver, CO, USA; GIH: Gujarati Indians in Houston, TX, USA; JPT: Japanese in Tokyo, Japan; LWK: Luhya in Webuye, Kenya; MEXp: Mexican ancestry in Los Angeles, CA, USA; MKKp: Maasai in Kinyawa, Kenya; TSI: Tuscans in Italy; YRIp: the Yoruba in Ibadan, Nigeria)
In Table 3, three populations, CEUp, TSI and YRIp, showed relatively large N e, whereas ASWp, LWK, MEXp and MKKp showed relatively small N e. The polygamy culture could be responsible for the small N e in the Maasai and Luhya population (Nomura, Reference Nomura2005). ASWp and MEXp might be admixed populations, and a recent study indicated that N e estimation is often underestimated when subpopulations differ substantially in allele frequencies when the temporal method is used (Araki et al., Reference Araki, Waples and Blouin2007). It is likely that the current method could show a similar effect due to the admixture between two different populations. In addition, MEXp and ASWp were immigrants, whose populations might historically have experienced a bottleneck before or after immigration. In order to understand correctly, more studies are needed to determine the reason for the large N e values of the three populations of CEUp, TSI and YRIp as well as others.
Both CHB and CHD originated from China, and had Han Chinese ancestors. Both estimates of these two samples showed similar N e values. In contrast, LWK and MKKp samples were selected from Kenya, but showed different N e estimates. Individuals from CHB and CHD were unrelated and had at least three out of four Han Chinese grandparents, but MKKp and LWK differed in their ethnic groups, i.e. MKKp samples were the parent group of family data in which each individual had four Massai grandparents and LWK samples were unrelated individuals who identified themselves as having four Luhya grandparents. As such, the age group, as well as ethnicity, of MKKp differed from LWK because individuals of MKKp were the parent group. The differences found between MKKp and LWK are likely to be due to differences in age, ethnicity and/or culture (especially marriage). Particularly, it should be noted that each African ethnic group is known to practice specific marriage customs, including polygamous patterns, which could influence N e to a great extent.
The estimates based on HWE presented the effective population size of the current generation, and the estimates based on LE indicated the N e of current and recent generations. Therefore, the N e based on HWE can be compared with the estimates based on LE to examine recent population changes. Most populations showed increased N e values for current generations compared to the N e estimates based on LE, which generally agreed with the recent population growth of humans. The increment was largest in MEXp, with a ratio of 2·77, and CEUp (1·96), GIH (1·68), MKKp (1·60) and YRIp (1·52) also showed relatively high ratios. The JPT sample showed a significantly decreased N e value in the current generation. Since Japan is a highly aging society and has the nearly lowest and declining birth rates among countries, this estimation result might be reasonable.
As indicated by the HapMap consortium, the population data do not represent any specific nation or ethnic group. Nevertheless, the HapMap samples were selected from specific regions of countries with specific criteria, and they could at least partially represent the population of the country. To compare and examine the approximate reliability of the current methods, census data were examined. The possibly relevant United Nations (UN) census data were summarized in Fig. 1 (UNSD, 2010). Due to the policy guiding HapMap data construction (International HapMap Consortium, 2004), all members of the HapMap family data were adults only. As such, 1980 could be the most reproducibly representative year for the parent group, whose samples were collected in 2000, and 1950 could be the most reproductive year for the parent group of those parents. The year 2000 could be the best representative year for unrelated individuals who are all adults, and 1970 could be the most representative year for their parent groups. The completely tabulated censuses were used exclusively, with the exception of one U.S. (United States of America) data set for the female to male ratio in 1970. If the census for the targeted year did not exist for a particular country, the closest year was selected for use.
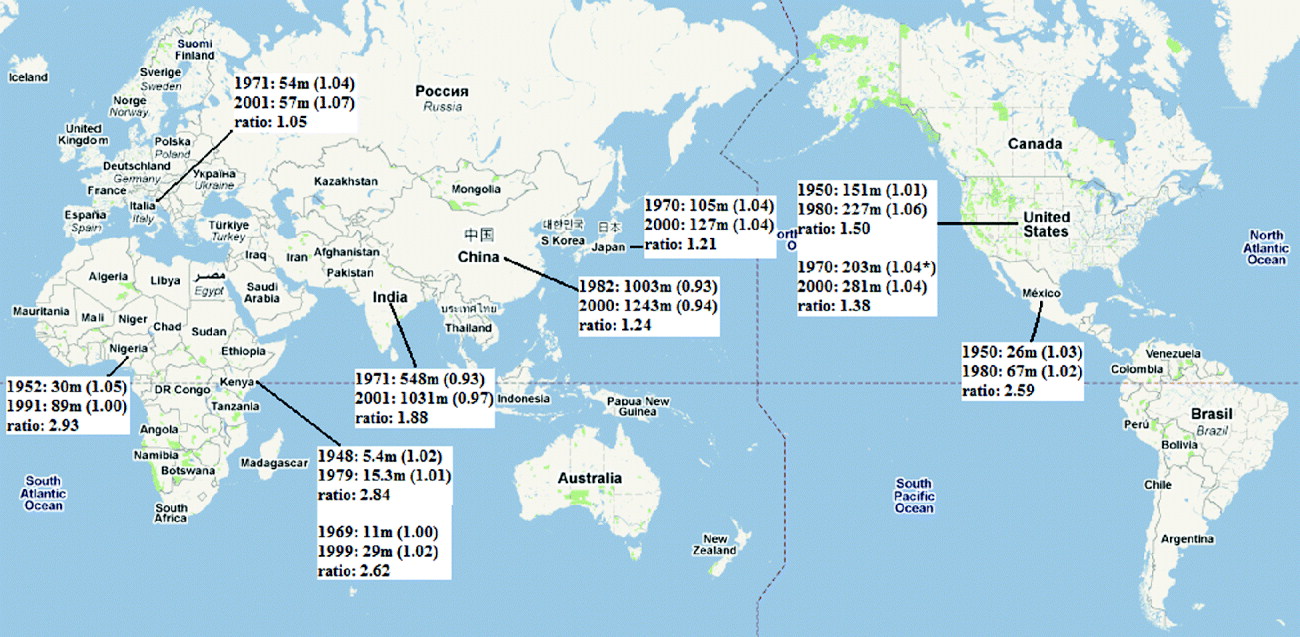
Fig. 1. World Population Census from the United Nations Statistics Division Demographic Statistics (Parenthesis: female to male ratio; *: estimates, not the complete census; the map was obtained through the courtesy of Google Maps). The studied populations were listed below, and the relevant population censuses were indicated in the parenthesis: ASWp: African ancestry in the southwest USA (1970–2000 in USA); CEUp: USA Utah residents with ancestry from northern and western Europe; CHB: Han Chinese in Beijing, China (1982–2000 in China); CHD: Chinese in metropolitan Denver, CO, USA (1982–2000 in China and 1970–2000 in USA); GIH: Gujarati Indians in Houston, TX, USA (1971–2001 in India and 1970–2000 in USA); JPT: Japanese in Tokyo, Japan (1970–2000 in Japan); LWK: Luhya in Webuye, Kenya (1969–1999 in Kenya); MEXp: Mexican ancestry in Los Angeles, CA, USA (1950–1980 in Mexico and 1950–1980 in USA); MKKp: Maasai in Kinyawa, Kenya (1948–1979 in Kenya); TSI: Tuscans in Italy (1971–2001 in Italy); YRIp: the Yoruba in Ibadan, Nigeria (1952–1991 in Nigeria).
The listed population sizes in Fig. 1 represent the total population. The most appropriate actual population number comparable to N e would be the number of adults, which includes breeding and senescent adults (Frankham, Reference Frankham2007). However, the HapMap data themselves do not represent the population of specific countries, and there are problems in determining the appropriate age range for the adult groups, which might differ depending on culture. In addition, there are many missing age-classified data in the UN population census data. Therefore, in this study, approximate comparisons based on the total census population were conducted. Since unequal gender ratios influence N e estimations, the gender ratios of each country were also examined; however, there were no significant deviations in the gender ratios.
As expected, the N e estimates using HapMap data did not correlate well with the population size of the countries in which the corresponding HapMap samples were collected. For an example, the CHB and JPT samples showed similar N e estimates, even though China has almost 10 times more population than Japan. This might be due to the fact that the collected samples are not the representative population of a country. They are a partial, limited selection of the population. The correlation between N e based on LE and real population data was better at 0·15 for the previous generation and 0·14 for the current generation of real human population than the correlation between N e based on HWE and real population data, which showed almost no correlation. This could be due to the higher errors in the estimates based on HWE. These discordances might arise from the fact that the samples may not be the representative population of the country, because the samples were collected based on specific regions and ethnicity.
A higher correlation of 0·5 was observed between the ratios of estimates of N e based on HWE to N e based on LE and the ratios of current population size to the population size of previous generation. The increment of N e of ASWp and CEUp data was determined to represent the population growth of the U.S. roughly well, because these people had resided in the U.S. for a relatively long period of time. Other populations collected in the U.S. that originated from other countries (CHD, GIH and MEXp) showed trends that were more similar to their nations of origin, agreeing with the fact that their immigration was relatively recent.
CEU samples were collected in 1980 to carry out studies on the human genome using large sibships (Dausset et al., Reference Dausset, Cann, Cohen, Lathrop, Lalouel and White1990; Cann, Reference Cann1992). Therefore, the active reproductive period could be anticipated to be 1950 for the selected grandparents and 1920 for the great grandparents, the data that were not listed in the UN data. The U.S. Census Bureau indicated that the U.S. population in 1920 was 106 million and, in 1950, 151 million (U.S. Department of Commerce, 2010). The number in 1950 is slightly different from the UN data. Since the increment ratio was determined to be 1·43, the larger difference between two N e estimates of CEUp than the actual population change might not be due to the difference of time. Large families were the target of the CEPH collection, and the mean sibship size for initially collected families was 8·3. It is possible that these families could have been larger than the average for several recent generations, and these large family sizes could influence the N e estimation.
4. Discussion
This study provides new potentially useful methods for estimating the effective population sizes of current and/or recent generations from genetic data. The estimates were more similar to the estimates from LD, which ranged approximately from 3100 to 7500 (Tenesa et al., Reference Tenesa, Navarro, Hayes, Duffy, Clarke, Goddard and Visscher2007), than the estimate from nucleotide diversity, which was 10 400 (Yu et al., Reference Yu, Jensen-Seaman, Chemnick, Ryder and Li2004). The estimates using LD were based on the same HapMap database used in this study, although larger sample sizes were used in this study and the estimated time point was closer to this study than the estimates from nucleotide diversity. Compared to the previous estimates based on LD (Tenesa et al., Reference Tenesa, Navarro, Hayes, Duffy, Clarke, Goddard and Visscher2007), CHB and JPT showed similar estimates, but YRI and CEU were slightly different in this study. The estimates based on LD were the inbreeding N e, but the current estimates based on LE were the variance N e. It should be noted that, for unlinked loci, the variance N e is four times larger than the inbreeding N e, as indicated in the Method section. More studies would be necessary to compare the N e estimates based on LE in this study to the inbreeding N e estimates.
As shown in Table 2, the increase of sample sizes dramatically reduced the errors. With sufficient sample sizes, the methods suggested in this study would be very useful. As the sample size increased, the N e estimates from LE increased to converge into the actual population size, but the N e estimates from HWE decreased to converge into the actual population size. This indicated that there might be intrinsic bias in sampling similar to the previous study for the inbreeding N e estimation using unlinked loci (Waples, Reference Waples2006). Further studies could reduce the bias. The simulated and real distributions of deviations from HWE and LE looked like a chi-squared distribution with one degree of freedom, although the scales differed. There were small deviations in most of the Quantile–Quantile plots between the observed or simulated values and the random numbers that were generated based on the chi-squared distribution. However, more studies might be needed to understand their exact distributional properties and to correctly interpret the estimates. For estimates based on HWE, non-random mating induces more or less deviations from the expected values. When there are epistatic effects between unlinked loci, more LD than expected values would be observed. These effects should be studied carefully based on theoretical explanations of the distribution and real data with sufficiently large sample sizes.
In Table 3, the N e estimates of both CHB and CHD indicated that there was a slight decrease in the N e at the current generation. The one-child policy was introduced in China in 1978, and the CHB samples were collected in 2000. If the samples included young individuals in their early 20s, the decreased N e of CHB could be observable. Immigration to U.S. from China increased until 2001 (U.S. Immigration and Naturalization Service, 2001), and the individuals are more likely to have been born in China. The less decreased N e of CHD could also be the result of the one-child policy, and the effect might be smaller. A very slight decrease in LWK population could be explained by the pandemic of HIV/AIDS in Kenya, experiencing one of the world's harshest HIV/AIDS epidemics, in which the prevalence peaked at 13·4% in 2000 (National AIDS/STD Control Programme (NASCOP), 2006) . Webuye, Kenya is an urban region in which big roads penetrate. Webuye is located near the region where the high prevalence of AIDS occurred (UNAIDS, 2004), and these roads provided easy access to the city and its people by those who were infected with AIDS (UNGASS, 2008). However, Kinyawa is a rural area, and the Maasai people have preserved their traditional lifestyle, having possibly less contact with outsides. Those conditions could have protected somewhat from HIV infections, possibly resulting in the increased N e estimate at the current generation.
By drawing comparisons with real population data, the methods applied in this study were confirmed to be useful since they generally agreed with real population growth or could be explained historically or sociologically. However, considering the high errors in the estimates, a more systematic, large-scale study design would be necessary for studying the relationship between the effective population size and the actual population size, based on selecting the most representative samples. For further application to population genetic studies, such as population history, more accurate estimates of effective population sizes would be helpful, involving adjustments for the minor contributions of non-random mating, family structure, unequal gender ratios and/or other possibly contributing factors. Caution should be applied when interpreting the estimates obtained in this study. First, sample sizes were small, and there is the possibility of substantial errors in the estimates. Second, although corrections were applied, the analysed HapMap data were composed of data that excluded the SNPs that deviated from the HWE. Third, the HapMap samples do not represent any particular populations. To study precise human demographic history or human genome evolution, an elaborate research design would be necessary. Nevertheless, it is expected that the current estimation approaches would be useful for revealing various population genetic aspects of diverse species based on well-designed research.
Small sample sizes compared to population size would be a universal problem in most studies including this one, and the current method could still provide more accurate estimates since it has less dependency on other population genetic parameters that are usually unknown. Because many previous estimates required the estimation of additional parameters, such as the recombination rate and the mutation rate, the current methods are advantageous since they have nearly no dependence on other population genetic parameters. The methods in this study can also be applied to the estimation of the effective population sizes of endangered species. By obtaining the N e of both current and recent generations from a single cohort sample, the status of the target species can obviously be observed. Moreover, the independence of the other population genetic parameters enables the estimation of other interested population genetic parameters by applying the estimated effective population size.
The author greatly appreciates the reviewers’ comments, which critically improved the quality of this study. This work was supported by the Korea Research Foundation Grant funded by the Korean Government (MOEHRD) (KRF-2007-532-C00017) and by the National Research Foundation of Korea Grant funded by the Korean Government (NRF-2009-353-C00061). The key calculations were performed using the supercomputing resource at the Korea Institute of Science and Technology Information (KISTI), which provided support through grant No. KSC-2009-S01-0003. The author greatly appreciates the help from the optimization/parallelization support team at KISTI, which optimized and parallelized the C++ code for the supercomputing system. The author also thanks Eunhee Choi at the Department of Biostatistics, Yonsei University College of Medicine for being involved in a preliminary study using the HapMap Phase II data, which facilitated the establishment of the current study.


