


1. Introduction
Telomeres, the repetitive nucleoprotein regions at chromosome ends, are hallmarks of biological aging (Lopez-Otin et al., Reference Lopez-Otin, Blasco, Partridge, Serrano and Kroemer2013). Large population studies have associated shorter telomere length (TL) with a range of risk factors that predict health problems and shorter life expectancy (Wang et al., Reference Wang, Zhan, Pedersen, Fang and Hägg2018). Even so, technical challenges with TL measurement have led to questions regarding their utility as a biomarker of aging (e.g. Hastings et al., Reference Hastings, Shalev and Belsky2017).
The most common approach to quantify TL in epidemiological studies is quantitative-PCR (qPCR), which expresses telomeric content relative to a single copy gene (Cawthon, Reference Cawthon2002). In addition to concerns of being less precise than measures generated by Southern Blot (Aubert et al., Reference Aubert, Hills and Lansdorp2012), TL measurement via qPCR is subject to influence by several pre-analytical factors including DNA extraction method (Cunningham et al., Reference Cunningham, Johnson, Litzelman, Skinner, Seo, Engelman, Vanderboom, Kimmel, Gangnon, Riegert-Johnson, Baron, Potter, Haile, Buchanan, Jenkins, Rider, Thibodeau, Petersen and Boardman2013), sample storage conditions (Dagnall et al., Reference Dagnall, Hicks, Teshome, Hutchinson, Gadalla, Khincha, Yeager and Savage2017), and analytical factors such as PCR mastermix (Jiménez & Forero, Reference Jiménez and Forero2018) and well position on plate-based thermocyclers (Eisenberg et al., Reference Eisenberg, Kuzawa and Hayes2015). However, whether power supply during the qPCR assay influences TL measurement has remained unconsidered.
Momentary fluctuations in power can affect the functioning of high-performance electronics, including real-time thermocyclers. These fluctuations can be mitigated by using an uninterruptible power supply (UPS), an apparatus capable of supplying constant, uninterrupted voltage (Aamir et al., Reference Aamir, Kalwar and Mekhilef2016). The current study investigated if UPS usage influenced TL assessment via qPCR across a range of technical and external validity metrics.
2. Methods
2.1. DNA Extraction and Telomere Length Assessment
Whole blood and buccal epithelial cells were collected from 26 grandmothers (age 52.6–72.2), 106 mothers (age 29.1–43.6) and 126 children (45.4% male; age 0.5–24.9). DNA for TL analyses was extracted from buffy coat (N = 94; 12 grandmothers, 79 mothers, & 3 children) and buccal epithelial cells (N = 271; 26 grandmothers, 116 mothers, & 129 children; dataset included multiple time points for 10 mothers and 3 children) using QIAamp DNA Mini Kits (Qiagen, Germany). DNA purity and quality was assessed using 260/230 and 260/280 ratios, but no exclusionary criteria was imposed prior to assays. DNA was stored at −80°C until TL analysis. All TL assays were performed by WJH on a Qiagen Rotor-Gene Q thermocycler, using a qPCR protocol adapted from Cawthon (Reference Cawthon2002). Each telomere assay comprised two qPCR runs, one run quantifying telomere content (T) and a second run quantifying genome copy number (S) using the single copy gene 36B4. Detailed descriptions of sample handling and processing, as well as details regarding qPCR assay and quality control are summarized in the supplemental material in accordance with guidelines recommended by the Telomere Research Network (https://trn.tulane.edu/wp-content/uploads/sites/445/2020/08/TRN-Reporting-Guidelines-updated.pdf). The same DNA aliquot was used for T and S runs. Each run hosted triplicate reactions of 22 samples, 5 standards, and 6 positive controls on 100 well disks.
Telomere length was quantified as the T/S ratio, which was calculated as $ T/S={\left(\frac{{E_T}^{Ct_T}}{{E_S}^{Ct_S}}\right)}^{-1} $
, where ET/S is the efficiency of exponential amplification for the telomere or single copy gene respectively, and CtT/S is the cycle at which a given replicate targeting telomeric content or the single copy gene reaches the critical threshold of fluorescence detection. A serial dilution of five standards were used to identify a critical threshold of detection for extraction of CtT/S values. Estimates of amplification efficiency at the replicate, sample, and plate levels used data generated from LinRegPCR (Ramakers et al., Reference Ramakers, Ruijter, Deprez and Moorman2003). T/S ratios were calculated using plate-level efficiencies, which have been shown to decrease bias and variability in qPCR data (Ruijter et al., Reference Ruijter, Ramakers, Hoogaars, Karlen, Bakker, van den Hoff and Moorman2009).
$ T/S={\left(\frac{{E_T}^{Ct_T}}{{E_S}^{Ct_S}}\right)}^{-1} $
, where ET/S is the efficiency of exponential amplification for the telomere or single copy gene respectively, and CtT/S is the cycle at which a given replicate targeting telomeric content or the single copy gene reaches the critical threshold of fluorescence detection. A serial dilution of five standards were used to identify a critical threshold of detection for extraction of CtT/S values. Estimates of amplification efficiency at the replicate, sample, and plate levels used data generated from LinRegPCR (Ramakers et al., Reference Ramakers, Ruijter, Deprez and Moorman2003). T/S ratios were calculated using plate-level efficiencies, which have been shown to decrease bias and variability in qPCR data (Ruijter et al., Reference Ruijter, Ramakers, Hoogaars, Karlen, Bakker, van den Hoff and Moorman2009).
2.2. Sample Overview and Statistical Analyses
The present work summarizes data generated from TL assessments of 2,221 replicate reactions across 34 qPCR runs (17 T & 17 S) as part of a larger investigation into intergenerational transmission of trauma, as previously reported (Etzel et al., Reference Etzel, Hastings, Mattern, Oxford, Heim, Putnam, Noll and Shalev2020). Sample-level analyses used the standard deviation and coefficient of variation across replicate CtT/S values, natural log transformed T estimates (Ln $ \left[{E_T}^{Ct_T}\right] $
), and natural log transformed S estimates (Ln
$ \left[{E_T}^{Ct_T}\right] $
), and natural log transformed S estimates (Ln $ \left[{E_S}^{Ct_S}\right] $
). Due to potential differences in reaction chemistry, telomere and single copy gene reactions were analyzed independently. A full break down of sample flow and subsets used in each analysis is provided in
Figure 1. Results described in the main text represent combined analyses of leukocyte and buccal samples. Independent analyses within each tissue are reported in Supplemental Tables S1-S5. Two telomere samples failing to reach the threshold of detection were removed from analyses. A UPS (Back-UPS Pro 700; APC) was utilized on approximately half of the runs (N = 18; 9 T & 9 S). All samples which had T run with the UPS also had their corresponding S reaction also run with the UPS. The runs utilizing the UPS were situated within the middle of the assays (i.e., 5 T runs and 5 S runs without the UPS followed by 9 T runs and 9 S runs using the UPS followed by 4 T runs and 4 S runs without the UPS). Differences in group means were assessed using t-tests. Homogeneity of variances between reactions assessed with and without the UPS was tested using Levene’s test. In instances where group variances were significantly different, the Welch t test was conducted in lieu of the Student’s t test (Welch, Reference Welch1947).
$ \left[{E_S}^{Ct_S}\right] $
). Due to potential differences in reaction chemistry, telomere and single copy gene reactions were analyzed independently. A full break down of sample flow and subsets used in each analysis is provided in
Figure 1. Results described in the main text represent combined analyses of leukocyte and buccal samples. Independent analyses within each tissue are reported in Supplemental Tables S1-S5. Two telomere samples failing to reach the threshold of detection were removed from analyses. A UPS (Back-UPS Pro 700; APC) was utilized on approximately half of the runs (N = 18; 9 T & 9 S). All samples which had T run with the UPS also had their corresponding S reaction also run with the UPS. The runs utilizing the UPS were situated within the middle of the assays (i.e., 5 T runs and 5 S runs without the UPS followed by 9 T runs and 9 S runs using the UPS followed by 4 T runs and 4 S runs without the UPS). Differences in group means were assessed using t-tests. Homogeneity of variances between reactions assessed with and without the UPS was tested using Levene’s test. In instances where group variances were significantly different, the Welch t test was conducted in lieu of the Student’s t test (Welch, Reference Welch1947).

Figure 1. Sample flow and subsets used for analyses. 1A. 2,221 replicate reactions comprising the full sample. 1B. Replicate reactions were distinguished by amplification target and analyzed separately due to concerns in reaction chemistry. Replicate reactions were used in analyses of replicate level efficiencies as a function of UPS utilization. 1C. Technical replicates were clustered by sample ID for analyses of standard deviation and coefficient of variation across replicate level efficiencies, replicate T-estimates, and replicate S-estimates. Differences in sample level efficiencies, calculated as the average efficiency across replicates, were also conducted within this subsample. The two additional data points for single copy gene data correspond to the two telomere samples that did not amplify as described in main text. 1D. Calculated T-estimates and S-estimates were used to calculate T/S values for 363 samples. Original T/S values for the 9 samples that were rerun were not included in analyses of T/S ratio data. Neither were the 9 T/S values marked as outliers, bringing the final sample size for external validity correlates to 354.
To better understand how UPS usage would influence the findings derived from telomere length data, we compared how samples assessed on runs with and without a UPS varied in their correlation between T/S ratio and external validity metrics including age, across-tissue within person, and among parents and offspring (Eisenberg, Reference Eisenberg2016). Differences in T/S ratio correlation coefficients were evaluated based on overlap of 83.4% confidence intervals (Knol et al., Reference Knol, Pestman and Grobbee2011). Samples with T/S ratios more than 3 standard deviations above the mean were marked as outliers and removed from analyses (N(+)UPS = 5; N(−)UPS = 4). Statistical analyses were conducted with IBM SPSS Statistics 26. Sample size estimates for reported power calculations were performed in Stata 15.1 using the ‘power onecorrelation’ command with power = 0.80 and α = 0.05, and effect size equal to the observed correlation coefficient.
3. Results
The standard deviation and coefficient of variation were significantly lower across replicate CtT values and natural log transformed T estimates for samples assessed on runs utilizing a UPS relative to those run without a UPS (Figure 2 A; Table 1:). Estimates of amplification efficiency at the replicate, sample, and plate level were also significantly improved on runs using a UPS, situating them closer to desired population doubling (Figure 3 A; Table 1:). Similar patterns were observed for reactions targeting the single copy gene (Figure 2 B; Figure 3 B; Table 2:).

Figure 2. Differences in assay precision as a function of UPS usage delineated by PCR amplification target. 2A: Average standard deviation and coefficient of variation across replicate CtT values and T estimates for samples assessed with (N = 196) and without (N = 176) the use of a UPS. 2B: Average standard deviation and coefficient of variation across replicate CtS values and S estimates for samples assessed with (N = 198) and without (N = 176) the use of a UPS. Error bars reflect standard error of the mean. SD = Standard Deviation. CV=Coefficient of Variation. ***p < 0.001.
Table 1. Comparing Features of T-Estimates by UPS Status

*Test statistics reported from independent samples t-test. Values reported are Mean (Standard Deviation). CV = coefficient of variation.
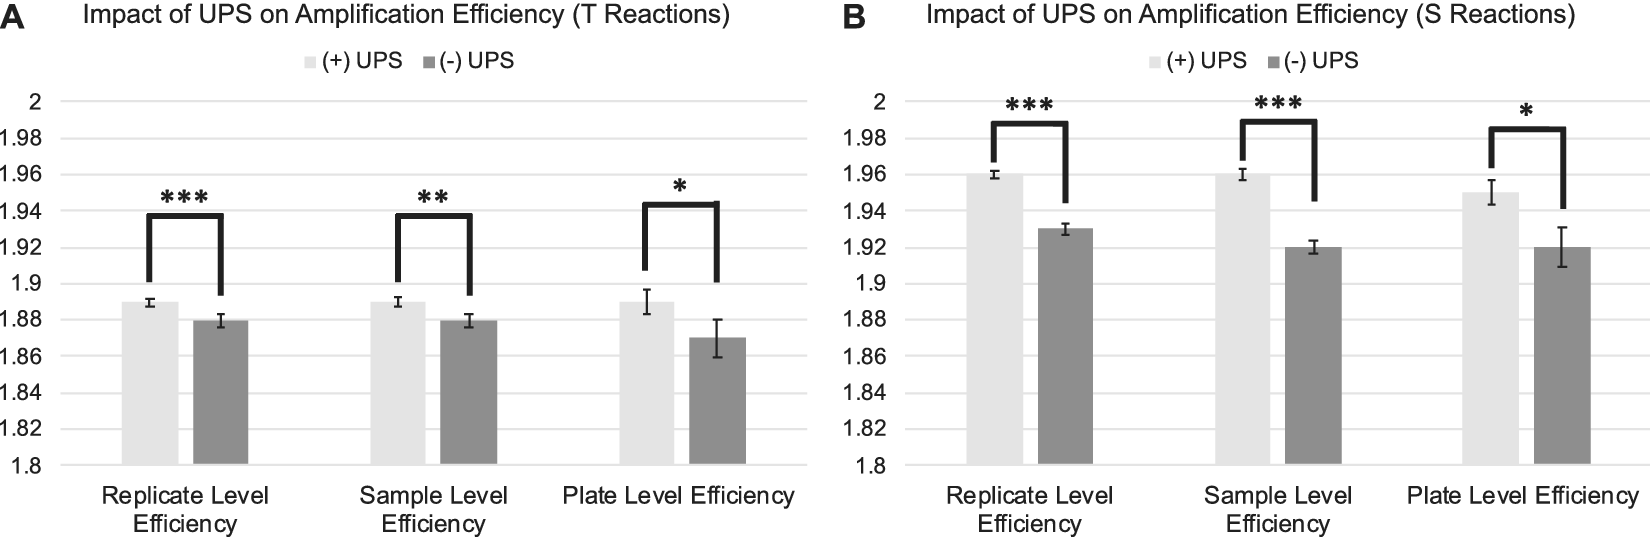
Figure 3. Differences in amplification efficiency as a function of UPS usage delineated by PCR amplification target. 3A: Average replicate, sample, and plate-level efficiencies for telomere reactions assessed with and without the use of a UPS. 3B: Average replicate, sample, and plate-level efficiencies for single copy gene reactions assessed with and without the use of a UPS. Efficiencies derived from LinRegPCR. Error bars reflect standard error of the mean. SD = Standard Deviation. CV=Coefficient of Variation. ***p < 0.001; **p < 0.01; *p < 0.05.
Table 2. Comparing Features of S-Estimates by UPS Status

*Test statistics reported from independent samples t-test. Values reported are Mean (Standard Deviation). CV = coefficient of variation.
UPS status improved all metrics assessing the external validity of T/S ratios (Table 3:). Within-person, cross-tissue correlations were significantly higher for samples assessed with a UPS relative to those without. The correlation between age and T/S ratios and between parent and offspring T/S ratios were also improved for samples assessed with a UPS, but not to a significant extent. Similar patterns were observed when leukocyte and buccal samples were analyzed independently (Supplemental Table S5).
Table 3. Comparing Metrics of External Validity by UPS Status

* Correlations controlled for sex, parental age, offspring age, and tissue (leukocyte/buccal)
To explore power gains yielded from using the UPS, we compared the sample sizes needed to distinguish UPS versus no-UPS TL external validity correlates as significantly different from zero (α = 0.05, power = 0.80.) For example, to detect the correlation of TL across tissues without a UPS (r = 0.62) requires a sample size of 18, while a sample of 7 is required to detect to detect with a UPS (r = 0.92). This equates to being able to detect a significant effect with a 61% smaller sample size. Using the same procedure for age and parent-offspring correlations yields estimates of 25% and 8% smaller samples, for an average ability to detect an effect with a 31% smaller sample.
4. Conclusions
TL assessment via qPCR is subject to bias from a host of analytical and pre-analytical factors (reviewed in Lin et al., Reference Lin, Smith, Esteves and Drury2019), leading some to challenge the utility of telomeres as a biomarker of aging (Boonekamp et al., Reference Boonekamp, Simons, Hemerik and Verhulst2013). Nevertheless, TL measurement via qPCR remains widely used in epidemiological research. Thus, elucidating measurement practices which enhance reproducibility and precision is of great interest.
Our results demonstrate substantial improvements to qPCR assay precision and measures of external validity through the utilization of an uninterruptible power supply. Further, findings suggest utilization of a UPS increases power in a manner equivalent to a 31% increase in sample size, although the degree of such improvement may differ with the baseline electric power quality and type of thermocycler employed. We frame our findings in the context of literature on TL assessment given the aim of the assays comprising our sample. However, the results are likely applicable to qPCR more broadly, and demonstrate the importance of considering power supply when conducting biological assays that rely on high performance electronics.
Acknowledgements
The authors would like to thank Brooke C. Mattern for their assistance with DNA extraction and quantification. We would also like to thank Dr Sue Rutherford Siegel in the Department of Biobehavioral Health Biomarker Core Lab for allowing the use of the facilities to perform telomere length assays.
Author Contributions
WJH and IS conceived original study that was refined by DTAE. WJH conducted telomere length assays. DTAE conceived analytical approach. WJH performed statistical analyses. DTAE performed power calculations. WJH, IS, and DTAE wrote the article.
Funding Information
This work was supported by National Institute on Aging (WJH, grant number T32AG049676) and National Institute of Environmental Health Sciences (IS grant number U01ES030949). The content is solely the responsibility of the authors and does not necessarily represent the official views of the National Institutes of Health.
Conflict of Interest
WJH, DTAE, and IS declare none.
Data Availability
The dataset used to generate the presented findings is available for public download at the repository site figshare (doi: 10.6084/m9.figshare.12954899).
Supplementary Materials
To view supplementary material for this article, please visit http://dx.doi.org/10.1017/exp.2020.58.


 Open access
Comments
Comments to the Author: The work is very interesting and a good contribution for telomere biologists working with qPCR measurements in different research fields, and may have some repercussions for those who use qPCR for other applications.
I have only some remarks:
1. Sampling description needs to be improved.
- How many samples of buffy coat and buccal epithelial cells were collected from each group (grandmothers, mothers and children)?
- How DNA quality/purity was assessed? Please describe the technique and the sample exclusion criteria.
- DNA was extracted from buffy coat (N= 94) and buccal epithelial cells (N= 269). Did these DNA samples all have good quality for measuring telomeres by qPCR?
2. How many days/weeks did the assays take? Please indicate the precise time period (days/weeks or months) of assays with and without UPS.
3. How was the DNA stored? The working solution was always the same DNA aliquot? I think that the freeze-thaw cycles of the samples varied between assays. This can be a very critical point for qPCR telomere assays. It is important to indicate how this factor was controlled.
4. Were the assays always performed by the same person? Please state in the manuscript.
5. Lines 69-70: Each sample was analyzed in duplicate, triplicate…? Please describe in the manuscript. How many samples were analyzed per run/plate? Saying 34 PCR runs is unclear.
6. Line 59: It would be interesting for the reader to see at least the TL primers and the single-copy gene name and primers used in this work.