


Introduction
Enhancing agricultural productivity in sub-Saharan African countries (SSA) including Ethiopia is a major approach to break the vicious cycle of rural poverty. In this regard, the Alliance for a Green Revolution in Africa has aimed to increase fertilizer use from the current 8 kg to 50 kg fertilizer nutrients ha−1 (Vanlauwe et al., Reference Vanlauwe, Kihara, Chivenge, Pypers, Coe and Six2011). The judicious use of external nutrient sources is now recognized as a prerequisite for sustainable intensification. Fertilizers constitute an integral part of the crop production technologies, and their proper management is important for maximizing yields (Stewart et al., Reference Stewart, Dibb, Johnston and Smyth2005), optimum water utilization, and minimum effects on environment (Goulding et al., Reference Goulding, Jarvis and Whitmore2008).
With increasing population pressure and limited possibilities of expanding arable land, application of mineral and organic fertilizers (among other things) contributes the highest share to increase productivity (Amede et al., Reference Amede, Belachew and Geta2001; Vanlauwe et al., Reference Vanlauwe, Bationo, Chianu, Giller, Merckx, Mokwunye, Ohiokpehai, Pypers, Tabo and Shepherd2010). Nevertheless, soil nutrient balance studies in Africa show evidence of widespread nutrient mining as compared with amendments. One result is a negative nutrient balance (Henao and Baanante, Reference Henao and Baanante1999; Sanchez, Reference Sanchez2002; van Beek et al., Reference van Beek, Elias, Yihenew, Heesmans, Tsegaye, Feyisa, Tolla, Melmuye, Gebremeskel and Mengist2016), which leads to severe nutrient deficiencies across ecological zones and consequently declining crop productivity (van Beek et al., Reference van Beek, Agegnehu, Debele, Terano, Heesmans and Elias2011; Zeleke et al., Reference Zeleke, Agegnehu, Abera and Rashid2010). Nutrient mining of 130 kg N, 5 kg P, and 25 kg K ha−1 year−1 has been reported in the East African highlands, including Ethiopia (Smaling et al., Reference Smaling, Nandwa, Janssen, Buresh, Sancheze and Frank1997). Nutrient losses are only partially compensated by natural and synthetic inputs; thus, the nutrient balance for all of SSA has been negative (i.e. –26 kg N, –3 kg P, and –19 kg K ha−1 year−1) (Drechsel et al., Reference Drechsel, Kunze and De Vries2001). In Ethiopia, the losses were even larger than the average of in SSA: 122 kg N, 13 kg P, and 82 kg K ha−1 year−1 (Haileslassie et al., Reference Haileslassie, Priess, Veldkamp, Teketay and Lesschen2005). The negative nutrient balances were mainly attributed to continuous cropping (Agegnehu et al., Reference Agegnehu, Lakew and Nelson2014; Agegnehu et al., Reference Agegnehu, Ghizaw and Sinebo2008), application of suboptimal levels of mineral fertilizers, depletion of soil organic matter, and high proportions of cereals in the cropping system (Zeleke et al., Reference Zeleke, Agegnehu, Abera and Rashid2010; Agegnehu et al., Reference Agegnehu, Lakew and Nelson2014; Agegnehu et al., Reference Agegnehu, Ghizaw and Sinebo2008). This is believed to disrupt the balance between providing a sufficient amount of the required nutrient and its associated impact on soil quality (van Beek et al., Reference van Beek, Elias, Yihenew, Heesmans, Tsegaye, Feyisa, Tolla, Melmuye, Gebremeskel and Mengist2016).
Fertilizer recommendation in Ethiopia was mainly based on a single blanket recommendation for most crops (64 kg N ha−1 and 20 kg P ha−1) as urea and di-ammonium phosphate (DAP). This blanket recommendation often fails to take into consideration differences in resource endowment (soil type, labor capacity, and climate risk) or make allowances for dramatic changes in input/output price ratio, thereby deterring farmers from fertilizer application (Zeleke et al., Reference Zeleke, Agegnehu, Abera and Rashid2010; van Beek et al., Reference van Beek, Agegnehu, Debele, Terano, Heesmans and Elias2011). The nutrients in the blanket recommendation are not well balanced agronomically, and the continued use of this recommendation will gradually exhaust other soil nutrient reserves and create nutrient imbalances (Zeleke et al., Reference Zeleke, Agegnehu, Abera and Rashid2010). Therefore, neither yields nor profits can be sustained using unbalanced application of fertilizers, as the practice results in accelerating deficiencies of other soil nutrients. According to recent analysis, N, P, S, boron (B), and zinc (Zn) deficiencies are widespread in Ethiopian soils, while K, copper (Cu), molybdenum (Mo), manganese (Mn), and iron (Fe) are also reported as deficient (Dibabe et al., Reference Dibabe, Bekele and Assen2007). This is particularly apparent in soils and/or areas where agricultural crop productions make use of only N and P fertilizers on a continuous basis. There is also growing evidence of K deficiency in Ethiopia even in soils with optimum amount of exchangeable K (Laekemariam et al., Reference Laekemariam, Kibret and Shiferaw2018). This is associated with imbalances in Ca, Mg, and K in the soil, a problem known as induced deficiency.
Barley (Hordeum vulgare L.) is one of the main cereals cultivated in the highlands of Ethiopia. The crop is the fifth most important crop after teff (Eragrostis tef), maize, wheat, and sorghum. Although barley covers an area of 951 993 million ha, the national average yield remains low at 2.16 t ha−1 (CSA, 2018). Barley is the major grain used for malting and brewing by subsistence farmers in the highlands of Ethiopia (FAO, 2016; Agegnehu et al., Reference Agegnehu, Lakew and Nelson2014). And though there is a considerable potential for increased barley production, numerous factors are considered yield limiting (Mulatu and Lakew, Reference Mulatu, Lakew, Mulatu and Grando2011). The productivity of barley in Ethiopia has remained very low (about 1.3 t ha−1 compared with the world average of 2.4 t ha−1) (Mulatu and Grando, Reference Mulatu and Grando2011). The most important abiotic stresses include low soil fertility, low soil pH, poor soil drainage, drought, and poor agronomic practices. Among these factors, low levels of fertilizer application, soil acidity (pH < 5.5), deficiency of nutrients, especially N and P, due to continuous cropping contribute to the low yields of cereals ((Mulatu and Lakew, Reference Mulatu, Lakew, Mulatu and Grando2011; Agegnehu et al., Reference Agegnehu, Liben, Molla, Feyissa, Bekele, Getaneh, Mulatu and Grando2011; Agegnehu et al., Reference Agegnehu, Lakew and Nelson2014). Fertilizer use for barley production is the lowest among all the cereals, which is only 48.3% of the total area of land covered by barley (Mulatu and Lakew, Reference Mulatu, Lakew, Mulatu and Grando2011; Agegnehu et al., Reference Agegnehu, Liben, Molla, Feyissa, Bekele, Getaneh, Mulatu and Grando2011).
Efficient use of mineral fertilizer inputs is crucial for the overall nutrient balance in intensive cropping systems. The N and P use efficiencies of cereals need to be specifically improved by proper management of N and P fertilizers to reduce negative environmental effects while increasing crop yields (Lichtfouse et al., Reference Lichtfouse, Navarrete, Debaeke, Souchère, Alberola, Ménassieu, Lichtfouse, Navarrete, Debaeke, Véronique and Alberola2009; Raun et al., Reference Raun, Solie, Johnson, Stone, Mullen, Freeman, Thomason and Lukina2002). To overcome the constraint of low nutrient recovery and optimize fertilizer use, there is a need to develop appropriate fertilizer recommendations that are differentiated according to agro-ecological zones (AEZs) and soil type. This can ensure production can be intensified in a cost-effective and sustainable manner. The objectives of the present study were therefore to (1) determine soil and AEZs-specific response of barley to N, P, K, and S under balanced application of other nutrients; (2) quantify the agronomic optimum rate for N, P, K, and S fertilizer; and (3) evaluate agronomic efficiency (AE) of N, P, K, and S nutrients in the Ethiopian highlands.
Materials and Methods
Description of experimental sites
The experiments were conducted in the main cropping season from 2014 to 2016 in 83 farmers’ field in the main barley-growing districts of Basona Werana district, Siemen Shewa Zone of the Amhara Regional State, Alaje district of southern Tigray Zone of Tigray Regional State, and Sinana district of Bale Zone of Oromia regional State (Figure 1; Supplementary Table S1). Specifically, the experiment was conducted in Goshebado and Gudoberet kebele of Basona Werana district for three years, Ayeba kebele of Alaje district for one year, and Salka and Ilusinbitu Please provide the missing text citation for the Supplementary Table S4.kebele of Sinana district for three years (Figure 1). The number of farmers field at each soil type and AEZs are presented in The Supplementary Table S1 presented in the article so we have retain the text citation of Supplementary Table S1. Please check and confirm.Supplementary Table S1.

Figure 1. Study sites located in the three regions of the country.
Geographically, Basona Werana is located at 9°43'58" to 9°52'42" E and 39°25'28" to 39°40'08" N; Alaje at 12°52'25" to 12°52'47" E and 39°32'45" to 39°33'02" N; and Sinana at 7°04'17" to 7°15'16" E and 40°23" to 40°12'20" N. The altitude ranges from 2802 to 3043 masl for Basona Werana, 2729–2756 masl for Alaje, and 2368–2463 masl for Sinana sites. Agro-ecologically, Basona Werana is found in warm, sub-moist mid-highlands (SM3) and in cool sub-moist mid-highlands (SM4). Alaje lies in cool sub-moist mid-highlands (SM4) and Sinana is found in warm, sub-humid mid-highlands (SH3).
All the three districts are characterized by bimodal rainfall pattern receiving average annual rainfall of 1029 mm, 1131 mm, and 773 mm for Basona Werana, Sinana, and Alaje district, respectively (the highest rainfall occurs in June–September). The long-term annual average minimum temperatures for Basona Werana, Sinana, and Alaje are 13.7oC, 13.5oC, and 12.7oC, respectively. The average annual maximum air temperatures are 18oC, 16.4oC, and 17.2°C, respectively. The monthly average rainfall and temperature of all districts are presented in Figure 2. The soil types on the study sites are Cambisols and Vertisols, which cover 10.2% and 15.3% of the land area in Ethiopia (Abebe, Reference Abebe1998). Selected soil physico-chemical properties of each AEZ and soil types are presented in Table 1.

Figure 2. Monthly rainfall and temperature of the study area.
Table 1. Agro ecology (AEZ) and chemical properties of soils of Basona Werana, Sinana, and Alajie districts in Ethiopia in the 2014–2016 main cropping seasons

AEZ = Agro-ecologica zones, SH3 = tepid sub-humid mid-highlands (Sinana district), SM3 = tepid sub-moist mid-highlands (Basona Werana districts, Gudoberet kebele), SM4 = cool sub-moist mid-highland (Goshebado kebele of Basona Werana district and Alaje districts), a= Tekalign (1991), b= Cottenie (Reference Cottenie1980), Jones, J. Benton (Reference Jones2003), *=Alajei district, **= Basona Werana districts.
Treatment and experimental design
The experiment included six rates of N (0, 46, 92, 138, 184, and 230 kg N ha−1), six rates of P (0, 10, 20, 30, 40, and 50 kg P ha−1), six rates of K (0, 18, 36, 54, 72, and 90 kg K ha−1), and six rates of S (0, 10, 20, 30, 40, and 50 kg S ha−1). The experiment was designed in such a way that dose–response to N, P, K, or S (individually) could be determined under balanced application of the other remaining macro- and micronutrients (Zn, B). The two micronutrients were selected based on the soil fertility map of those location were reported as deficient on those nutrients by ETHOSIS. For example, for determining response to N, all other nutrients were kept constant (30 kg P, 80 kg K2O, 30 kg S, 2 kg Zn, and 0.5 kg B ha−1), and N rate was varied as indicated above. Similarly, for determining response to P, the P rate was varied but with N, K, S, Zn, and B rates kept at 92 kg N, 80 kg K2O, 30 kg S, 2 kg Zn, and 0.5 kg B ha−1. When determining response to K, the K rates were varied as above but the N, S, Zn, and B rates were held constant at 92 kg N, 30 kg P, 30 kg S, 2 kg Zn, and 0.5 kg B ha−1. When determining response to S, the S rates were varied as above, but the N, P, K, Zn, and B rates were held constant at 92 kg N, 30 kg P, 80 kg K2O, 2 kg Zn, and 0.5 kg B ha−1. Treatment sequencing was randomized using randomized complete block design on a plot size of 3.6 x 3.4 m (12.24 m2) with three replicates for each factor. The spaces between treatments and blocks were 1 m and 1.5 m, respectively. Sowing was done in Basona Werana and Alaje from end of June to the first week of July, and in Sinana between the first and second week of August every year. Food barley varieties used were HB-1307, Shedo, and Arbu for sites in Basona Werana, Alaje, and Sinana, respectively. Phosphorus, potassium, and sulfur were applied as triple super phosphate, potassium chloride, and calcium sulfate at planting. The fertilizers were applied just on the side of the row with a depth of 3–5 cm. Nitrogen in the form of urea was applied half at planting and the other half at tilling stage (∼45 days after planting) with presence of small rainfall in the side of row. Boron as borax and zinc as zinc sulfate were applied as foliar. Other standard agronomic practices were applied as per the recommendations for the crop.
Sampling, data collection, and statistical analysis
Harvesting was done from the first week of November to mid-November in Basona Werana and Alaje, whereas in Sinana harvesting was done in the first week of December. To measure total above-ground biomass and grain yields, the central 10 rows of each plot (2 x 3.4 m) were harvested at soil level, then grain yield and above-ground total biomass were recorded. After threshing, seeds were cleaned and weighed. Seed moisture content was measured using a gravimetric method. Total biomass (on dry matter basis) and grain yields (adjusted to a moisture content of 12.5%) were converted to kg ha−1 before statistical analysis.
A linear mixed modelling framework was used to determine the variation in yield with the different levels of N, P, K, and S by soil type and agro-ecology combining study locations and years. The linear mixed modeling framework (in PROC MIXED of the SAS system) was chosen for the different levels of analyses because it allows modeling of hierarchical or clustered data arising from observational studies through inclusion of both fixed and random effects. The approach was also chosen to account for imbalance in terms of sample size and confounding of responses by uncontrolled variables. To account for imbalance in the sample sizes, the Kenwarde-Roger method was used for approximating the degrees of freedom. The fixed effects in the model were agro-ecology, soil type, nutrient rate, and their interactions, with location as the random effect. In mixed models, the random component specifies that the linear predictor contains a term that randomly varies with one or more ecological correlates of crop yield—for example, location. This helps to account for correlation (i.e., observations in the similar location are likely to be more related than observations in other locations, and that locations are nested within agro-ecology or soil types). The PROC MIXED procedure uses REML estimation method and the Prasad-Rao-Jeske-Kackar-Harville fixed effects method for estimating standard errors. The initial model was of the following form:
 $$Y = \mu + AEZ + Soiltype + rate + AEZ*rate + Soiltype*rate + Location + \varepsilon $$
where μ is the grand mean yield (kg ha−1), AEZ is agro-ecological zone, Soiltype is the soil type of the site according to the World Reference Base (WRB) classification and correlation system, rate is the t rate of application (kg ha−1) for the nutrient under study, location is the random component, and ϵ is the error term. In many cases, however, sample sizes were not adequate to accommodate a model with AEZ * Soil type*nutrient interactions and parameters were not correctly estimated.
Before settling on a given model, however, model fit was examined using Akaike’s Information Criterion (AIC) and Bayesian Information Criterion (BIC) (Supplementary Table 2). As a rule of thumb, changes in BIC (differences between BICs of two models) of 2–6 provide weak evidence favoring the more complex model, while differences >10 provide very strong evidence favoring the more complex model. Accordingly, the model above was deemed satisfactory. In all cases, the intercept was used as the random effect where location is the subject, specifying that data from one location are more correlated than data from another location. Then, the intraclass correlation coefficient (ICC) was calculated as the ratio of the covariance estimate of the random intercept and the covariance estimate for the residual + intercept. The ICC indicates how much of the total variation in the outcome is accounted for by the location. The variations in yield with fixed effects were considered significant when p ≤ 0.05 (Supplementary Table 2). The Tukey-Cramer adjustment of P values was used for difference between least square means. Least square estimates and their 95% confidence intervals (CIs) were used for statistical inference. This is because the 95% CI functions as a very conservative test of hypothesis and it also attaches a measure of uncertainty to sample statistic (du Prel et al., Reference du Prel, Hommel, Röhring and Blettner2009). The means for two or more levels of a fixed effect were significantly different from one another if their 95% CI were nonoverlapping. To achieve the second objectives of this study (i.e., to determine the optimum rate of the nutrient in question), nutrient response functions were compared and used as deemed appropriate. The first function chosen was the asymptotic function given as yield (Y): Y = a–bc N , where a is yield at the plateau (i.e. expected maximum), b is the amplitude (the gain in yield due to nutrient application), c is a curvature coefficient, and N is the nutrient rate applied. When the asymptotic function fails to converge, other similar models that well fit the data, such as polynomial function, were chosen to determine the optimum nutrient rate.
AE, defined as grain yield per unit of N and P applied, was computed as
 $$AE\;\left( {{\rm{kg}}\;{\rm{k}}{{\rm{g}}^{ - 1}}} \right) = {{G{Y_f} - G{Y_u}} \over {{\rm{N}}a}}$$
where GY f is the grain yield of the fertilized plot (kg), GY u is the grain yield of the unfertilized plot (kg) for each replicate, and Na is the quantity of N applied as N fertilizer (kg).
Rainwater productivity (RWP), defined as grain yield per unit of crop growth period rainfall (RF), was computed as
 $$RWP\;\left( {{\rm{kg}}\;{\rm{m}}{{\rm{m}}^{ - 1}}} \right) = {{GY} \over {RF}}$$
where RF = Rainfall amount (mm) and GY= grain yield (kg)
Means of treatments for N, P, K, and S were presented using upper and lower CI.
Results
Yield response to applied N and P
Response to N and P did not significantly vary with the main effects of AEZ or soil type. Response to N and P rates significantly varied with and the interaction effect of nutrient rates and AEZ (Supplementary Table 2). The intraclass correlation (ICC) indicated that 65.1, 52.6, 56.3, and 56.4% of the variation in response to N, P, K, and S rates are accounted for by location (Supplementary Table 3).
Grain yield and total biomass significantly (p ≤ 0.01) responded to N application rates relative to the control without N application. Grain yield also varied significantly (p ≤ 0.01) among P rates but not for total biomass. The highest responses were recorded in the higher N and P rates as compared with the lower N and P rates. The interaction between N rate and AEZ (agro-ecological zone) is highly significant (p ≤ 0.01) affecting both barley grain yield and biomass.
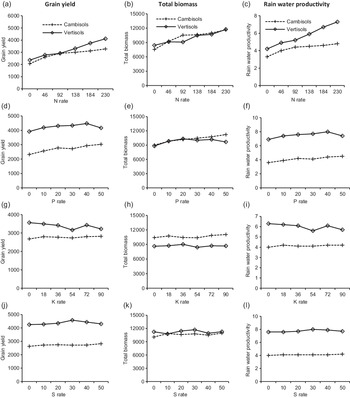
Nitrogen rate by AEZ interaction increased grain yield from ∼59% (625 kg ha−1) to 309% (3293 kg ha−1) in warm sub-moist mid-highlands (SM3), from 37% (811 kg ha−1) to 114% (2516 kg ha−1) in cool, sub-moist mid-highland (SM4), and from 18% (338 kg ha−1) to 23% (426 kg ha−1) in warm, sub-humid mid-highlands (SH3) as compared with the control. The highest yield increment was recorded in SM3 and SM4 AEZs. Similarly, N rate by soil type interaction resulted in consistent yield increments of ∼26% (544 kg ha−1)–59% (1213 kg ha−1) on Cambisols and 18% (416 kg ha−1)–74% (1750 kg ha-1) on Vertisols, as compared with the control. The N response curves reveal that the asymptote is reached around 200 kg N ha-1 on Cambisols, while on Vertisols the asymptote could not be determined as yields were still increasing even at 230 kg N ha-1 (Figure 5). Grain yield steadily increased with the increase in N rate across AEZs, although the yield response to N was significantly greater at SM3 and SM4 than SH3 (i.e., in Basona Werana and Alaje districts than in Sinana district). The trend in grain yield increase was inconsistent with the increase in N rates at SH3, where the yield was higher at 138 kg N ha−1 (2281 kg ha−1). However, the yield obtained at this rate was found to be comparable with the yield observed at the rate of 46 kg N ha−1 (2268 kg ha−1), indicating that the lowest rate (46 kg N ha−1) could be sufficient for barley production at SH3. This might be probably due to the relative high soil content of this AEZ compared with other AEZs (Table 1). Implying that additional yield with increasing N rate will be low. In contrast, marked yield increments were observed with the increase in N rates at SM3 and SM4, signifying actual and potential yield differences among AEZs. The trend in overall total biomass was very similar to the trend in the grain yield.
With balanced application of the other nutrients, P fertilizer substantially improved barley grain yield relative to the control without P application. When compared with the control (without P), application of P increased grain yield by 37% (703 kg ha−1) – 72% (1377 kg ha−1) in SM3, 8% (291 kg ha−1) −35% (1259 kg ha−1) in SM4, and 6% (128 kg ha−1) −14% 324 kg ha−1) in SH3. The highest yield increment was recorded in SM4 at the rate 50 kg P ha−1 (Figure 3: Supplementary Table S5). Similarly, application of P resulted in consistent yield increments of 11% (244 kg ha−1)–30% (701 kg ha−1) on Cambisols and 7% (278 kg ha−1)–14% (556 kg ha−1) on Vertisols, compared to the control without P (Figure 4: Supplementary Table S6). Although higher yields were achieved on Vertisols than on Cambisols, yield increase due to P application rates was greater on Cambisols than on Vertisols. The P response curves did not reveal the maximum response on Cambisols; it was still increasing even up to 115 kg P ha−1, while an asymptotic response reached on Vertisols around 40 kg P ha−1. On Vertisols, there was consistently increasing trends in barley yield up until the P rate of 40 kg P ha–1. A decreasing trend was observed only at 50 kg P ha–1.

Figure 3. Barley grain yield, biomass and rain water productivity with N, P, K and S rates in three agroecological zones (SH3, SM3 and SM4).


Figure 5. Agronomic efficiency of N and P, nitrogen response curve, and phosphorus response curves for barley grain yield. Error bars represent ±1 SE.
Yield response to applied K and S
Balanced application of different rates of K did not significantly increase grain yield and total biomass of barley on different soil types and AEZs (Supplementary Table 2). This result agrees with other previous studies. For example, Yitaferu et al. (Reference Yitaferu, Tesema and Ayalew2010) found that maize grain yield did not significantly respond to application of K fertilizer in Ethiopia. Similarly, Tariq and Shah (Reference Tariq and Shah2002) also reported that application of K did not significantly affect wheat yield, as the experimental soil already had sufficient K for plant growth and some K+ might be released from non-exchangeable sources. There were no clear trends in yield due to application of different rate of K rates on both soil types (Figure 4; Supplementary Table S6). The trend in grain yield with K levels was also not consistent on different AEZs. Numerically, potassium rate by AEZ and soil type interaction consistently increased grain yield from ∼2 to 5% in warm sub-moist mid-highlands (SM3) and Vertisols, respectively. As K rates increased, yields surprisingly decreased on Vertisols and higher grain yields were recorded in the control (0 K application) than at the highest K rate (90 kg K ha−1) (Figure 4; Supplementary Table S6). Similarly, the yield response to K application rates was inconsistent across AEZs; yield increments, even with higher K rates, were negligible. The low response of barley to K application might be attributed to the presence of this nutrient in sufficient amount for crop production in the study areas (Figure 3). The result of this study corresponds with the EthioSIS soil map, where the level of K is sufficient in most Ethiopian soils to meet crop requirements (EthioSIS, 2021).
Similarly, in spite of numerical variations among treatments, increasing rates of S did not result in significant increases in grain yield and total biomass of barley on the soils under study. The trend in both grain yield and total biomass was inconsistent with S rates. Grain yield significantly (p < 0.01) differed among AEZs in response to different S rates; however; yield increments ranged from 14% (511 kg ha−1) to 21% (761 kg ha−1) in SM4 compared with the control. However, the yield increase was negligible in SH3 and SM3 (Figure 3; Supplementary Table S5). Similarly, yield increments due to S rates over two soil types were inconsistent and very low, where the highest yield increment of 8% was recorded at 50 kg S ha−1 on Cambisols and 8% at 30 kg S ha−1 on Vertisols. Although crop S requirement is low compared with other macronutrients, numerically yield variations were observed among different S rates, particularly at SM4, which represents Basona Werana and Alaje districts. On this agro-ecological zone, increasing the rate of sulfur from nil to 10 kg S ha–1 appeared to have elevated the yield to a significant level. However, beyond this level, no significant increments in yield occurred at all for all agro-ecological zones and sulfur rates. Therefore, considering the economic feasibility of the S rates, the first two rates (10 and 20 kg S ha−1) may have yield advantages if applied on SM4AEZs.
Agronomic efficiency of N and P
Nitrogen and P use efficiencies of cereals need to be improved by proper management of N and P fertilizers, while maintaining or, optimally, increasing crop yields. AEN (Agronomic efficiency of N) varied significantly (p ≤ 0.01) with N and P rates applied on both soil types (Figure 3). The mean AEN ranged from 5.5 to11.8 kg grain kg−1 N applied on Cambisols and 2.1–9.7 kg grain kg−1 N applied on Vertisols. Similarly, AEP (agronomic efficiency of P) ranged from 13.2 to24.2 kg grain kg−1 P applied on Cambisols and 5–27.6 kg grain kg−1 P applied on Vertisols (Figure 3). Our results on N and P use efficiency of barley were consistent with the findings of previous studies (Raun et al., Reference Raun, Solie, Johnson, Stone, Mullen, Freeman, Thomason and Lukina2002; Ruisi et al., Reference Ruisi, Frangipane, Amato, Frenda, Plaia, Giambalvo and Saia2015; Agegnehu et al., Reference Agegnehu, Nelson and Bird2016). Earlier findings indicate that mean AEN of 22–29 kg kg−1 was obtained for barley grown in organic and inorganic amended Cambisols (Shejbalová et al., Reference Shejbalová, Černý, Vašák, Kulhánek and Balík2014) and 6.2–26 on Nitisols (Agegnehu et al., Reference Agegnehu, Nelson and Bird2016). Similar studies on wheat reported mean AEN of 2–18 kg kg−1 N applied (Guarda et al., Reference Guarda, Padovan and Delogu2004) and AEN of 12.6–29 kg kg−1 N applied on Nitisols (Tarekegne and Tanner, Reference Tarekegne and Tanner2001). The highest AEN was obtained from the lowest application rate of 46 kg N ha−1 on both soil types, with the increments over the highest N rate (230 kg N ha−1) being ∼117% and 33% on Cambisols and Vertisols, respectively. Similarly, the maximum AEP was obtained from the lowest application rate of 10 kg P ha−1 on both soil types, with increments over the highest P rate (50 kg P ha−1) being ∼73% and 452% on Cambisols and Vertisols, respectively. Similarly, Jama et al. (Reference Jama, Kimani, Harawa, Mavuthu and Sileshi2017) reported that AEN was higher with 50% of the recommended N rate as compared with 100% of the recommended N rate. AEN and AEP followed an inverse relationship with N and P application rates, suggesting that as their rates of application increased, nutrient use efficiency decreased. Overall, the lowest AEN and AEP values were recorded at the highest N and P rates (230 kg N ha−1 and 50 kg P ha−1), and the maximum values were recorded at the lower rates (46 kg N ha−1and 10 kg P ha−1) (Figure 3). This is because at low levels of N and P nutrient supply, rates of increase in yield and N and P uptake are large because N and P is the primary factor limiting crop growth and final yield. As the N and P supply increases, incremental yield gains become smaller. This is because maximum potential yield is determined by other factors than N and P nutrients.
Rainwater productivity
In rain-fed agricultural systems, rainfall use efficiency can be increased by crop genetics and agronomic practices including fertilization (Turner and Asseng, Reference Turner and Asseng2005). Therefore, there is a need to consider crop production not solely in terms of production per unit of area but per unit of water (Molden et al., Reference Molden, Murray-Rust, Sakthivadivel and Makin2003). RWP (Rainwater productivity) expresses the amount of yield produced per unit of rainwater during the crop growth period. RWP significantly (p < 0.05) differed among N, P, and S rates and interaction of N rates by AEZ. RWP also significantly (p < 0.01) varied among soil types and N and P rates. RWP due to changes in N rate ranged 3.9–4.6 kg mm−1 in SH3, 1.8–5.9 kg mm−1 in SM3, and 2.7–6.2 kg mm−1 for SM4. Regardless of AEZs and soil types, the highest RWP was recorded from the highest N rate and it consistently increase with increasing N rate (Figure 3). This could be probably N application resulted in more prolific and deeper root to efficiently utilize the soil moisture which ultimately increased yield (Shepherd et al., Reference Shepherd, Cooper, Allan, Drennan and Keatinge1987). In relation to P rates, RWP ranged 2.4–6.4 kg mm−1 across AEZ and 3.6–8 kg mm−1 under the two soil types. In all AEZs, the highest and lowest RWP were recorded from the highest (50 kg P ha−1) and lowest (0 kg P ha−1) P rate. The percentage increase in RWP were found to be 13.5% (0.5 kg mm−1), 66.7% (1.6 kg mm−1), and 68.4% (2.6 kg mm−1) on SH3, SM3, and SM4, respectively (Figure 3; Supplementary Table S5). The same trend also observed on different soil types. The percentage increase in RWP on Cambisols and Vertisols was found to be 25% (0.9 kg mm−1) and 7.2% (0.5 kg mm−1), respectively. The RWP obtained for the soil types was greater than the WRP achieved for AEZs, implying that efficiency of P was more affected by soil types than agro-ecology.
Discussion
Barley yield response to applied N and P
Soil texture is one of the inherent soil properties less affected by management and which determines nutrient status, organic matter content, air circulation and water holding capacity of a given soil. The soil textures of the experimental sites varied from clay to clay loam soils. The pH of the soils of all experimental locations in all AEZ ranged from slightly acidic to neutral. In terms of the content of soil organic matter, SH3 and Vertisols are in the high range, whereas all others are in the medium range. In terms of the content of available P and N, soils in all locations are in the medium range. Likewise, the exchangeable K of the soils of all locations is in the very high range (Tekalign, 1991; Cottenie, Reference Cottenie1980; Jones and Benton, Reference Jones2003).
Grain and biomass yield steadily increased with the increase in nitrogen rate across AEZs and soil types. The overall grain and biomass yield trends were very similar to the trends of the total biomass in that the treatments without N had the lowest grain and biomass yields. Indicating that N is the most limiting element after water for crop production. Other studies have also shown that application of nitrogen markedly increased grain yields of both food barley (Agegnehu et al. Reference Agegnehu, Nelson and Bird2016; Beatty et al. Reference Beatty, Anbessa, Juskiw, Carroll, Wang and Good2010) and malting barley (Agegnehu et al. Reference Agegnehu, Lakew and Nelson2014). The non-linear regression analysis using asymptotic model over two soil types clearly showed that yield steadily increased with the increase in N rate on Cambisols, implying that some additional rates will be required to meet the response curve (Figure 3). In contrast, since the convergence criterion was not met using nonlinear regression model for Vertisols, the polynomial regression analysis indicated that grain yield increased with the increase in N rate (Figure. 3). Across AEZs, barley yields were considerably lower in SH3 than SM3 and SM4 (i.e., in Sinana than Basonaworana and Embaalaje) for all nutrient studies, in which the highest yields for all nutrients were recorded at SM4. These differences could be attributed to differences in management practices, soil nutrient status, barley varieties used for the study, and climatic condition such as rainfall and temperature.
Grain and biomass yield also progressively increased with the increase in phosphorus rate across AEZs and soil types up to application of P at the rate of 20 ha−1. The steady increase in yield with the increase in P rates without reaching a plateau on Cambisols (Figure 5) implies that higher P rates will be needed to attain the maximum yield. The overall grain and biomass yield trends were very similar to the trends of the total biomass in that the treatments without P had the lowest grain and biomass yields. Although higher yields were achieved on Vertisols than on Cambisols, yield increase due to P application rates was greater on Cambisols than on Vertisols. The steady increase in yield with the increase in P rates on Cambisols implies that higher P rates will be needed to attain the maximum yield. Vertisols has more puffer power that leads to rapid replenishment of P taken up by plant roots from the soil solution, thereby enabling plants to take up P at higher rates and grow better. The Cambisols, despite having numerically higher available P content than Vertisols, it has a low buffer power and would replenish P taken up by plant roots from the soil solution at a slower rate. The organic carbon content of Vertisols is high whereas that of Cambisols is medium according to the rating of Tekalign (1991) (Table 1). Organic carbon is the other source of available P, which will put the barley plants growing on Vertisols in a better position to take up more P and hence better yield. The nonlinear regression analysis over two soil types clearly showed that yield steadily increased with the increase in P rate for Cambisols, implying that more rates will be needed to attain the response curve. However, the same model for Vertisols revealed that grain yield showed a gradual decreasing trend just after 10 kg P ha−1 with the increase in P rate (Figure. 3).
Conclusions
Blanket recommendation of fertilizers often fails to take into consideration differences in soil types and AEZs. The nutrients in the blanket recommendation are not well balanced agronomically, and the continued use of this recommendation will gradually exhaust other soil nutrient reserves and create nutrient imbalances. The current study was carried out to determine soil and AEZs specific response of barley to N, P, K, and S under balanced application of other nutrients on major barley growing areas of Ethiopia for three years. In this regard, it is the first study that reports yield responses of barley to N, P, K, and S under balanced application of the other nutrients in different soil types and AEZs in Ethiopia. The results emphasize the benefits of balanced application of N, P, K, and S fertilizers for improving barley yield. The highest agronomic efficiency of N and P was obtained using 46 kg N ha−1 and 10 kg P ha−1. With balanced application of other nutrients, use of 230 kg N and 20 kg P ha−1 was recommended for tepid sub-moist mid-highlands and Vertisols. For tepid sub-humid mid-highlands, application of 46 kg N and 20 kg P ha−1 with balanced application of other nutrients was recommended. For Cambisols, application of 230 kg N and 40 kg P ha−1 was recommended with balanced application of the other nutrients. Similarly, application of 230 kg N, 40 kg P, and 10 kg S was tentatively recommended for cool sub-most mid highlands agro-ecology. However, response to K was inconsistent and therefore a firm recommendation could not be proposed for the study sites. Further research needs to be conducted on more soil types and locations.
Supplementary material
To view supplementary material for this article, please visit https://doi.org/10.1017/S0014479721000223
Acknowledgements
The authors thank the Ethiopian Institute of Agricultural Research, Oromia, Amhara, and Tigray research institutes for funding this research and generating data. We greatly appreciate the International Center for Tropical Agriculture and Deutsche Gesellschaft für Internationale Zusammenarbeit for organising the data and facilitating and financing the preparation of this manuscript.
Funding Support
This work was supported, in whole or in part, by the Bill & Melinda Gates Foundation [INV-005460]. Under the grant conditions of the Foundation, a Creative Commons Attribution 4.0 Generic License has already been assigned to the Author Accepted Manuscript version that might arise from this submission.
Conflicts of Interest
None.


 Open access