


Fig. 1 Revised cross-sectional DPM.
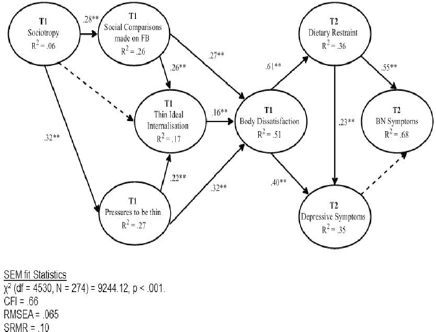
Fig. 2 Revised longitudinal DPM.
Published online by Cambridge University Press: 23 March 2020
The dual pathway model (DPM) attempts to explain the processes that are etiological to the development of Bulimia Nervosa (BN) symptomology by examining both individual and sociocultural risk factors of BN. The DPM, however, is yet to incorporate the sociocultural factor Facebook, which is important given the widespread use of the social media website Facebook. In addition, research has suggested that the personality trait sociotropy may increase vulnerability to developing BN symptoms, however, there is limited evidence examining this factor in the DPM.
To test a revised DPM with the inclusions of social comparisons made on Facebook and sociotropy both (a) cross-sectionally and (b) longitudinally.
Four hundred and seventy females participated at baseline (T1). Four weeks later, 274 females completed the follow-up assessment (T2), which assessed a subset of measures from the baseline assessment.
An acceptable fit for both DM models was obtained through Structural Equation Modeling (SEM) using MPlus (See Figs. 1 and 2).
Prevention and early intervention efforts for both depression and BN should focus on addressing appropriate Facebook and social media use and these interventions should be tailored to individuals scoring high on sociotropy.
The authors have not supplied their declaration of competing interest.
Fig. 1 Revised cross-sectional DPM.
Fig. 2 Revised longitudinal DPM.

Fig. 1 Revised cross-sectional DPM.

Fig. 2 Revised longitudinal DPM.
 You have
Access
You have
Access
Comments
No Comments have been published for this article.