Introduction
Attention to subjective wellbeing is increasing. As the developmental stage of a society enters the post-industrialised era there is often an increasing call for a shift in the focus of policy from economic development to the enhancement of wellbeing. Governments are becoming increasingly concerned with national happiness or quality of life in terms other than the more traditional economic indicators such as GDP (Bond, Reference Bond2003). In the field of health, the focus has gone beyond wiping out disease with more weight being given to wellbeing – ‘a positive and sustainable state that allows individuals, groups or nations to thrive and flourish’ (Huppert et al. Reference Huppert, Baylis and Keverne2004).
The nature of wellbeing is complicated and involves several concepts. Diener (Reference Diener1984) has defined two constituents of subjective wellbeing that have been widely cited. The first component involves mood state and is the result of an emotive judgement made by an individual when asked how happy she or he is, i.e. happiness. The second component is life satisfaction, which is a cognitive assessment of a person's quality of life ascertained by asking how satisfied a person is with her or his present state of life. Therefore, subjective wellbeing can refer to a measure of one's own state in both an affective way (happiness) and a cognitive way (life satisfaction).
Suicide is frequently used as an indicator of population mental health. However, it is influenced by a range of biological, psychological and social factors and suicide cannot be exclusively attributed to mental health problems (Hawton & van Heeringen, Reference Hawton and Van Heeringen2009). Suicide statistics are commonly available across time and countries/regions with reasonable reliability, particularly in countries with a comprehensive vital registration system (World Health Organization, 2014). The Mental Health Action Plan 2013–2020 published by the World Health Organization (2013) made suicide prevention an important priority and proposed that suicide be used as a proxy for population mental health. One of its global targets is to reduce suicide rates by 10% in individual countries by 2020. Furthermore, in the Sustainable Development Goals adopted by the United Nations, suicide rate is used as one of the indicators (indicator 3.4.2) to target ensuring for healthy lives and promoting wellbeing through the reduction of premature mortality from non-communicable diseases (United Nations, 2015).
Suicide is also considered to be an alternative measure of wellbeing (Helliwell & Putnam, Reference Helliwell and Putnam2004). It is often seen as the ‘tip of the iceberg’ to reflect the size of the wellbeing problem in a population. Although suicide data are based on the outcome of a behaviour (i.e. fatal suicide attempt) rather than subjective experiences (e.g. subjective feelings of distress), suicide death may reflect the wellbeing level at the extreme low end in the population.
Although subjective wellbeing and suicide rate are both potential indicators of population mental health, previous research into their relationship shows inconsistent findings. There is some evidence demonstrating that decreased subjective wellbeing is a risk factor for suicide based on individual-level data (Cutler et al. Reference Cutler, Glaeser, Norberg and Gruber2001; Koivumaa-Honkanen et al. Reference Koivumaa-Honkanen, Honkanen, Viinamäki, Heikkilä, Kaprio and Koskenvuo2001, Reference Koivumaa-Honkanen, Honkanen, Koskenvuo and Kaprio2003; Xu, Reference Xu2005; Sisask et al. Reference Sisask, Värnik, Kõlves, Konstabel and Wasserman2008; Sisask, Reference Sisask2010; Xu & Roberts, Reference Xu and Roberts2010; Liu et al. Reference Liu, Huang and Zhu2012; You et al. Reference You, Song, Wu, Qin and Zhou2014). In contrast, the ecological association between the population levels of subjective wellbeing and suicide is more complicated. In keeping with findings from person-based studies, some research indicates a negative association between national levels of happiness and suicide (Bray & Gunnell, Reference Bray and Gunnell2006; Helliwell, Reference Helliwell2007; Snider, Reference Snider2011), whilst other studies demonstrate that certain regions with high levels of happiness are, surprisingly, inclined to have high suicide rates (Daly et al. Reference Daly, Oswald, Wilson and Wu2011). Of note, in both the studies by Bray & Gunnell (Reference Bray and Gunnell2006) and Helliwell (Reference Helliwell2007), there was an overall association between higher levels of subjective welling and lower suicide rates across countries studied; however, subgroup analyses did show an association in the opposite direction among Western European countries (Bray & Gunnell, Reference Bray and Gunnell2006) and Scandinavian countries (Helliwell, Reference Helliwell2007). Previous research also showed that subjective wellbeing and suicide share similar social determinants, such as socioeconomic deprivation and social fragmentation (Daly & Wilson, Reference Daly and Wilson2009; Helliwell & Wang, Reference Helliwell and Wang2011; Hsu et al. Reference Hsu, Chang, Lee and Yip2015, Reference Hsu, Chang and Yip2017). Nevertheless, there is no known study considering the possible confounding effects of socioeconomic factors when examining the relationship between population wellbeing and suicide.
Hong Kong's suicide rate is not high compared with either that of neighbouring countries or the global average – its age-standardised rate of suicide (per 100 000) was 9.0 in 2015 (The Hong Kong Jockey Club Centre for Suicide Research & Prevention, 2017). This is in contrast to 8.5 in China, 12.1 in Taiwan, 15.4 in Japan, 24.1 in South Korea and the global average of 10.7 (World Health Organization, 2017). However, there are substantial variations in suicide rates across different areas within Hong Kong (Hsu et al. Reference Hsu, Chang, Lee and Yip2015). Previous research also indicates large area differences in life satisfaction (Hsu et al. Reference Hsu, Chang and Yip2017) and socioeconomic status (Hsu et al. Reference Hsu, Chang, Lee and Yip2015) in Hong Kong, making it a unique setting to investigate the interrelationship of the area levels of suicide, wellbeing and socioeconomic factors.
The aim of the present study is to examine the association between regional suicide rates and aggregated scores of subjective wellbeing measured by happiness and life satisfaction scales in Hong Kong. We have also included area socioeconomic characteristics in the analysis to investigate to what extent the association can be explained by socioeconomic factors.
Methods
Data
Assessment of happiness and life satisfaction
Data for happiness and life satisfaction were extracted from the first wave of The Hong Kong Panel Study of Social Dynamics (HKPSSD) conducted between April and December 2011 (Wu, Reference Wu2016). The HKPSSD is a longitudinal study of a representative sample of individuals living in Hong Kong. Overall, 7218 participants aged 15 years and above were enrolled in the survey; among them there were complete data for 6727 (93.2%) individuals who were included in this study. Each participant was assigned to one of the area units based on residential address. Data were compiled at two area levels: 18 districts (median population aged 15 years and above = 362 866 (interquartile rage 279 951–516 131)), and large street block (LSB; n = 1620; median population aged 15 years and above = 2061 (interquartile range 1428–4346)). There are three main regions in Hong Kong – Hong Kong Island, the Kowloon peninsula and the New Territories (Fig. 1a). These regions are further divided into 18 administrative districts. LSB is the smallest spatial aggregation with available detailed census data provided by the Census and Statistics Department of the Hong Kong Government. The boundaries of street blocks were demarcated by the Planning Department based on geographic features such as roads, coastlines and rivers. Data available at the two area levels allow us to examine the robustness of findings.
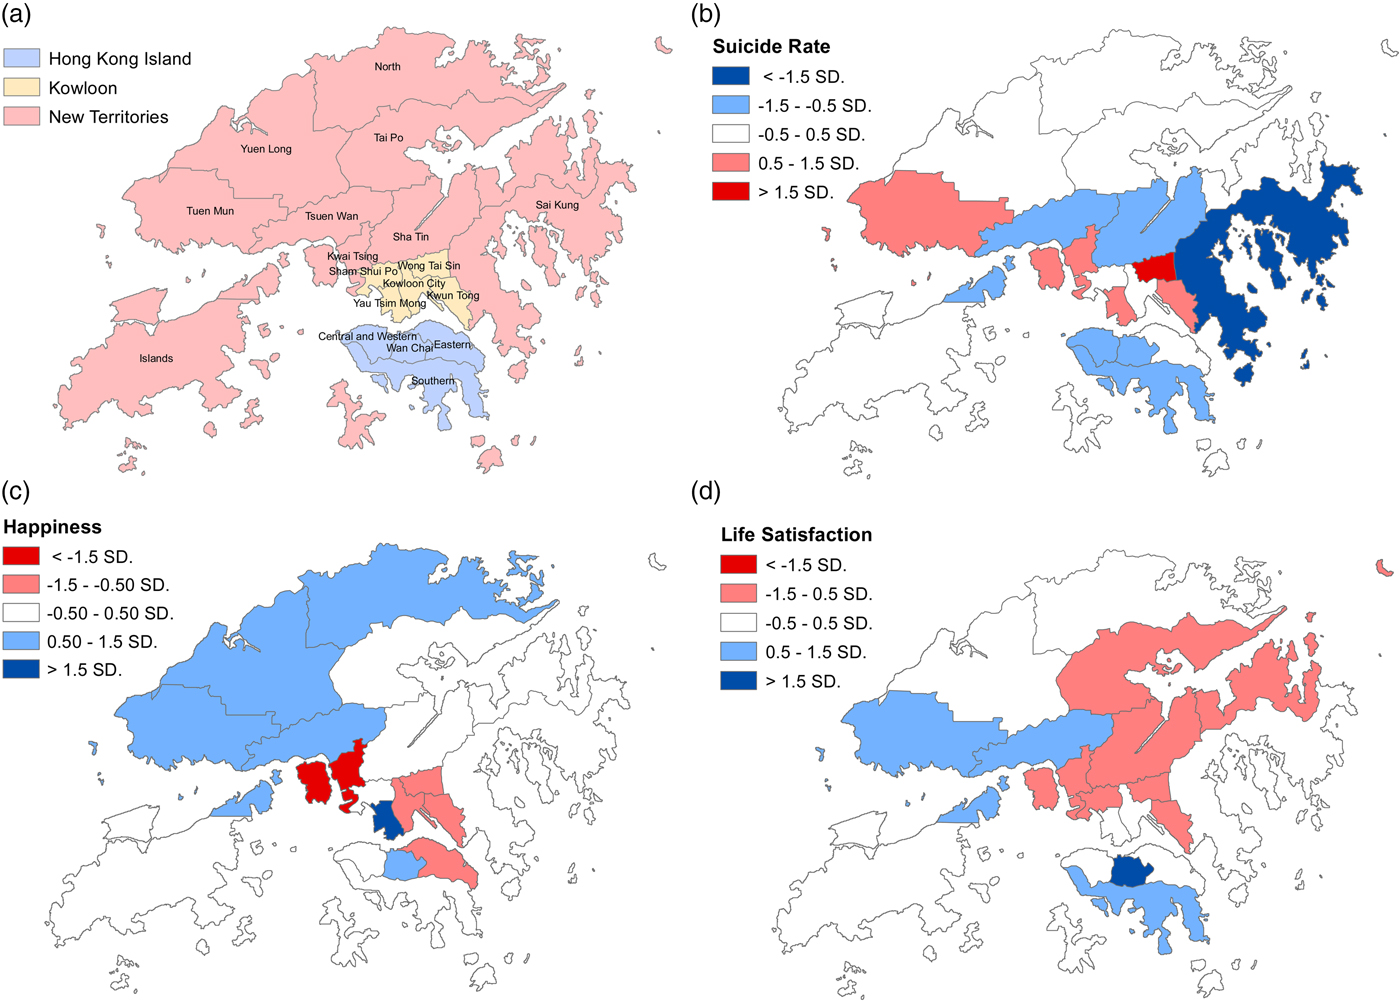
Fig. 1. Maps of (a) Hong Kong with the boundaries of 18 districts, (b) age-standardised suicide rates, (c) happiness and (d) life satisfaction across 18 districts in population aged 15 years or above. Note: red colour indicates above-average suicide rates and below-average levels of happiness or life satisfaction, i.e. poorer mental health; blue colour indicates below-average suicide rates and above-average levels of happiness or life satisfaction, i.e. better mental health; white colour indicates around average values.
Happiness was measured using the Subjective Happiness Scale (SHS; Appendix 1), which was developed by Lyubomirsky and Lepper to measure happiness using both absolute ratings (two items) and ratings relative to peers (two items) (Lyubomirsky & Lepper, Reference Lyubomirsky and Lepper1999), with a higher score indicating a higher level of happiness. The Chinese version of the SHS has been evaluated for its psychometric properties, linguistic equivalence of translation and reliability in several studies (Kashdan & Yuen, Reference Kashdan and Yuen2007; Chen et al. Reference Chen, Benet-Martínez and Harris Bond2008; Tse et al. Reference Tse, Lo, Cheng, Chan, Chan and Chung2010; Tam et al. Reference Tam, Lau and Jiang2012).
The Satisfaction with Life Scale (SWLS; Appendix 2), a five-item scale developed by Diener et al. (Reference Diener, Emmons, Larsen and Griffin1985), was used to measure an individual's life satisfaction. The total score of the SWLS was calculated for each participant, with a higher score indicating a higher level of life satisfaction. The Chinese SWLS has been shown to be a reliable and valid tool for measuring life satisfaction (Leung & Leung, Reference Leung and Leung1992; Shek, Reference Shek1998; Chen et al. Reference Chen, Benet-Martínez and Harris Bond2008).
Data for suicide and population
Suicide data (2005–2013) for people aged 15 years or above in Hong Kong were extracted from the files of the Coroner's Court. In Hong Kong, all unnatural deaths including suicides are investigated and certified by the Coroners. We included all deaths certified as suicide (International Classification of Diseases, Tenth Revision [ICD-10] codes X60-X84) in the study. In some previous studies, deaths of undetermined intent were included in the suicide data because a substantial proportion of suicides were misclassified as deaths of undetermined intent. In Hong Kong, the number of deaths classified as undetermined intent was very small (e.g. the undetermined death/suicide ratio was 0.02 in 2011) (Hsu et al. Reference Hsu, Chang, Lee and Yip2015). Thus, our analysis did not include deaths of undetermined intent. We used suicide data for 2005–2013, as 2005 and 2013 were the first and most recent years, respectively, when data with residential address information were available at the time of the study. We intended to include the largest sample possible to obtain stable estimates of local suicide rates and sufficient suicide numbers for our analyses in each small area. This time period includes the year when the survey data for individual happiness and life satisfaction were available, i.e. 2011. There were 8461 suicides over this time period; of these, 206 (2.4%) suicides were excluded from the analysis because they either had a missing or incomplete address, or had an address that was outside Hong Kong. Each suicide was assigned to one of the area units (i.e. districts and LSBs) based on the residential address before death. Population data for districts and LSBs were extracted from the 2011 census (N = 6 578 000 for population aged 15 years and above).
Data for area characteristics
The 2011 Hong Kong census data were used to calculate poverty rates and identify factors of area socioeconomic characteristics, which were then included in the correlational analyses. We calculated the poverty rates for each LSB using income information from the census – that is, the percentage of households with an income below the official poverty line, i.e. 50% below the median income by respective household size. The poverty rates for the 18 districts were extracted from the Hong Kong Poverty Situation Report 2012 published by the Hong Kong government (Government of the Hong Kong Special Administrative Region, 2012).
Exploratory factor analysis (EFA) was conducted to identify factors that characterised areas, based on data for 21 variables at the ‘LSB level’ (Table A1). These variables were selected on the basis of previous studies investigating associations between neighbourhood characteristics and mental health and illness in Hong Kong (Hsu et al. Reference Hsu, Chang, Lee and Yip2015; Kandt et al. Reference Kandt, Chang, Yip and Burdett2016) and other countries (Hiscock et al. Reference Hiscock, Macintyre, Kearns and Ellaway2003; Congdon, Reference Congdon2011, Reference Congdon2012). After an iterative process of variable selection with significant and specific loading, 12 out of the 21 variables contributed to the following four factors: (i) deprivation, (ii) Chinese ethnicity, (iii) social fragmentation and (iv) ageing (Table A1). To characterise each ‘district’, we chose the variables with the highest loadings for each of the four factors to represent its dimension and included these variables in the correlational analyses – (i) the percentage of households living in public housing, (ii) the percentage of Chinese people, (iii) the percentage of people who had moved from Mainland China within the previous 5 years (‘new immigrants from Mainland China’) and (iv) the percentage of people aged 65 years or over. ‘New immigrants from Mainland China’ refers to people who immigrated to Hong Kong after sovereignty was handed back to China in 1997. Social adjustment difficulties in this group of people were found in previous studies (Wong et al. Reference Wong, Chou and Chow2012) and were associated with poor mental health in this population (Chou, Reference Chou2012).
Table 1. Pearson correlations (r) and 95% confidence intervals (CIs) among happiness, life satisfaction, suicide and area characteristics in all sex/age groups combined across 18 districts and 30 quantiles of large street block (LSB)
Note. Values are shown in bold if 95% CIs are not included the null hypothesis (i.e. r = 0).
Although poverty rate was already included in the factor analysis process, it was investigated alongside the four derived factors in our analysis because of the recent emphasis placed on poverty alleviation by the Hong Kong Government, which published its first official report on poverty in 2012 (Government of the Hong Kong Special Administrative Region, 2012).
Statistical analysis
We calculated mean happiness and life satisfaction scores and age-standardised suicide rates for each of the 18 districts. For the analyses at the LSB level, a sufficient number of participants is needed in each area unit to obtain stable estimates of mean happiness and life satisfaction scores. However, the 6727 survey participants were distributed in only 921 of a total 1620 LSBs, i.e. there were no participants or data for happiness and life satisfaction in 699 LSBs. We thus defined 30 LSB quantiles according to the local poverty rates, and calculated mean happiness and life satisfaction scores and age-standardised suicide rates for each of the quantiles. There was a trade-off between the statistical stability of the happiness/life satisfaction estimates and suicide rates, which would increase with a smaller number of quantile groups, and the statistical power of the association analysis, which would increase with a larger number of quantile groups. Sensitivity analyses were conducted by grouping LSBs into 40 or 50 quantiles; nevertheless, some quantile groups had no elderly participants. We thus used 30 groups of LSBs in the main analysis and presented the results of sensitivity analyses using 40 or 50 groups in the appendix (Tables A2 and A3).
The World Standard Population (Ahmad et al. Reference Ahmad, Boschi-Pinto, Lopez, Murray, Lozano and Inoue2001) was used to directly standardise suicide rates for each district and LSB quantile. The factor scores of the four area characteristics were the weighted average of factor scores for every LSB in the same group. The weights were determined by the population of each LSB.
The associations between mean happiness and life satisfaction scores and suicide rates were assessed using Pearson's correlation coefficients. Partial correlations were also computed to control for each of the five area characteristics separately. For descriptive purposes, a correlation coefficient of 0–0.19 is deemed as very weak, 0.20–0.39 as weak, 0.40–0.59 as moderate, 0.60–0.79 as strong and 0.80–1 as very strong (Evans, Reference Evans1996). We also conducted analyses stratified by sex and age group (15–44 years, 45–64 years and 65 years and above) since previous studies showed variations in the associations between happiness/life satisfaction across sex/age groups (Bray & Gunnell, Reference Bray and Gunnell2006).
Mapping
Maps at the district level were produced using ArcGIS Version 10.0. Maps at the LSB level were not produced as there were no happiness/life satisfaction data in many of the LSBs as mentioned above. Choropleth maps with a five-category divergent red–blue colour scheme (Brewer, Reference Brewer1996) were used to show the spatial patterning of suicide, happiness and life satisfaction across the 18 districts. Red and blue with varying shades were used to indicate areas with poorer mental health (i.e. high suicide rates and low levels of happiness and life satisfaction) and better mental health (i.e. low suicide rates and high levels of happiness and life satisfaction), respectively; the central (average) category was shaded white. The standard deviation classification method was used for the cut-offs. The central category included a range spanning from 0.5 standard deviations (sd) below the mean scores to 0.5 sd above the mean, with the most extreme two categories representing the scores that were 1.5 sd from the mean. The digital boundary files of the 18 districts were provided by the Lands Department (Fig. 1a).
Results
Table A4 summarises the distribution of mean happiness and life satisfaction scores and age-standardised suicide rates across 18 districts and 30 quantiles of LSBs. The mean happiness scores of all sex/age groups combined ranged from 18.25 to 19.98 at the district level and 18.17 to 21.24 at the LSB quantile level; those of life satisfaction were 22.02–25.04 at the district level and 21.39–26.28 at the LSB quantile level. Suicide rates (per 100 000) of all sex/age groups combined ranged from 11.23 to 17.84 at the district level and 7.51 to 21.01 at the LSB quantile level. Males had lower levels of happiness and life satisfaction and higher suicide rates than women. While there were no clear age differences in the levels of happiness and life satisfaction, the elderly had the highest suicide rates. The elderly group had the widest range of the three measures across sex/age groups.
Geographic variation
The geographic distribution of age-standardised suicide rates across the 18 districts is shown in Fig. 1b. There was a 1.6-fold difference between the lowest suicide rate (11.23 per 100 000 in Sai Kung district) and the highest suicide rate (17.84 per 100 000 in Wong Tai Sin district). High suicide-rate districts appeared to cluster in Kowloon (i.e. Wong Tai Sin, Kwun Tong and Yau Tsim Mong) and some districts in the New Territories (i.e. Kwai Tsing and Tuen Mun). In contrast, all the districts on Hong Kong Island showed average or below average suicide rates. The maps of happiness (Fig. 1c) and life satisfaction (Fig. 1d) showed some similar patterns: low levels of happiness and life satisfaction were seen in Kowloon and some districts in the New Territories, whilst districts on Hong Kong Island generally had high or average levels, except for the low happiness levels observed in the Eastern district.
Ecological associations
Table A5 presents the distribution of area socioeconomic characteristics at the district and LSB levels that were investigated in the following analyses. Table 1 presents Pearson correlations between mean happiness and life satisfaction scores, suicide rates and the five area characteristics for all sex and age groups combined. The associations between happiness/life satisfaction and suicide were also shown graphically in scatter plots (Fig. 2 for 18 districts and Fig. 3 for 30 quantiles of LSBs). At the district level, happiness and life satisfaction were strongly correlated (r = 0.64) and were weakly and negatively correlated with suicide rates (r = −0.32 and −0.36, respectively) and variously negatively correlated with the five area variables (r ranged from −0.05 to −0.66), whilst suicide rates were positively correlated with the five area variables (r ranged from 0.28 to 0.68). In contrast, the correlations were stronger at the LSB quantile level: happiness and life satisfaction were very strongly correlated (r = 0.94), and were very strongly and negatively correlated with suicide rates (r = −0.83 and −0.84, respectively) and the five area variables (r ranged from −0.83 to −0.93), whilst suicide rates were positively correlated with the five area variables (r ranged from 0.79 to 0.94).
Fig. 2. Scatter plots of suicide rate against (a) mean happiness scores in (i) all sex/age groups; (ii) males aged 15 and above; (iii) females aged 15 and above; (iv) males aged 15–44, (v) 45–64, and (vi) 65+ years; (vii) females aged 15–44, (viii) 45–64, and (ix) 65+ years; and suicide rate against (b) mean life satisfaction scores in (i) all sex/age groups; (ii) males aged 15 and above; (iii) females aged 15 and above; (iv) males aged 15–44, (v) 45–64 and (vi) 65+ years; (vii) females aged 15–44, (viii) 45–64 and (ix) 65+ years across 18 districts.
Fig. 3. Scatter plots of suicide rate against (a) mean happiness scores in (i) all sex/age groups; (ii) males aged 15 and above; (iii) females aged 15 and above; (iv) males aged 15–44, (v) 45–64 and (vi) 65+ years; (vii) females aged 15–44, (viii) 45–64 and (ix) 65+ years; and suicide rate against (b) mean life satisfaction scores in (i) all sex/age groups; (ii) males aged 15 and above; (iii) females aged 15 and above; (iv) males aged 15–44, (v) 45–64, and (vi) 65+ years; (vii) females aged 15–44, (viii) 45–64 and (ix) 65+ years across 30 quantiles of LSBs.
Tables 2 and 3 present simple and partial correlation coefficients between the mean happiness and life satisfaction scores and suicide rates by sex and age across the 18 districts and 30 quantiles of LSBs. Overall, the pattern was very similar to the associations of happiness and life satisfaction with suicide, although the correlations were much weaker at the district level than the LSB quantile level. Men generally showed stronger correlations than women. Of note, all the associations were substantially attenuated or became null after controlling for area characteristics, although the confounding effect was less marked when controlling for Chinese ethnicity than other factors. At the district level (Table 2), there were generally very weak or weak negative correlations across sex/age groups, except for strong negative correlations in elderly men and very weak or weak positive associations in young and middle-aged women. At the LSB quantile level (Table 3), the correlations were mostly strongly negative across sex/age groups, with the only exception of elderly women who showed weak or very weak negative correlations. Sensitivity analyses grouping all the LSBs into 40 or 50 quantiles showed very similar patterns (Tables A2 and A3).
Table 2. Pearson correlation coefficients (r), and 95% confidence intervals (CIs), between regional happiness and life satisfaction mean scores and suicide rates across 18 districts
Note. Values are shown in bold if the 95% CIs do not include the null hypothesis (i.e. r = 0).
Table 3. Pearson correlation coefficients (r), and 95% confidence intervals (CIs), between regional happiness and life satisfaction mean scores and suicide rates across 30 quantiles of large street block (LSB)
Note: Values are shown in bold if the 95% CIs do not include the null hypothesis (i.e. r = 0).
Discussion
Main findings
Our ecological analyses showed that area levels of happiness and life satisfaction were strongly correlated with each other, and that they both demonstrated an inverse association with suicide rates – the higher the area level of happiness or life satisfaction, the lower the local suicide rate. The associations were much stronger at the LSB quantile level than the district level (correlation coefficients −0.83 and −0.84 at the LSB quantile level v. −0.32 and −0.36 at the district level). Controlling for area characteristics had a profound impact on the correlations. The strength of the associations was markedly attenuated or became null after controlling for area variables, indicating that the associations of happiness and life satisfaction with suicide were largely the result of their strong associations with area socioeconomic characteristics. The pattern was similar in men and women and across sex/age groups, although men generally showed stronger correlations than women.
Strengths and limitations
This is among the first studies to use population-based data for happiness, life satisfaction and suicide to conduct a systematic investigation into the inter-correlations of the three potential makers of population mental health whilst considering the impact of local socioeconomic characteristics. The territory-wide district-based data allow for the mapping of geographic variations in wellbeing and suicide, whilst the small area data at the LSB level allow for an assessment of the robustness of findings across two area levels. The stronger correlations found at the LSB quantile level than the district level suggest that data at the smaller area-level captured stronger associations due to a higher level of homogeneity within the area unit.
There are several limitations to the study. First, this is a cross-sectional and ecological study, and the associations found at the area level may not represent the associations at the individual level. However, our aim was to assess the association between potential indicators of population mental health, which are inherently ecological in nature, and thus the ecological study design is appropriate for this purpose. Second, the measures used in the study reflect mental health at the very positive end (happiness and life satisfaction) and the very negative end (suicide rate). Other mental health indicators that could be considered may include the prevalence of psychiatric morbidity and psychiatric service use. Third, our analysis was restricted to one city and the findings may not be generalised to other settings. However, data across different areas within one territory are more comparable than international data from different countries. The homogeneous setting can avoid doubtful comparability because of variations in religions, languages and cultures, administrative systems and data reliability. Finally, socioeconomic factors could be a confounder, a mediator or both in the link between wellbeing and suicide, and adjusting for a mediator may underestimate the causal relationship between the exposure and outcome. However, in this ecological analysis, an area's socioeconomic circumstances are more likely to act as a confounder because they are more likely to be upstream determinants for both population wellbeing and suicide rate, as opposed to functioning as a mediator which would be influenced by an area's level of wellbeing and then in turn influences the local suicide rate.
Comparison with previous findings
There have been previous ecological studies within (Snider, Reference Snider2011) or across countries (Bray & Gunnell, Reference Bray and Gunnell2006; Helliwell, Reference Helliwell2007) that yielded findings in agreement with ours demonstrating inverse associations between happiness/life satisfaction and suicide. However, we found stronger associations (at least at the small area level) than past research indicated, probably because of the use of small-area, homogenous data. Corresponding findings were also shown in person-based, prospective studies, which demonstrated decreased happiness to increase future suicide risk (Koivumaa-Honkanen et al. Reference Koivumaa-Honkanen, Honkanen, Viinamäki, Heikkilä, Kaprio and Koskenvuo2001, Reference Koivumaa-Honkanen, Honkanen, Koskenvuo and Kaprio2003; Sisask et al. Reference Sisask, Värnik, Kõlves, Konstabel and Wasserman2008; Sisask, Reference Sisask2010; Liu et al. Reference Liu, Huang and Zhu2012; You et al. Reference You, Song, Wu, Qin and Zhou2014). Possible causal pathways underlying the wellbeing-suicide association could be that positive emotions cause people to cope with stress better (Scheier and Carver, Reference Scheier and Carver1992) and avoid potentially harmful strategies, like denial and giving up (Segerstrom et al. Reference Segerstrom, Taylor, Kemeny and Fahey1998).
Few studies have examined the sex- and age-specific effects on the strength of the associations between happiness/life satisfaction and suicide. One ecological study based on data from 32 European countries suggested a stronger correlation in men than women and an increased strength of the association with age (Bray & Gunnell, Reference Bray and Gunnell2006). Our findings regarding sex differences were in keeping with Bray and Gunnell's study, whilst our age-stratified analyses showed that associations between happiness/life satisfaction and suicide tended to be strongest in the middle-aged group (45–64 years) and weakest in the elderly (65+ years), at least at the LSB quantile level. Our previous study showed stronger associations between suicide and area socioeconomic characteristics in younger than older age groups in Hong Kong (Hsu et al. Reference Hsu, Chang, Lee and Yip2015); this could contribute to stronger correlations between subjective wellbeing and suicide in younger than older people as our data showed that subjective wellbeing, similar to suicide, was also strongly associated with area socioeconomic factors in Hong Kong. Furthermore, it has also been previously shown that the suicide rate among older adults in Hong Kong was less related to poverty and more related to health (Tsoh et al. Reference Tsoh, Chiu, Duberstein, Chan, Chi, Yip and Conwell2005).
The strong association detected between area socioeconomic factors and happiness/life satisfaction is in keeping with a recent multi-level analysis based on the same survey data used in this study (Hsu et al. Reference Hsu, Chang and Yip2017), which showed an association between individual-level life satisfaction and neighbourhood-level socioeconomic factors, including poverty rate, deprivation, social fragmentation, and aged population, even after controlling for a range of individual-level variables. In this multilevel analysis, however, an area's level of Chinese ethnicity was not associated with life satisfaction after controlling for individual-level variables. Furthermore, there was no statistical evidence for an association between individual-level main language spoken (Cantonese, other Chinese, English or others) and life satisfaction after controlling for other individual-level variables. This suggests that the ecological association of Chinese ethnicity with happiness/life satisfaction found in the current study may be confounded by other individual-level factors.
A striking finding from our study is that the confounding effect of area socioeconomic factors could explain most of the associations between local levels of happiness/life satisfaction and suicide rates. Adjustment for socioeconomic factors was occasionally considered in previous studies of wellbeing and suicide. Helliwell's studies showed that social capital and trust was negatively associated with suicide rates and positively associated with subjective wellbeing (Helliwell, Reference Helliwell2007; Helliwell & Wang, Reference Helliwell and Wang2011). This is in agreement with our finding that socioeconomic variables need to be considered when examining the effect of subjective wellbeing on suicide. Besides, the marked area difference in suicide rates (1.6-fold across districts and nearly 3-fold across quantiles of LSBs) and the association with socioeconomic variables indicate the impact of socioeconomic inequalities on mental health in the Hong Kong population. The rapidly growing gap between the rich and poor and the resulting discontentment may underlie the observed pattern: Hong Kong's Gini coefficient increased from 0.451 in 1981 to 0.537 in 2011, which is much higher than that of most developed economies.
Of note, some previous studies provided evidence of a paradox – some happy places had high rates of suicide – within the USA (Daly et al. Reference Daly, Oswald, Wilson and Wu2010) and across Western European (Bray & Gunnell, Reference Bray and Gunnell2006) and Scandinavian countries (Helliwell, Reference Helliwell2007; Daly et al. Reference Daly, Oswald, Wilson and Wu2011). Relative comparison has been proposed as one possible mechanism for the paradox (Daly et al. Reference Daly, Oswald, Wilson and Wu2010, Reference Daly, Oswald, Wilson and Wu2011); that is, dissatisfied people in a happy place may feel particularly distressed by comparison, thus increasing their mental anguish and risk of suicide. Daly et al. (Reference Daly, Oswald, Wilson and Wu2011) suggested that it is necessary to control for socioeconomic disadvantage related to suicide risk to prevent falsely concluding the absence of a happiness–suicide paradox. However, our data showed no evidence for the paradox with or without controlling for socioeconomic factors. Future research is needed to explain why the paradox was found in some settings but not others.
Implications
The strong correlation between happiness/life satisfaction and suicide found in this study provides evidence supporting the utility of both happiness and life satisfaction as indicators for population mental health that can help with population suicide risk assessment. Socioeconomic factors should be considered when developing interventions aimed at increasing wellbeing, especially in settings with a large income disparity. The strong associations of suicide with poverty/deprivation and social fragmentation also indicate that these dimensions could be potential targets for social policies aimed at suicide prevention. Finally, there is a need for more research into the inter-relationship between wellbeing, suicide and socioeconomic factors and the mechanisms underlying their associations.
Acknowledgements
The authors would like to thank Professor Wu Xiaogang and other team members in the Center for Applied Social and Economic Research, Hong Kong University of Science and Technology, for data collection and management of the HKPSSD data. We also acknowledge support from the RGC-CPU Strategic Public Policy Research Scheme (HKUST6001-SPPR-08) and Wan Fang Hospital (107-wf-swf-05). This study was approved by the Human Research Ethics Committee, The University of Hong Kong.
Conflict of Interest
The authors declare that they have no conflict of interest.
Funding
This study was funded by a General Award from the Hong Kong Jockey Club Charities Trust (for P Yip; HKU Project Code AR130006) and Wan Fang Hospital (for C-Y Hsu; 107-wf-swf-05).
Author contributions
Conception and design of the study: CYH, SSC, PSFY. Analysis and interpretation of study data: CYH, SSC, PSFY. Wrote first draft of the paper: CYH. Critiqued the output for important intellectual content: CYH, SSC, PSFY. Approved the final article: CYH, SSC, PSFY.
Availability of Data and Materials
The data used in the study were from the Center for Applied Social and Economic Research, Hong Kong University of Science and Technology (HKPSSD) and the Government of the Hong Kong Special Administrative Region of the People's Republic of China (suicide and census data), and we are not permitted to share the data.
Appendix 1
Subjective happiness scale
Instructions to participants: For each of the following statements and/or questions, please circle the point on the scale that you feel is most appropriate in describing you.
Appendix 2
Satisfaction with-life scale
Below are five statements with which you may agree or disagree. Using the 1–7 scale below, indicate your agreement with each item by placing the appropriate number on the line preceding that item. Please be open and honest in your responding. The 7-point scale is as follows:
1 = strongly disagree
2 = disagree
3 = slightly disagree
4 = neither agree nor disagree
5 = slightly agree
6 = agree
7 = strongly agree
1. In most ways my life is close to my ideal.
2. The conditions of my life are excellent.
3. I am satisfied with my life.
4. So far I have gotten the important things I want in life.
5. If I could live my life over, I would change almost nothing.
Table A1. Loadings on four factors of area socioeconomic characteristics at the large street block (LSB; n = 1620) level (Hong Kong census data 2011) a, b
Table A2. Pearson correlation coefficients (r), and 95% confidence intervals (CI), between regional happiness and life satisfaction mean scores and suicide rates across 40 quantiles of large street block (LSB)
Table A3. Pearson correlation coefficients (r), and 95% confidence intervals (CI), between regional happiness and life satisfaction mean scores and suicide rates across 50 quantiles of large street block (LSB)
Table A4. The distribution of happiness and life satisfaction mean scores and age-standardised suicide rates across 18 districts and 30 quantiles of large street block (LSB)
Table A5. Summary statistics of area socioeconomic characteristics across 18 districts and 1620 large street blocks (LSBs) in Hong Kong (based on 2011 census data)