Introduction
Urinary tract infections (UTIs) are common [Reference Nicolle1]. Although most UTIs are treated on an outpatient basis, severe or complicated cases often require hospitalisation [Reference Gupta2]. Over the past decade, the incidence of hospitalisations for UTIs has increased [Reference Zilberberg and Shorr3, Reference Simmering4], perhaps in part due to increasing resistance to antimicrobials used to treat out-patient UTIs [Reference Gupta2, Reference Zilberberg and Shorr3, Reference Olson, Harrell and Kaye5], and the resulting need to admit patients to the hospital for treatment with intravenous antimicrobials [Reference Simmering4]. Individual-level-risk factors for UTIs include female sex [Reference Foxman6], previous history of UTIs [Reference Scholes7], sexual activity [Reference Hooton8] and perhaps limited fluid intake or dehydration [Reference Pitt9–Reference Eckford12].
In addition to individual-level-risk factors, environmental risk factors for UTIs may also exist. Indeed, single-centre studies have demonstrated a seasonal increase in UTIs, with more cases occurring in summer months [Reference Anderson13–Reference Czaja15]. Also, Internet search terms related to UTIs peak in summer months in several parts of the world, indicating a strong seasonal interest in UTIs in the Internet-using public [Reference Rossignol16]. In the USA, the incidence of admissions is highly seasonal for patients admitted to the hospital with a primary diagnosis of UTI and for admissions with a primary diagnosis of pyelonephritis [Reference Simmering4]. The reasons for the observed seasonality in the incidence of UTIs are unknown [Reference Stamm14]. Possible explanations for the seasonality include ‘inadvertent prophylaxis’ with antimicrobials to treat respiratory infections in the winter [Reference Stamm14], and changes in sexual partners and travel [Reference Freeman, Anderson and Sexton17]. Another hypothesis is that weather, specifically warmer temperatures in the summer [Reference Falagas18, Reference Fletcher19], lead to the observed summer spike. Temperature may have an impact on hosts, urinary pathogens or both. From the standpoint of the host, UTIs may be more common in the warm summer months if higher temperatures reduce hydration levels, even sub-clinically, resulting in lower levels of urine production and decreased the clearance of potential urinary pathogens [Reference Nygaard and Linder10–Reference Eckford12]. In addition, if the temperature is the driving factor in the seasonality, this may explain why seasonality was not observed in studies in countries with cooler climates. For instance, studies in Sweden, Norway, the Netherlands and the UK do not demonstrate a seasonal incidence of UTIs [Reference Ferry, Burman and Mattsson20–Reference Pead, Maskell and Morris26].
The purpose of this paper is to determine if and to what extent the seasonality of UTIs may be attributable to changes in temperature, specifically higher temperatures. We explored this question using a case–control design and historical weather data from the National Oceanic and Atmospheric Administration in conjunction with a nationally representative sample of hospital admissions in the continental USA from 1998 to 2011 to ensure a geographically and climatologically diverse sample.
Methods
Data sources and case definition
Data for inpatient admissions were obtained through the Healthcare Cost and Utilization Project (HCUP) Nationwide Inpatient Sample (NIS), maintained by the Agency for Healthcare Research and Quality (AHRQ). The NIS is based on a stratified sample of hospitals, with information on 20% of all discharges in the USA in a given year. Observational studies using de-identified data such as these are deemed exempt by our Institutional Review Board.
Cases of UTI were identified as hospitalisations with a primary diagnosis of pyelonephritis (ICD-9 codes: 590.10, 590.11, 590.2, 590.80, 590.81, 590.9), cystitis (595.0, 595.3, 595.4, 595.89, 595.9) or UTI (599.0). We excluded all records for patients under 18 or that lacked one or more of the explanatory variables (age, sex, primary payer, length-of-stay, admission month, admission year or the hospital identifier). All records with a primary diagnosis code that was not recorded as 590.xx, 595.xx or 599.0 were controls.
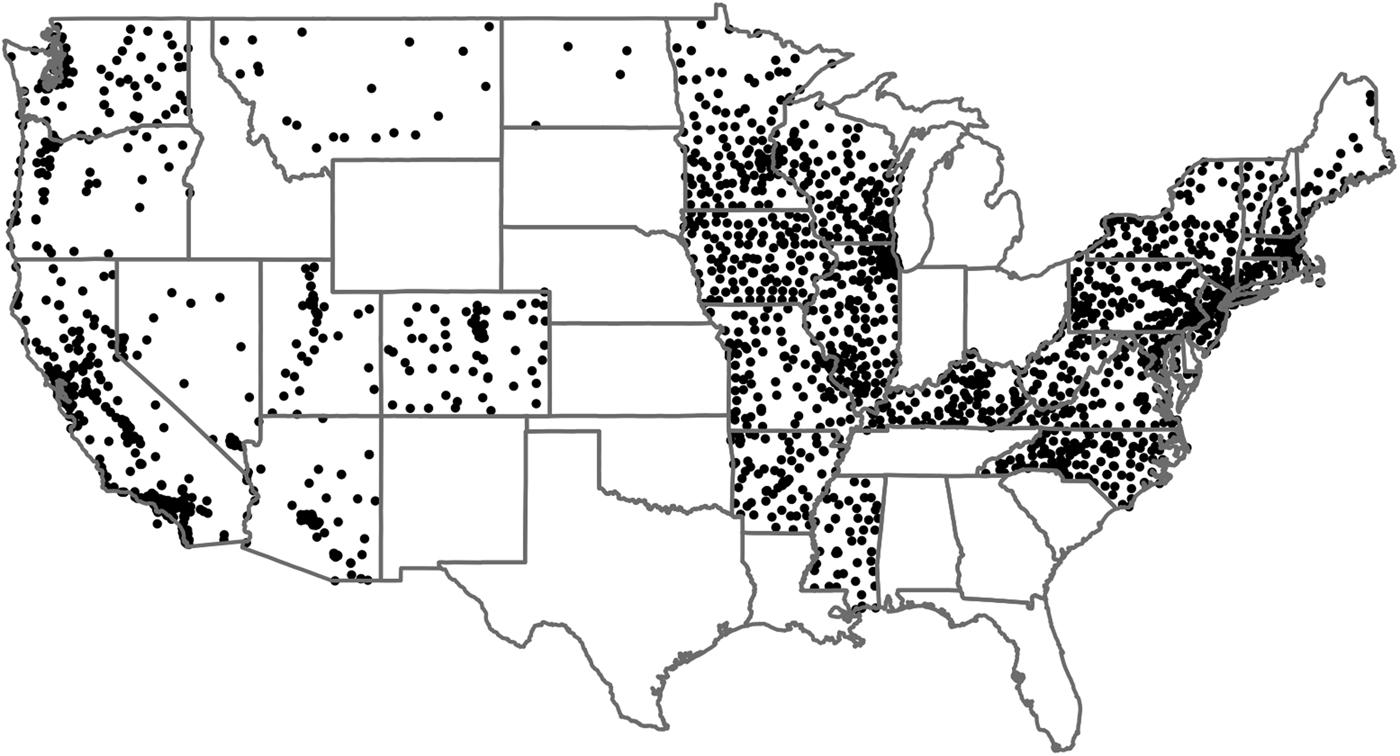
Hospitals were geolocated using the US Census Bureau geocoder, and the American Hospital Association (AHA) reported address, city and state. For hospitals that the US Census Bureau failed to locate, the Google Maps Geocoding API was used. Linkage between the AHA-provided address and the events in the NIS was possible using the AHA-hospital identifier (AHA ID). The NIS contains data from 47 of the 50 US states (Alabama, Delaware and Idaho did not contribute) but not all states report hospital identifiers. Of the 47 participating states, 18 do not report the AHA identifier (Alaska, Georgia, Hawaii, Indiana, Kansas, Louisiana, Maine, Michigan, Nebraska, New Mexico, Ohio, Oklahoma, South Carolina, South Dakota, Tennessee, Texas, West Virginia and Wyoming) and one does not report admission month (Florida). Thus, for this study we included data from only 28 of the 50 states (Arizona, Arkansas, California, Colorado, Connecticut, Illinois, Iowa, Kentucky, Maryland, Massachusetts, Minnesota, Mississippi, Missouri, Montana, Nevada, New Hampshire, New Jersey, New York, North Carolina, North Dakota, Oregon, Pennsylvania, Rhode Island, Utah, Vermont, Virginia, Washington and Wisconsin). There were 2604 hospitals included in our analysis. The locations of the hospitals used in this analysis are shown in Fig. 1.

Fig. 1. Locations of 2604 hospitals used in our analysis. Additional states contribute to the NIS project; however, some omit key variables (e.g. Florida does not report month of hospitalisation) while others do not report the hospital's AHA identifier.
Weather definition
Weather data were obtained from the Integrated Surface Dataset (ISD) reported by the National Climatic Data Center (NCDC) of the National Oceanic and Atmospheric Administration. The mean temperature was computed for each of the weather stations in the NCDC dataset. The temperature was aggregated to the monthly scale. We used weather stations within 100 km of a hospital to compute the average temperature at that hospital in a given month. The average temperature is robust to the exact size of this radius – the values obtained from considering only the nearest station, those within 16.1 km or those within 40.2 km were all highly correlated with those obtained for 100 km (r > 0.99).
We opted to use monthly average temperature over monthly average high temperature. The heat advisory and warnings issued in the USA by the National Weather Service are conditioned both on high daytime temperatures and high nighttime temperatures [27]. The lack of nighttime cooling is as important in these heat-related health advisories as the high daytime temperature because high daytime temperatures (e.g. 35 °C) have different effects when the nighttime temperatures are much cooler (e.g. 18–20 °C) vs. still very warm (e.g. 25 °C). Mean monthly temperature does take nighttime relief from heat into account, but mean monthly high temperature does not (26.5–27.5 °C in the first case vs. 30 °C in the second).
Regression model
We regressed whether a given admission was for a UTI on the following explanatory variables: patient age (5-year groups), female sex, primary payer, length-of-stay for that admission, the number of the Elixhauser comorbidities, hospital latitude (binned into ⩽35°N, >35°N ⩽40°N, >40°N ⩽45°N, >45), admission year and the mean temperature in the past month (in 2.5° steps from −5 to 30 °C, as well as under −5 or over 30 °C). Additionally, to account for seasonality not related to weather (e.g. summer travel or excess antibiotic use in the winter), we included a set of month-of-year indicators as fixed effects in our model. Because our outcome is a binary variable, we used logistic regression as our modelling framework. We characterised effects based on point estimates for odds ratios (ORs) and 95% confidence intervals (CIs).
As a measure of the explanatory power of the temperature information, we fit a second model using the same predictors as above but without including temperature. We compared the estimated monthly fixed effects with and without the inclusion of temperature to characterise the seasonality potentially attributable to temperature: in the absence of weather variables, monthly fixed effects will also control for monthly changes in weather.
Results
The NIS from 1998 to 2011 contains information on 108 672 727 hospitalisations, of which 108 648 915 (99.98%) had at least one reported diagnosis. Of those visits, 1 026 959 were for ICD-9 code 599.0 (UTI, site not specified), 19 348 were for 595.x (cystitis) and 36 885 were for 590.x (pyelonephritis) for a total of 1 414 192 cases (1.30% of all visits) and 107 234 723 controls. After requiring the patient to be an adult and to have all of the necessary variables reported, 775 060 (54.8% of starting) cases (180 530 from pyelonephritis, 11 916 from cystitis and 582 614 without a site specified) and 56 515 940 (52.7% of starting) controls remained, for a rate of 1.35%. The vast majority of lost observations occur when we require admission month (not reported by FL) or hospital AHA ID (not reported by 18 states). The sample sizes remaining after applying each of our exclusion criteria are reported in Table 1.
Table 1. Reductions in sample size after applying exclusion criteria and/or omitting records due to missingness

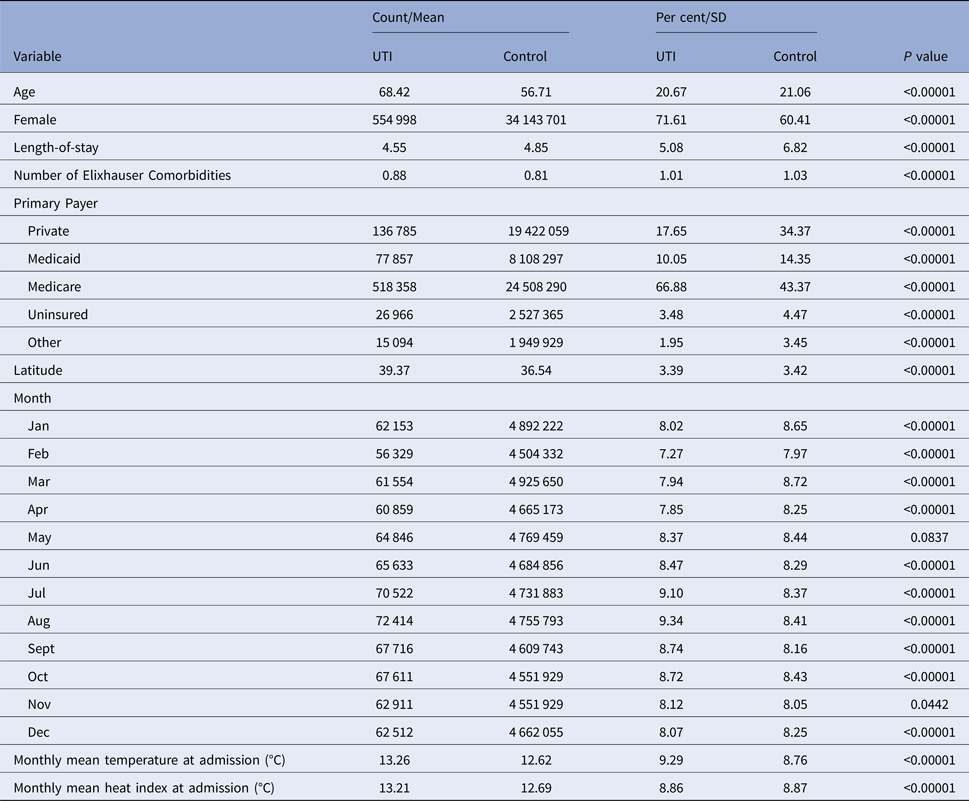
Summary statistics for our sample are detailed in Table 2. Of note, UTI patients were older than non-UTI patients, with a mean age of 68.42 vs. 56.71. Correspondingly, many more UTI patients reported Medicare as their primary payer (66.9% vs. 43.4%). A larger share of UTI patients was female (71.6%) vs. non-UTI patients (60.4%). The average outdoor temperature among UTI stays was about 0.6 °C higher than among non-UTI stays (13.26 °C vs. 12.62 °C).
Table 2. Summary statistics for UTI and non-UTI hospitalisations used in analysis

Comparisons between continuous variables were conducted with a two-sample t-test. Comparisons between the categorical variables were for equality of proportion in the given bin and were conducted with a chi-squared test.
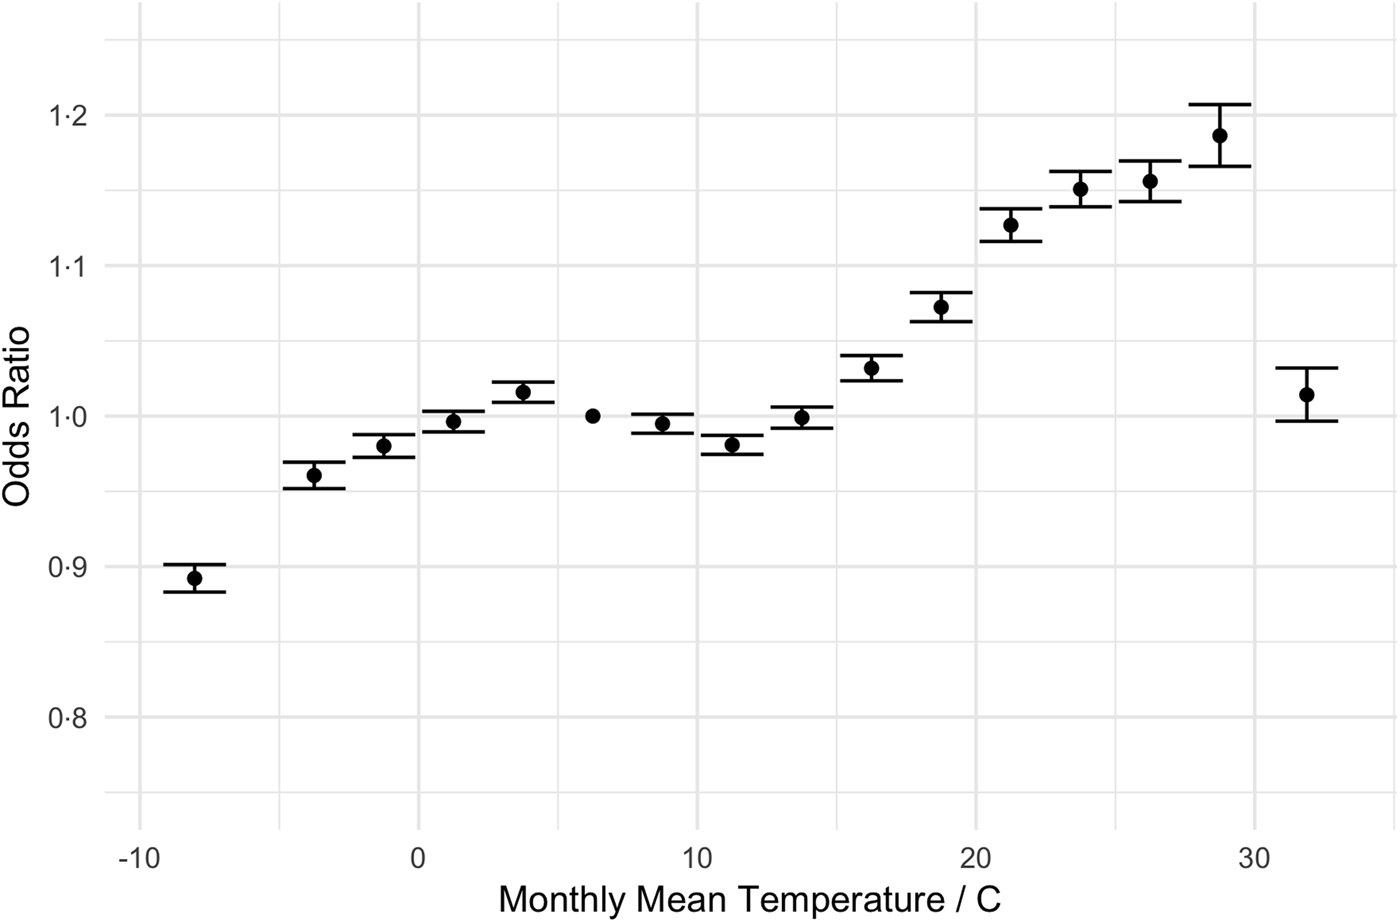
Our regression results are shown in Table 3. The odds of an admission being a UTI increased with age (e.g. 61–65-year olds have 1.48 times greater odds than those 18–25), and women are more likely to be admitted for a UTI than men (OR = 1.73, 95% CI 1.73–1.73). The primary predictor of interest, temperature, shows little change in the odds of an admission diagnosis of a UTI as mean temperature increases from 7.5 to 15 °C. However, the odds of a UTI diagnosis grew with mean temperatures between 15 and 30 °C (1.01–1.19). Relative to months with mean temperatures 5–7.5 °C, admissions in months with average temperatures of 27.5–30 °C have 19% greater odds of being a UTI (95% CI 17–20%). This pattern is most evident when displayed graphically. Figure 2 displays the change in the odds of an admission for a UTI over a range of average monthly temperatures.

Fig. 2. Adjusted odds ratios (ORs) for diagnosis of UTI as a function of temperature (graphical display of data in Table 3). The dot denotes the point estimate of the OR and the error bars reflect the 95% CI about that estimate. ORs are adjusted for year, month-of-year, climate and demographic factors.
Table 3. Logistic regression results for effect of temperature on the odds of a primary diagnosis of UTI, controlling for demographics and other confounders

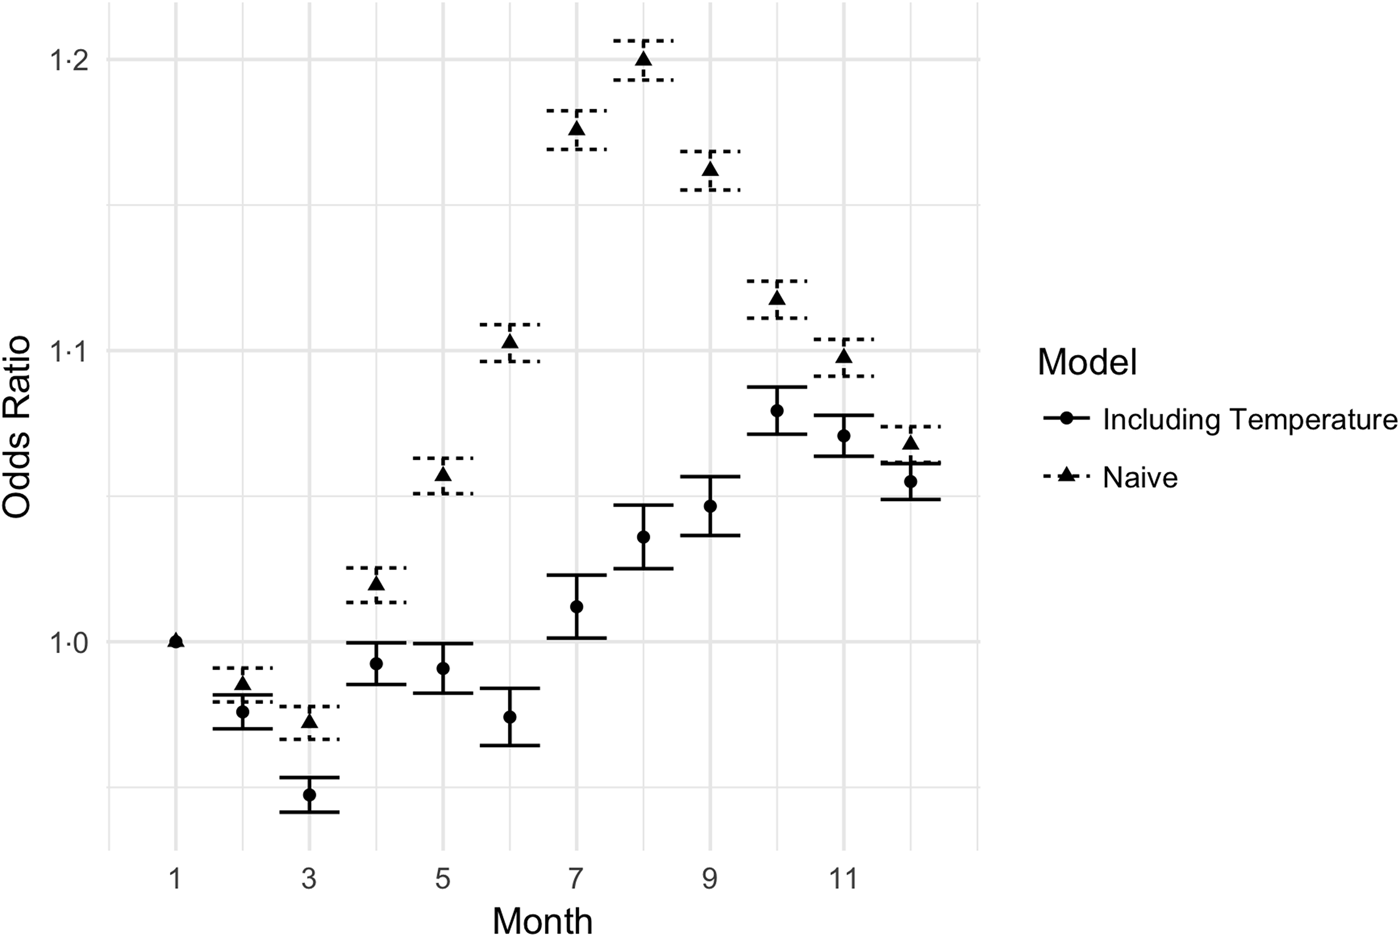
To further examine the effect of temperature on UTIs, we compared a model with temperature variables to a model without temperature variables. The estimates of the monthly fixed effects in the summer were significantly reduced in the model that included temperature; see Figure 3. In the model without temperature, the fixed effects describe the entire seasonal process, while in the model with temperature, the fixed effects explain non-temperature-related seasonal processes. Inclusion of temperature reduced the maximum amplitude of the summer spike (August) from 1.23 to 1.06, a decrease of 72%.

Fig. 3. Monthly odds ratios for UTI in models with and without temperature included. The triangles reflect the estimated monthly effects for a model including year, month-of-year, climate and demographics, but not including the mean monthly temperature. The circles are the estimated monthly effects in a model with temperature data included. The error bars are 95% CIs.
Discussion
Using a nationally representative sample, we show that seasonality in the incidence of hospitalisation for UTIs can be explained, in large part, by changes in weather. Specifically, warmer weather is associated with an increase in the odds of admissions for UTIs. Relative to months with average temperatures of 5–7.5 °C, there is a 19% increase in the odds of an admission being diagnosed with a UTI for months where the average temperature is 27.5–30 °C. This increased risk of admission for UTIs persists after adjusting for admission year, admission month, sex, age, payer and even overall patient severity.
With respect to warmer temperatures, we observed a dose–response relationship between temperature and the odds of a diagnosis of UTI until average temperatures exceed 30 °C (see Fig. 1). With average temperatures of 30 °C and over, we found that the odds of admissions for UTIs decreased relative to similarly warm temperatures, which may be caused by changes in behaviour associated with extremely hot weather. Known behaviour changes in response to extremely warm weather include alterations in physical and outdoor activities [Reference McCormack28]. Additionally, the use of air conditioning during periods of warm weather reduces the potential exposure to very warm temperatures [Reference Barreca29]. Thus, the drop-off in risk of UTI admissions may be driven by changes in behaviour during exceptionally warm days. Alternatively, the decrease in risk may be driven by other causes such as adaptation to high temperatures in the warmer regions. People living in regions that routinely experience hot temperatures may be less sensitive to extremely warm weather than people living in generally cooler regions and therefore may be less affected [Reference Barreca29]. Such differences may not be captured by our models.
Many infections are seasonal [Reference Fisman30]; many are related to weather [Reference Fisman31–Reference Schwab, Gastmeier and Meyer33]; and some of these are possibly related to changes in climate [Reference De Souza, Owusu, Wilson and Chhetri34, Reference Rohayem35]. Relative to other infections, there are few investigations regarding the seasonality and associations between weather and UTIs. However, our results are consistent with the existing literature. For example, the fraction of visits to Greek primary care physicians for UTI and the temperature in the previous 3 days were strongly correlated [Reference Falagas18]. Another study of hospitalisations in New York State found that hot weather was associated with an increase in admissions for renal failure and UTIs [Reference Fletcher19]. This study used a case-crossover design, where the period some weeks before and after the UTI diagnosis was used to generate controls. They reported a 5°F (2.78 °C) increase in temperature compared with the control periods and sustained over 6 days was associated with a 25% increase in the odds of a UTI admission [Reference Fletcher19]. Less direct evidence for a relationship between UTI risk and temperature exists. Bloodstream infections, nearly 80% of which started as a UTI, had a relationship with temperature in Olmsted County, MN [Reference Al-Hasan36] and Baltimore, MD [Reference Perencevich37]. In addition, a spike in infections caused by Gram-negative pathogens appeared to be related to temperature in German ICUs [Reference Schwab, Gastmeier and Meyer33].
If this relationship between temperature and UTI risk were causal, it may help explain the disagreement between prior work done in the USA and places with more variable climates and warmer summers that have identified seasonality, and places such as Sweden [Reference Ferry, Burman and Mattsson20, Reference Eriksson, Giske and Ternhag23] and Norway [Reference Vorland, Carlson and Aalen21, Reference Vorland, Carlson and Aalen22] with cooler summers where the incidence of seasonality has not been described. For instance, a typical July average temperature in Oslo is 16 °C and London is 19 °C, both of which fall towards the lower portion of the dose–response relationship described by our model. In contrast, US cities have much warmer July average temperatures. For instance, St. Louis has an average July temperature of 27 °C. Thus, in the absence of these high summer temperatures, seasonality of UTIs may be reduced, thus explaining the lack of seasonality observed in Scandinavia, the UK and Netherlands [Reference Ferry, Burman and Mattsson20–Reference Stansfeld25].
Although there may be alternative explanations for the association between UTIs and warmer temperatures, a biologically plausible hypothesis is that increased temperatures may lead to volume depletion, thereby leading to decreased urinary volume and flow. In turn, decreased urinary flow can hamper the removal of bacteria from the urinary tract [Reference Beetz11], thus increasing the potential for a UTI [Reference Beetz11]. Alternatively, more concentrated urine may increase the likelihood of developing a UTI. Although the relationship between dehydration and fluid intake and UTI is somewhat controversial [Reference Beetz11, Reference Remis38, Reference Lotan39], some studies have shown that increasing hydration can decrease the risk of UTIs. For example, a study of Finnish school teachers found that among the half that limited drinking water at work to avoid using the restroom, the odds of developing a UTI were 2.2 times larger than among their more hydrated peers [Reference Nygaard and Linder10]. Another case–control study found that cases drank less water and voided less frequently than controls [Reference Ervin, Komaroff and Pass40]. Also, another study found that adjusting fluid intake according to urine osmolality [Reference Eckford12] was associated with a reduced risk of UTIs. Thus, even limited volume depletion from warmer temperatures may be sufficient to significantly increase the risk of developing a UTI.
Our results have health implications for alerts related to temperature, especially for women at high risk for UTIs, as many women suffer from recurrent UTIs [Reference Scholes7, Reference Fihn41–Reference Gupta43]. Currently, the National Weather Service in the United States issues a Heat Advisory when both the maximum heat index will be over 38 °C and the nighttime temperatures remain above 24 °C for two or more days. An Excessive Heat Warning is issued when the maximum heat index temperature is forecast to be above 41 °C with nighttime lows above 24 °C for two or more days [27]. However, people may already alter their behaviour at these high temperatures – perhaps even without the warnings. Yet based on our results, more moderate temperatures – average temperatures of 22.5–30 °C – are where the greatest risk of UTIs from environmental exposures may exist. Thus, interventions may need to focus on less-extreme temperatures in order to moderate the effects of temperature on UTIs by either maintaining hydration or avoiding exposure to warm weather situations that could lead to volume depletion.
In recent decades, much attention in the field of infectious diseases has been focused on global warming or climate change [Reference Greer, Ng and Fisman32, Reference De Souza, Owusu, Wilson and Chhetri34, Reference Rohayem35, Reference Hay44, Reference Ogden45]. Many have speculated that warmer temperatures could increase many different infections, especially potentiating the spread of vector-borne disease, as vectors spread to new locations when temperatures rise (e.g. tick-borne diseases in Canada) [Reference Greer, Ng and Fisman32, Reference Hay44–Reference Gubler46]. Our results indicate that if temperatures consistently increase, the odds of UTIs may also increase at a population level. However, our findings also indicate that behaviour changes may help ameliorate the risk of warmer weather with UTIs. Adopting such changes may be more difficult in some locations, for example, in locations without a high penetration of air conditioning or a lack of clean drinking water.
Our results show that a substantial portion of the seasonality in UTI hospitalisation incidence may be attributed to temperature. The residual seasonality in UTI hospitalisation incidence may be due to factors other than temperature. However, it is also likely that because we aggregate weather and UTI incidence to the monthly level, we may not be able to explain as much UTI seasonality as if we had more granular data (e.g. date-of-admission). This is a limitation of our data. Although our temperature data are very granular, the NIS only reports the month of the hospitalisation, and we are forced to aggregate temperature to the monthly scale as a result.
One potential limitation of our work is that we selected dry bulb temperature as our measure of weather and did not include other factors related to both perceived temperature and the physiological response to heat such as humidity. However, repeating our analysis using heat index, a measure that combines temperature and humidity to estimate the perceived temperature on a reference human [Reference Rothfusz47], does not change our results (estimated ORs for the dose–response relationship of UTI admission with heat indices from 10 to 30 °C range from 1.00 to 1.17, and decrease to 1.14 for heat indices over 30 °C). We opted to focus our results on dry bulb temperature as the models gave similar results.
A limitation to the generalisability of our results is our focus on hospitalisations with a primary diagnosis of ICD-9-CM 590.xx, 595.xx and 599.0. We made this study design choice made to restrict the sample to admissions for UTI and to reduce the potential heterogeneity introduced by including secondary diagnoses for UTI, which may have developed during hospital admissions (e.g. catheter-associated UTIs). However, as a result, our descriptions of temperature-dependent seasonality may not apply to more UTIs that may cause other syndromes requiring hospitalisation (e.g. sepsis), where the diagnosis of UTI might not have been coded as the primary reason for admission. The extent to which our results do or do not generalise to these populations will need to be addressed by future investigation. An addition limitation regarding the generalisability of our results relates to our study being restricted to only UTIs resulting in hospitalisation. UTIs are largely treated on an outpatient basis, and it is possible that this restriction leads to selection effects and may not hold for less severe cases of UTIs not requiring hospital admission. Finally, our study uses administrative (i.e., billing) data and do not have any information about medications, test results or microbiological data. Thus, we cannot examine, for example, if pathogens responsible for UTIs or treatments for UTIs change with the seasons.
Despite limitations associated with our investigation, we demonstrate a strong, dose-dependent and biologically plausible relationship between average temperature and UTI risk. Admissions at hospitals in warm months (temperatures of 22.5–30 °C) have odds of being diagnosed as a UTI that are up to 1.19 times larger than in cooler months (temperatures of 5–7.5 °C). Our results may help explain the pathogenesis of UTIs and help identify new risk factors in specific populations. More temperature-based investigations are needed both at the population level with more granular data (e.g. daily data) and at an individual level.
Acknowledgements
This work was supported by the National Heart, Lung and Blood Institute at the National Institutes of Health (grant number K25HL 122305) [to L.A.P.]; the University of Iowa Health Ventures’ Signal Center for Health Innovation [to P.M.P. and J.E.S.]; and a dissertation fellowship from the University of Iowa College of Pharmacy [to J.E.S.].
Declaration of Interest
None.


