


INTRODUCTION
Dengue is one of the most widespread mosquito-borne diseases in the world and its global range of transmission has increased dramatically in recent decades [Reference Gubler and Clark1–Reference Wu3]. Some 2.5 billion people are now at risk from dengue fever. It has been estimated that there are 50 million dengue infections worldwide per year, with several hundred thousand cases of dengue haemorrhagic fever, mostly in children aged <15 years, with a mortality rate of about 2·5% [4]. Dengue is caused by a flavivirus that is transmitted by mosquito vectors, in particular the domesticated species Aedes aegypti [Reference Gubler2]. A. aegypti thrives in urban areas, thus transmission is most common in urban settings [Reference Derouich5]. The large-scale reappearance of dengue over the past few decades means this disease is now a serious public health problem, especially in tropical and subtropical regions [Reference Gubler and Clark1, Reference Gubler2, Reference Teixeira6–Reference Kay9] including Queensland, Australia, which in 2009 experienced the largest dengue epidemic in recent history.
With the rapid development of geographic information systems (GIS), spatial data analysis is playing an increasingly important role in infectious disease epidemiology [Reference Hu10–Reference Clements12]. Mosquito density and longevity depend on environmental and ecological factors (e.g. temperature, humidity, precipitation and presence of mosquito-breeding habitats) [Reference Gatton13–Reference Benthem15]. Mosquito-borne diseases are often clustered in high-risk areas. The identification of these high-risk areas can assist existing surveillance and control efforts by permitting limited resources to be expended where they are most likely to have an impact. In the case of Queensland, identification of high-risk areas will enable currently overstretched public health units to concentrate their efforts in areas where dengue outbreaks are most likely to occur.
In this study we analysed the spatio-temporal distribution of notified dengue fever infections using GIS and spatio-temporal analysis methods. First, we aimed to determine if dengue notifications are clustered at the postal area (PA) level, then we aimed to visualize smoothed patterns of dengue risk (eliminating ‘noise’ due to small area variation) and to identify clusters of PAs with high and low dengue risk. Finally, we aimed to determine if the spatial pattern of dengue has changed in Queensland over a 12-year period (1993–2004). We interpreted the findings to facilitate more efficient risk-based dengue surveillance.
MATERIALS AND METHODS
Study area
Queensland is located in the northeast of Australia between latitudes of 10–28° S and longitudes of 138–153° E. The south-east corner is the most densely populated part of the state. Queensland occupies the north-eastern quarter of the continent and covers approximately 1 727 200 km2, with 7400 km of mainland coastline. The state is divided into 404 PAs, with populations ranging in size from 60 to 92 317. PAs are widely used by researchers in Australia because they are readily available in many datasets. There is significant variation in climate across the state. Low rainfall and hot summers are typical for the inland west, a monsoonal pattern of wet and dry seasons occurs in the far north, and warm temperate conditions occur along the coastal strip. Low minimum temperatures are experienced in southern ranges and inland.
Data collection
As dengue is a notifiable disease, positive test results by law have to be reported by laboratories to the Queensland Department of Health, where they are archived by the Communicable Diseases Unit [16]. We obtained a computerized dataset containing numbers of notified dengue fever cases (acquired locally and overseas) by PA in Queensland for the period of 1 January 1993–31 December 2004 from the Queensland Department of Health. Each notification included a unique reference number, date and PA of onset. This data can be used for monitoring trends of notifiable dengue fever and for targeting research, prevention, and control efforts [Reference Miller17]. Relevant population data and electronic boundaries of PAs were retrieved from the national census database managed by the Australia Bureau of Statistics.
Spatial autocorrelation analysis
Moran's I spatial autocorrelation statistic was calculated to determine whether spatial clustering was a feature of dengue in three different periods of 1993–1996, 1997–2000 and 2001–2004 (Appendix 1). Note that it is a ‘global’ autocorrelation statistic, i.e. it indicates whether there is spatial autocorrelation in the dataset but does not indicate the location of spatial clusters. Moran's I ranges from −1 to 1 and can be interpreted as follows: a value close to 0 indicates spatial randomness, while a positive value indicates positive spatial autocorrelation and a negative value indicates negative spatial autocorrelation.
The locations of dengue fever cases were geo-coded to digital base PA maps using ArcView [18]. A contiguity-based spatial weights matrix using a rook structure (where PAs that shared a border were considered neighbours) was constructed for each pair of PAs. Moran's I requires an assumption of constant variance. Since this assumption was not appropriate given that incidence at the PA level varied greatly in different populations, the Assuncao-Reis empirical Bayes standardization was performed. Following calculation of Moran's I, a permutation test was conducted to determine the significance of spatial clustering [Reference Anselin19].
Spatial smoothing using empirical Bayesian analysis
Spatial smoothing can be used to reduce random variation associated with small populations and enables identification of spatial disease clusters that may not be apparent from direct observation of the raw data [Reference Goodchild20, Reference Anselin21]. We grouped the dataset into three categories, each consisting of a 4-year period between 1993 and 2004. For each period, we spatially smoothed the dengue incidence data using an empirical Bayes spatial smoothing procedure (Appendix 2) using the GeoDa software [Reference Anselin19].
Spatial cluster analysis
Local indicators of spatial association (LISA) analysis was used to identify high-high and low-low groups of PAs (typically referred to as spatial clusters) and high-low and low-high groups of PAs (termed spatial outliers) using the GeoDa software [Reference Anselin19]. High-high refers to PAs with high dengue incidence that are surrounded by neighbouring PAs with high dengue incidence and low-low refers to PAs with low dengue incidence that are surrounded by neighbouring PAs with low dengue incidence – these are indicative of positive spatial autocorrelation. High-low refers to PAs with high dengue incidence that are surrounded by PAs with low dengue incidence and low-high refers to PAs with low dengue incidence that are surrounded by PAs with high dengue incidence; these are indicative of negative spatial autocorrelation. We used a spatial empirical Bayes transformation to smooth the incidence of dengue, and applied the rates to identify dengue clusters. The statistical significance of clusters and outliers was tested by comparing 999 Monte Carlo permutations, generated under conditions of complete spatial randomness.
Dynamic dispersion of dengue fever
We attempted to identify whether changes in dengue fever incidence varied with latitude and longitude of PA centroids in the periods 1993–1996, 1997–2000 and 2001–2004. Logistic regression models were constructed with the dichotomous outcome variable defined as whether or not an increase of dengue fever occurred in each PA between the three periods. Longitude and latitude of PA centroids was entered as explanatory variables. Spatial dispersions were expressed in terms of odds ratios (OR) for longitude and latitude, with 95% confidence intervals (CI).
RESULTS
Descriptive analysis
Table 1 shows summary statistics for monthly average numbers of PAs with notified dengue cases in Queensland. For 1993–1996, 1997–2000 and 2001–2004 these were 1·9, 3·4 and 6·1, respectively. There was a clear trend of geographic expansion of dengue transmission in Queensland.
Table 1. Descriptive statistics of monthly numbers of postcode areas with notified dengue cases
* Q1, first quartile value.
† Q3, third quartile value.
Figure 1 shows that there was a striking variation in monthly numbers of dengue cases and monthly numbers of PAs with dengue from 1993 to 2004. A large peak of dengue incidence occurred in April 1993 (283 cases). Peaks in incident cases generally coincided with high monthly numbers of PAs with dengue fever cases.
Fig. 1. Numbers of dengue cases (![]() ) and postcode areas (PAs) with dengue notifications (······) between January 1993 and December 2005 in Queensland, Australia.
) and postcode areas (PAs) with dengue notifications (······) between January 1993 and December 2005 in Queensland, Australia.
Boxplots of the monthly numbers of PAs with dengue indicate a strongly seasonal pattern (with a peak in autumn) and also suggest that an upward trend of dengue incidence occurred from 1993 to 2004 (χ2=57, P=0·000) (Fig. 2).
Fig. 2. Boxplots of the seasonal distribution of numbers of postcode areas (PAs) with dengue infection in three periods, Queensland Australia. The boxplot displays the values of the 25th, 50th and 75th percentiles. The whiskers extend to the most extreme data point <1·5 times the inter-quartile range.
Figure 3 shows the geographic distribution of raw incidence of notified dengue cases in Queensland in the three time periods. The PAs with the highest total number of dengue cases were ‘4810’ in 1993–1996 (303 cases), ‘4870’ in 1997–2000 (220 cases) and ‘4870’ in 2001–2004 (425 cases).
Fig. 3. Choropleth maps showing raw dengue incidence rates in three periods.
Spatial autocorrelation of dengue fever
There was a significant positive spatial autocorrelation of dengue incidence for all three periods, with Moran's I statistics of 0·143 (95% CI 0·142–0·145, P=0·004) during 1993–1996, 0·087 (95% CI 0·085–0·090, P=0·017) during 1997–2000, and 0·026 (95% CI 0·025–0·027, P=0·033) during 2001–2004 (Table 2). There was a decrease in spatial autocorrelation over the study period, reaching the lowest value during 2001–2004.
Table 2. Spatial autocorrelation analysis for dengue in Queensland, 1993–2004
Spatial empirical Bayesian smoothed rates
Figure 4 depicts the geographic distribution of smoothed estimates of dengue incidence in Queensland in the three time periods. It shows that the incidence of dengue varied geographically across the state. A PA with a small population at risk tended to have its observed rates adjusted considerably towards the neighbourhood average whereas for a larger PA, the rate did not substantially change.
Fig. 4. Spatially smoothed maps of dengue incidence using empirical Bayesian rates in three periods. Spatially smoothed map for dengue fever incidence was created for correcting the variance instability of incidences.
LISA analysis
Figure 5 shows four types of spatial correlation observed between PAs with dengue cases (high-high, low-low, high-low, low-high) in three different periods; The areas shaded in bright red and bright blue had positive spatial autocorrelation while those shaded in light red and light blue had negative spatial autocorrelation. The high-high clusters were primarily concentrated in the north of Queensland during 1993–1996 and low-low clusters were occurred in the south-east of Queensland during 2001–2004.
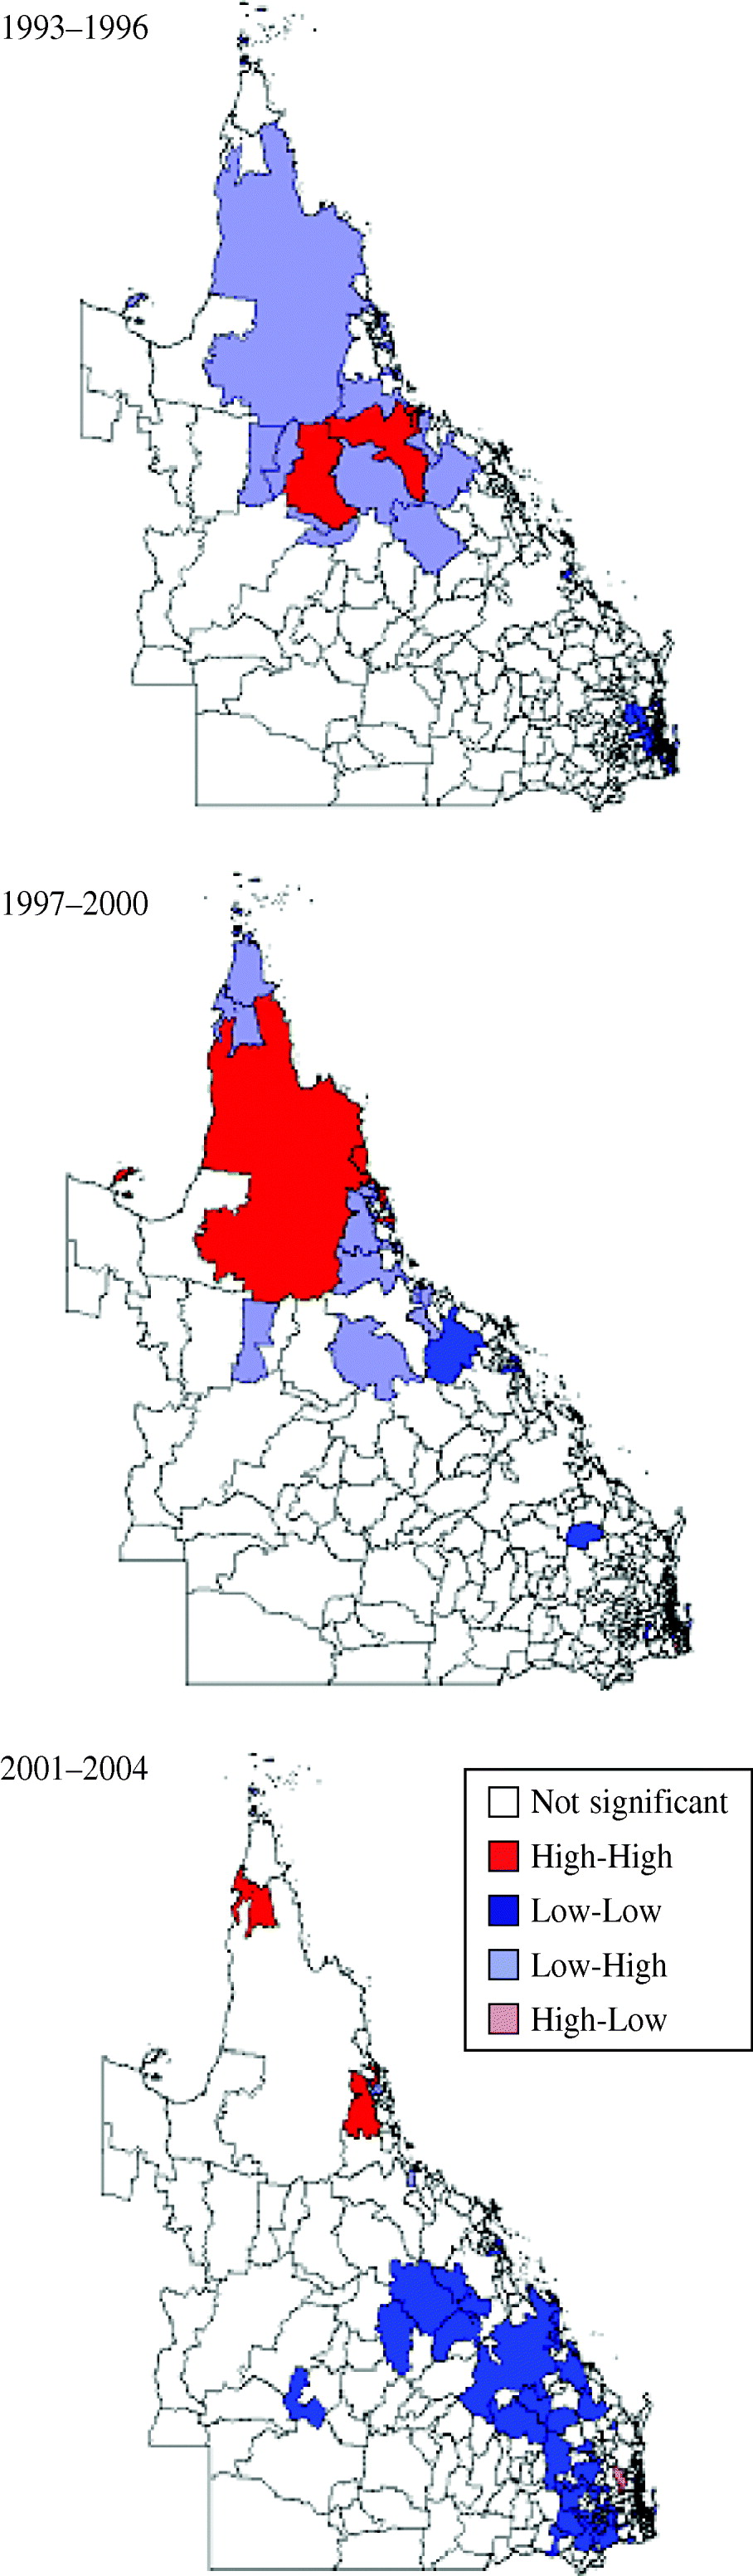
Fig. 5. Local indicators of spatial association cluster maps of dengue fever in three periods. The areas shaded in bright red and bright blue had positive spatial autocorrelation while those shaded in light red and light blue had negative spatial autocorrelation of dengue fever incidences. A positive spatial autocorrelation refers to a map pattern where geographic features of similar dengue incidences tend to cluster on a map, whereas a negative spatial autocorrelation indicates a map pattern in which geographic units of similar dengue incidences scatter throughout the map.
Spatio-temporal trends in dengue incidence
Table 3 shows that geographical variation (i.e. longitude and latitude) was associated with changes of dengue fever. The results indicated that changes of dengue fever were significantly associated with longitude (OR 1·28, 95% CI 1·18–1·38) and latitude (OR 0·91, 95% CI 0·86–0·97) between the periods 2001–2004 and 1997–2000, and associated with longitude (OR 1·12, 95% CI 1·06–1·20) and latitude (OR 0·96, 95% CI 0·90–1·01) between the periods 1997–2000 and 1993–1996, and associated with longitude (OR 1·24, 95% CI 1·15–1·33) and latitude (OR 0·95, 95% CI 0·90–1·00) between the periods 2001–2004 and 1993–1996.
Table 3. Changes of dengue fever on latitude and longitude, Queensland, Australia, 1993–2004
OR, Odds ratio; CI, confidence interval.
* Period 1, 1993–1996; period 2, 1997–2000; period 3, 2001–2004.
DISCUSSION
The results of this study indicated significant variation in the spatial distribution of dengue fever notifications in Queensland and that the geographic range of notified cases has expanded in Queensland over the study period. High-incidence clusters were primarily concentrated in northern Queensland and the transmission of dengue fever appears to have expanded in Queensland during 1993–2004.
The climate of north Queensland provides a suitable habitat for A. aegypti, which is widely present in this region [Reference Mackenzie22]. Major outbreaks of dengue, which have occurred in Cairns, Townsville and the Torres Strait islands [Reference Hanna23, Reference Hanna24] have increased in frequency and intensity over recent years [16]. The virus is not currently endemic in Australia and local transmission is usually initiated by infected travellers [Reference Mackenzie22]. According to notifications to Queensland Health, there is an average of 10 imported cases to north Queensland each year. About 60% of these cases were from Papua New Guinea and East Timor, with most of the remainder coming from Thailand, Bali and the South Pacific nations [16]. Climate factors (rainfall, temperature, humidity) influence mosquito survival and longevity [Reference Bangs25, Reference Depradine and Lovell26]. The area suitable for transmission of dengue fever might increase due to global warming [Reference Kovats27–Reference McMichael31]. Recent research suggests that under the ‘no action’ policy scenario, the dengue zone could move 1800 km south along the densely populated coastal and hinterland strip of south-eastern Australia as far as Sydney by 2100 [Reference Woodruff32]. Our study suggests that the geographic range of dengue transmission had already begun to extend south-easternwards in Queensland between 1993 and 2004.
Social and economic factors may also play an essential role in the transmission of dengue fever [Reference Mondini and Chiaraualloti-neto33]. Tourism and travel have also become important mechanisms for facilitating the spread of dengue fever and its vectors [Reference McBride34, Reference Schwartz35]. Unplanned urbanization and declining/inadequate resources for vector control are also among key factors that promote dengue transmission [Reference Gubler and Clark36]. Recent research shows the implementation of new water tanks, combined with already warm summer temperatures, could spread dengue fever [Reference Beebe37]. However, the use of air conditioning, screens and safe water supplies can help prevent and protect people from dengue fever [Reference Reiter38].
Spatial autocorrelation and LISA analysis are valuable tools to study how spatial patterns change over time. This study shows that dengue fever in Queensland has high-to-low spatial autocorrelation in three different periods and provides an indication of clustering patterns within Queensland. LISA shows that there was high-high (hot spot) clustering of dengue in the north of Queensland, indicating a high positive spatial autocorrelation between these PAs in this area. There was a low-low (cold spot) cluster of PAs in the south-eastern area of the state during 2001–2004, indicating a low positive spatial autocorrelation in the south of the state (Fig. 5). The changes in ‘hot’ and ‘cold’ spot clustering between the study periods suggest that changes in regional socio-ecological characteristics might continue to play an important role in determining dengue fever transmission. The spatial approach in this study may be used in the surveillance of dengue fever and other infectious diseases to identify and monitor high-risk areas over different periods of time.
This is the first study to examine the geographic variation of dengue transmission in Queensland using GIS and spatial analysis approaches and lays a foundation for further investigation into the social and environmental factors responsible for changing disease patterns. The results can be used to identify high-risk areas where surveillance efforts should be concentrated and where public health interventions are most needed.
This study also has three limitations. First, in our analysis, reported cases were aggregated by PA, which prohibits analysis at a higher spatial resolution and might lead to important clusters being filtered out but this is the highest resolution at which the data are currently available. Second, there was also likely to be variation in the quality of the National Notifiable Diseases Surveillance System (NNDSS) data. For instance, awareness of dengue fever among medical practitioners and the public may vary with time and place, and it might affect assessment of the geographic distribution of this disease. Underreporting is possible in the NNDSS data when people infected by dengue have subclinical infections and/or did not seek medical attention [Reference Mackenzie39]. Finally, this study only focused on the geographic variation of dengue transmission but did not examine its causes. Future research should determine the key socio-ecological factors (e.g. social, demographic, climate, vegetation, and mosquito density) which affect the transmission patterns of dengue fever.
In summary, this study has revealed that the transmission cycles of dengue fever vary in different spatio-temporal settings, and the geographic distribution of dengue fever appears to have expanded over recent years. Based on these findings, it is necessary to further improve our understanding of the impact of socio-environmental change and ecosystem stress on the transmission of dengue fever. Early warning systems should be developed to improve the effectiveness and efficiency of dengue control and prevention programmes, as no vaccine against different strains of dengue virus is available. Evidently, to achieve these goals, a well-coordinated, interdisciplinary approach is imperative and urgently needed.
ACKNOWLEDGEMENTS
We thank the Queensland Department of Health for providing the data on dengue numbers. The study was funded by National Health and Medical Research Council, Australia (no. 519 788).
APPENDIX 1
Moran's I
Moran's I is defined by:
where
x i and x j denote the observed value at location i and j, x is the average of the x values over the n locations, and w ij is the spatial weight measure.
APPENDIX 2
Empirical Bayesian rates
If we assume that the prior distribution is characterized by a mean θ and variance ɸ, the Bayesian estimate for the underlying risk at i then becomes a weighted average of the raw rate p i and the prior, with weights inversely related to their variance. This can be shown to yield:
where
and P i is the population at risk in area i.
DECLARATION OF INTEREST
None.


