


Introduction
Foodborne illness remains a global public health concern [Reference Havelaar1, Reference Newell2]. In Canada, foodborne pathogens cause an estimated 4 million cases of gastrointestinal illness annually from known and unspecified agents and serotypes of Campylobacter, Escherichia coli and Salmonella are commonly implicated [Reference Thomas3]. Annual cases in Canada were estimated as 447, 122 and 270 per 100 000 people for Campylobacter, E. coli and Salmonella, respectively [Reference Thomas3]. These cases represent a significant cost to the Canadian economy in terms of lost production and medical treatment estimated at approximately $325 million per annum [Reference Copeland and Wilcott4–6].
The incidence of enteric infections in the Canadian population increases with air temperature and may change in response to global climate change [Reference Fleury7]. Evidence for the link between climate and microbial foodborne disease also comes from the observed latitudinal gradients in the amount of foodborne and diarrhoeal illnesses, changing disease patterns during El Niño warming and links between foodborne illnesses and severe weather events [Reference Rose8, Reference Park, Park and Bahk9]. A statistical association between foodborne contamination or disease and short-term temperature changes suggests that foodborne disease will be affected by long-term climate changes such as increased average air temperatures and precipitation frequency or intensity [Reference Ebi10, Reference Semenza11]. This relationship is complex, as there are many direct and indirect mechanisms whereby climate can influence foodborne illness.
Directly, the survival rates of most enteric pathogens in the environment are, within limits, positively correlated with ambient temperature [Reference Semenza11]. Laboratory studies have shown the survival capacity of bacteria such as E. coli can be related to temperature, moisture and other abiotic and biotic variables such as pH and interactions with the microbial community [Reference Dirk Van Elsas12]. Seasonal trends have also been identified for illnesses attributed to Campylobacter and Salmonella which have been shown to peak during summer months in temperate countries around the world [Reference Semenza11, Reference Kovats13].
Indirectly, climate can influence transmission of foodborne illness by altering food consumption behaviours, susceptibility of livestock to pathogens and transmission from vectors due to range expansion, increased activity and reproduction rates [14]. Livestock stressed by temperature may be more susceptible to colonisation by enteric pathogens such as E. coli or Salmonella, or more likely to shed greater amounts of these bacteria [Reference Keen15, Reference Pangloli16]. This can then lead to a greater risk of meat contamination from hygiene failures during processing [14]. Higher temperatures might also affect animal feeding strategies that can have a profound effect on the prevalence and shedding rate of pathogens infectious to humans by altering ecological conditions in the animal gut [Reference Jacob, Callaway and Nagaraja17]. At higher temperatures, cattle may graze outside more frequently; consumption of grass during grazing also contributes to pathogen survival and higher shedding rates [Reference Jacob, Callaway and Nagaraja17]. Direct or indirect effects of climate might also affect the super-shedding phenomenon (i.e. some cattle may harbour and shed bacteria at higher levels than others) [Reference Williams18], which strongly influences dissemination of E. coli O157 into the environment and ultimately to humans. Heat stress can alter the intestinal microbiota and has been associated with Salmonella in poultry [Reference Burkholder19] and antibiotic resistant E. coli in the faeces of swine [Reference Moro20]. The need to understand climatic drivers for current foodborne illness patterns is a key public health challenge [14]. Short-term weather variables (data collected over months or years) are considered in this paper as suitable indicators for long-term climate variables (data collected over decades) because they describe the same abiotic factors. To better understand the potential impact of climate change on enteric infections in Canada, we investigated the relationship between weather variables and sampling data of three different bacteria in Canada: Campylobacter, generic E. coli and Salmonella.
Methods
Monthly bacterial presence/absence data were acquired from the Canadian Integrated Program for Antimicrobial Resistance Surveillance (CIPARS). CIPARS provides a unified approach to monitor trends in antimicrobial resistance through sampling of animals and meats at farms, abattoirs and retail locations across Canada. For our analysis, the historical database of presence/absence of bacteria was used irrespective of antimicrobial resistance profiles (in other words, antimicrobial resistance was not considered in this study). The data consisted of beef, chicken and swine samples from farm, abattoir and retail settings (Table 1). Further details about the sampling process and program design can be found in Table 1 and the CIPARS annual report [21]. All available data from 2002 to 2012 were analysed to allow for sufficient sample size for analysis, particularly for datasets with low contamination prevalence.
Table 1. Sample counts tested for Campylobacter, generic E. coli and Salmonella in retail, abattoir and on-farm settings from 2002 through 2012

a Excluded from analysis due to low prevalence rate (<3%).
b Excluded from analysis due to sporadic nature of sampling (8 year period across multiple provinces).
c Excluded from further analysis due to high prevalence rate (>98%).
Data from all weather stations in Canada were downloaded from the Environment Canada website [22]. These data included average monthly temperature, maximum monthly temperature, precipitation and the station name and location coordinates for approximately 1700 weather stations across Canada. Stations for which data were available varied by month; data were available for an average of approximately 1400 stations each month (range 1300–1700). These data were placed into a geographical information system (GIS), ESRI ArcGIS 9.3 and plotted using the provided coordinates for each station, with the observed values for each month relationally joined using the station identification field. Data were then interpolated using an inverse distance weighting in ArcGIS using the Spatial Analyst function. This function transformed the point data into a continuous raster surface that used the eight nearest stations to interpolate values for the surface [Reference Daly23]. The transformation of point data to raster data is illustrated in Figure 1. This process was conducted for a 10 year period for each month and variable, for a total 360 surfaces.
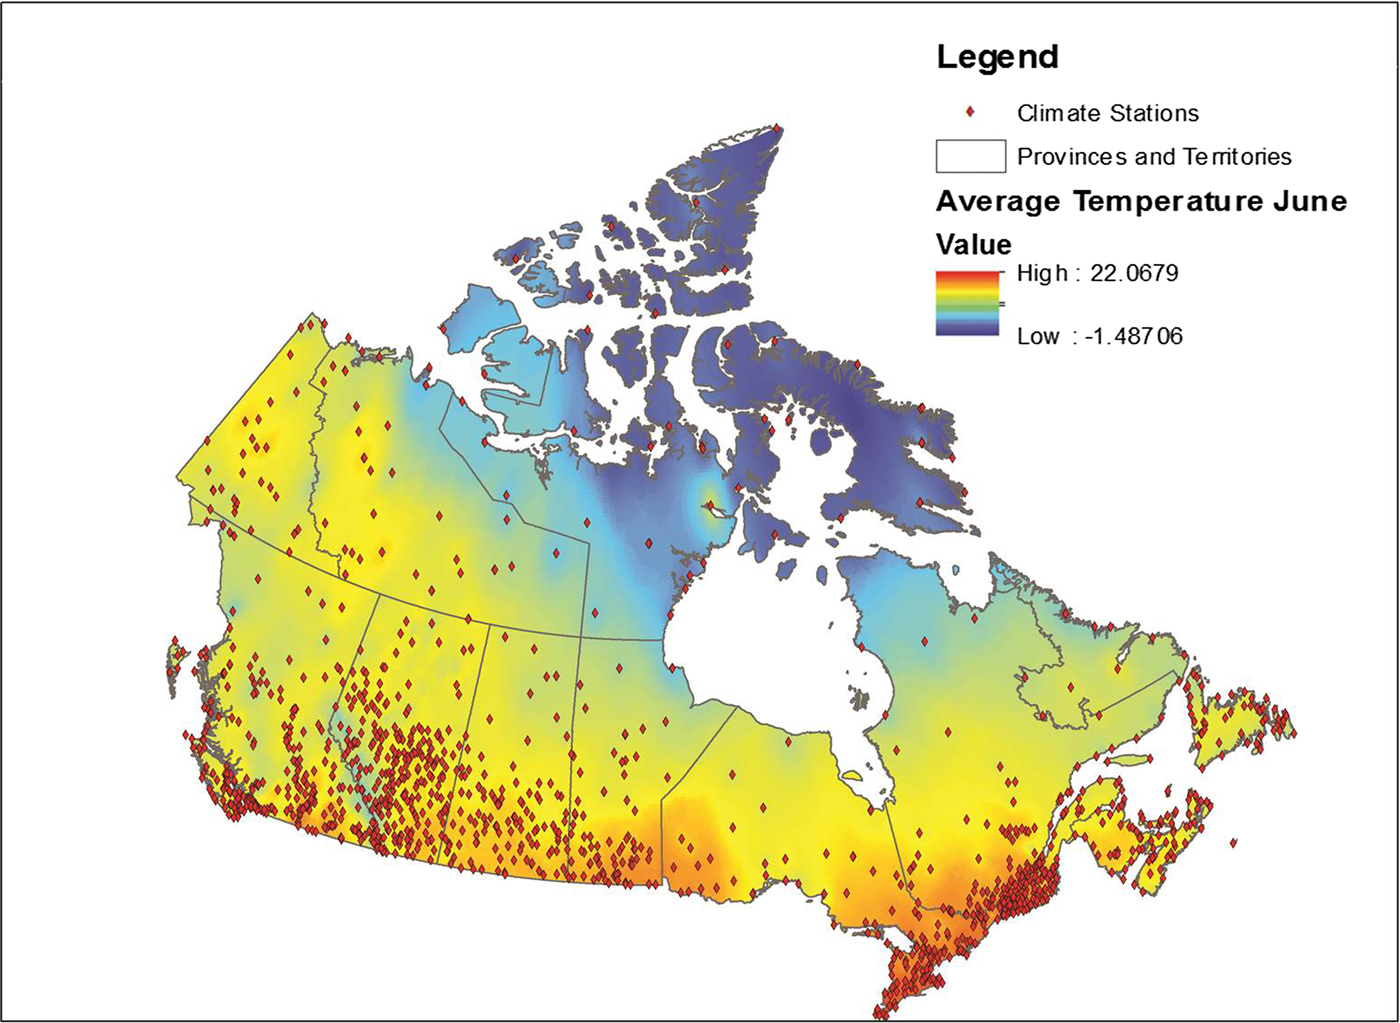
Fig. 1. Point weather station data conversion to a raster surface.
Since CIPARS data were aggregated at the provincial level and climate varies substantially within Canadian provinces, weather data were analysed only for areas where livestock operations are located in each province. Some provinces were excluded from the analysis altogether due to very low and highly dispersed livestock production. Otherwise, this would have resulted in a wide range of climate regions to consider and contribute significant uncertainty to the model with little benefit to the overall analysis due to the relatively low contribution of these provinces to the livestock production. The delineation of livestock operation areas was determined using the Census of Agriculture data at the Census Consolidated Subdivision level [24]. Separate boundaries were created in ArcGIS for chickens, beef cows and swine, and weather data were extracted for those areas using the summarise zone feature in ArcGIS. Table 2 describes the total area of each livestock zone by province, visualised in Figure 2. This effectively removed weather data from the analysis associated with areas with no livestock production in Canada. The weather and pathogen data were then combined in a single dataset. This approach reduced the variability of weather data but still provided coverage of 95.6%, 94.5% and 97.4% of cattle, chicken and swine production in Canada (calculated as the total number of livestock in the climate zones considered divided by the total number of livestock across all provinces included in the analysis).
Table 2. Area (km2) of livestock zones considered in the weather analysis as compared to total provincial area

Only provinces which were included in the analysis (see text) are shown.
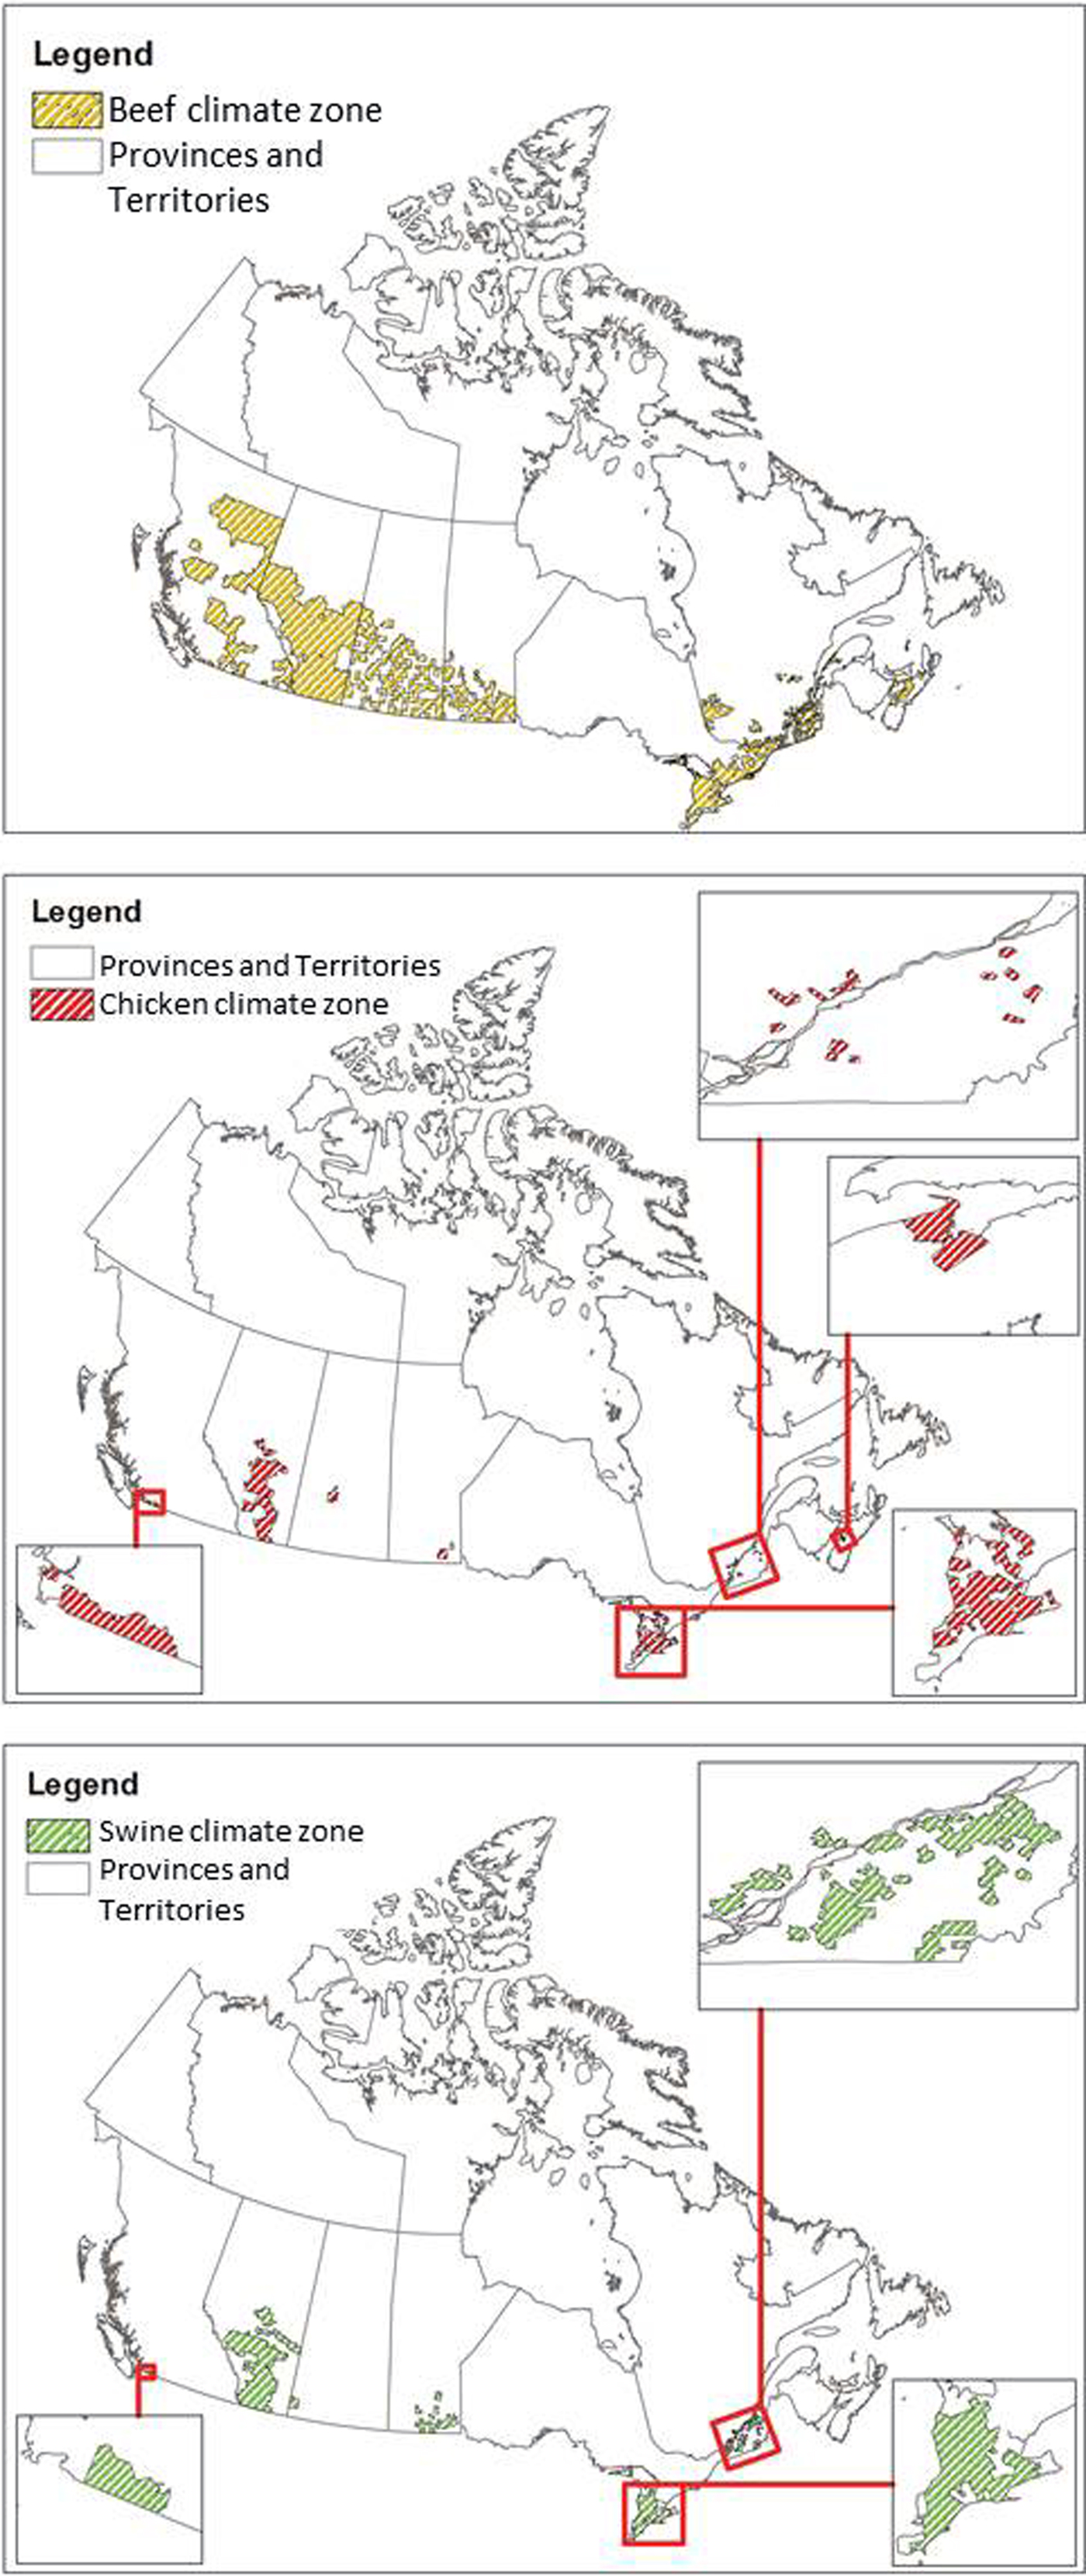
Fig. 2. Agricultural zones considered for the weather data analysis per livestock type.
Regression analyses using SAS V9.2 were performed to investigate relationships between bacteria prevalence and weather variables. Over the study period, CIPARS tested for Campylobacter, generic E. coli and Salmonella, but not all samples were tested for all pathogens and testing varied by location along the agri-food chain and by year. Prior to running any analyses, CIPARS data were assessed for suitability. Several categories of CIPARS data (9 out of 20) were eliminated as candidates for analysis (Table 1). Generic E. coli, for example, were eliminated from all abattoir analyses due to the fact that nearly all samples were positive. This makes the identification of influential weather variables impossible. In some other cases, insufficient test results were available due to limited sample size or low recovery rates, resulting in too few positive results for which to make statistical associations with weather variables. Even fewer categories were included in the Ontario analysis due to more limited data.
Year and province were forced into all regression models as fixed effects to control for overall yearly and provincial effects. Weather variables included the following: average monthly temperature, monthly temperature variation from the 10 year average, average maximum temperature, total monthly precipitation and monthly precipitation variation from the 10 year average. Two separate analyses were conducted: (1) overall estimates of the impact of weather variables on bacteria prevalence were produced by grouping all data on a particular variable and bacteria/commodity/agri-food chain location and (2) a seasonal analysis was conducted to explore the impact of month on the prevalence of bacteria. Weather variables were selected using both backwards and stepwise variable selection approaches. Among weather variables, only those significant at the 5% level were retained in the final model. To explore provincial variation, a separate sub-group analysis involving Ontario chicken data only was conducted.
Results
The significant findings from the model are shown in Table 3 for national level results. All of the significant variables associated with Campylobacter were related to temperature. Increased average temperatures increased odds of retail contamination with Campylobacter for both chicken and swine commodities; an average temperature increase of 9 °C for chicken and 10 °C for swine was associated with 10% higher odds of a positive Campylobacter sample. In abattoir settings, increases in the average maximum monthly temperatures of 3.6 °C and 3.5 °C were related to a 10% increase in odds of a positive Campylobacter sample for chicken and swine, respectively. There was also a negative association between Campylobacter prevalence in abattoir settings and variation from the 10 year average temperature for that month.
Table 3. Statistical model coefficients for the relationship between weather variables and prevalence of bacteria along the agri-food chain in Canada from 2002 through 2012

NS, No significant relationship at significance level of 5%.
Coefficients are shown, followed by the required absolute change in the weather variable in parentheses required to increase (if positive coefficient) or decrease (if negative coefficient) odds of a positive sample by 10% (keeping all other factors constant). Only categories with sufficient data for analysis are shown (see text).
a Increase in C temperature required to increase (if + coefficient) or decrease (if − coefficient) odds of a positive sample by 10% (keeping all other factors constant).
b Increase in mm of precipitation required to increase (if + coefficient) or decrease (if − coefficient) odds of a positive sample by 10% (keeping all other factors constant).
The prevalence of Salmonella was associated with precipitation and average maximum temperature in poultry products collected from the abattoir and maximum temperature and variable precipitation from on-farm swine samples in Canada. An increase of 23 and 40 mm above average precipitation during a 1 month period corresponded with a 10% increase in the odds of Salmonella in farm swine and abattoir swine samples, respectively. There was also a positive relationship between Salmonella prevalence in chicken sampled at the abattoir and total monthly precipitation, with an increase of 55 mm of the latter required to increase odds of Salmonella detection by 10%. A change in maximum temperature of 11 °C was required to result in a 10% increase in odds of Salmonella in chicken.
In retail settings, the odds of generic E. coli detection in Canada increased by 10% with an increase of 31 mm total precipitation for beef and a 6 °C increase in average temperature or 3.7 °C increase in monthly temperature variation for swine.
Table 4 provides the results for a sub-group analysis of Ontario chicken. The analysis of Campylobacter in Ontario chicken revealed similar directional relationships to those observed at the national level; however, an increase in average monthly temperature of only 2.4 °C or 1.8 °C was required to produce the same 10% increase in the odds of a positive Campylobacter sample at the abattoir and retail stages, respectively. Increases in the variation from the 10 year average temperature and the average maximum temperature decreased the odds of Campylobacter detection at the abattoir and retail in Ontario, respectively.
Table 4. Statistical model coefficients for the relationship between weather variables and prevalence of bacteria in chicken along the agri-food chain in Ontario from 2002 through 2012

NS, No significant relationship at significance level of 5%
Coefficients are shown, followed by the required absolute change in the weather variable in parentheses required to increase (if positive coefficient) or decrease (if negative coefficient) odds of a positive sample by 10% (keeping all other factors constant). Only categories with sufficient data for analysis are shown (see text).
a Increase in C temperature required to increase (if + coefficient) or decrease (if − coefficient) odds of a positive sample by 10% (keeping all other factors constant)
b Increase in mm of precipitation required to increase (if + coefficient) or decrease (if − coefficient) odds of a positive sample by 10% (keeping all other factors constant)
In Ontario, the odds of Salmonella detection in retail samples decreased by 10% as precipitation increased by 6 mm (Table 4), which is the opposite relationship observed in the national-level analysis. Salmonella prevalence in chickens at the abattoir and pigs on farm was also negatively related to average maximum temperature. The change in maximum temperature to result in a 10% increase in odds of Salmonella in chicken (11 °C) in Ontario was identical to that observed at the national scale.
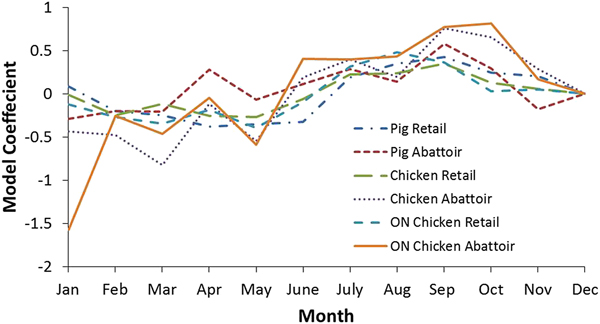
Additional analyses were conducted to examine the seasonality of pathogen prevalence for the national and Ontario chicken subgroup datasets (Tables 5 and 6, respectively). Coefficients indicate a positive or negative association between month and outcome variable, with greater absolute values indicating the proportion of the variance in the prevalence that is predictable from the month. The effect of month on bacteria prevalence was statistically significant in all cases (P ⩽ 0.05), except for Salmonella at retail. The strongest seasonal relationship between the pathogens investigated and climate was observed for Campylobacter. This finding was observed among chicken and swine samples from retail and abattoir settings both nationally and provincially. Figure 3 shows the coefficients for all the Campylobacter variables in chicken and swine by month and illustrates this seasonal trend, with negative coefficients generally observed in the winter months and positive coefficients from spring through the fall, indicating a greater prevalence in the latter compared to the reference month of December. There was a strong positive association between temperature and the odds of positive Campylobacter samples in chicken and swine in abattoir and retail environments, which has also been identified in other countries [Reference Nylen25]. To demonstrate, results for Ontario were transformed to odds ratios and plotted with average temperatures in Figure 4. The odds of detecting Campylobacter in chicken at the abattoir and retail environments were greater from June through November when compared to the baseline month of December. This corresponds approximately to the period of peak average air temperatures and an approximate 2–3 month period afterwards. No clear seasonal patterns emerged for Salmonella or generic E. coli.
Table 5. Statistical model coefficients by month for the relationship between weather variables and prevalence of bacteria along the agri-food chain in Canada from 2002 through 2012

NS, No significant relationship at significance level of 5%.
Coefficients indicate a positive or negative associated between month and outcome variable.
a December was selected as the baseline month to which all other months were compared.
Table 6. Statistical model coefficients by month for the relationship between weather variables and prevalence of bacteria in Ontario chicken from 2002 through 2012

NS, No significant relationship at significance level of 5%.
Coefficients indicate a positive or negative associated between month and outcome variable.
a December was selected as the baseline month to which all other months were compared.
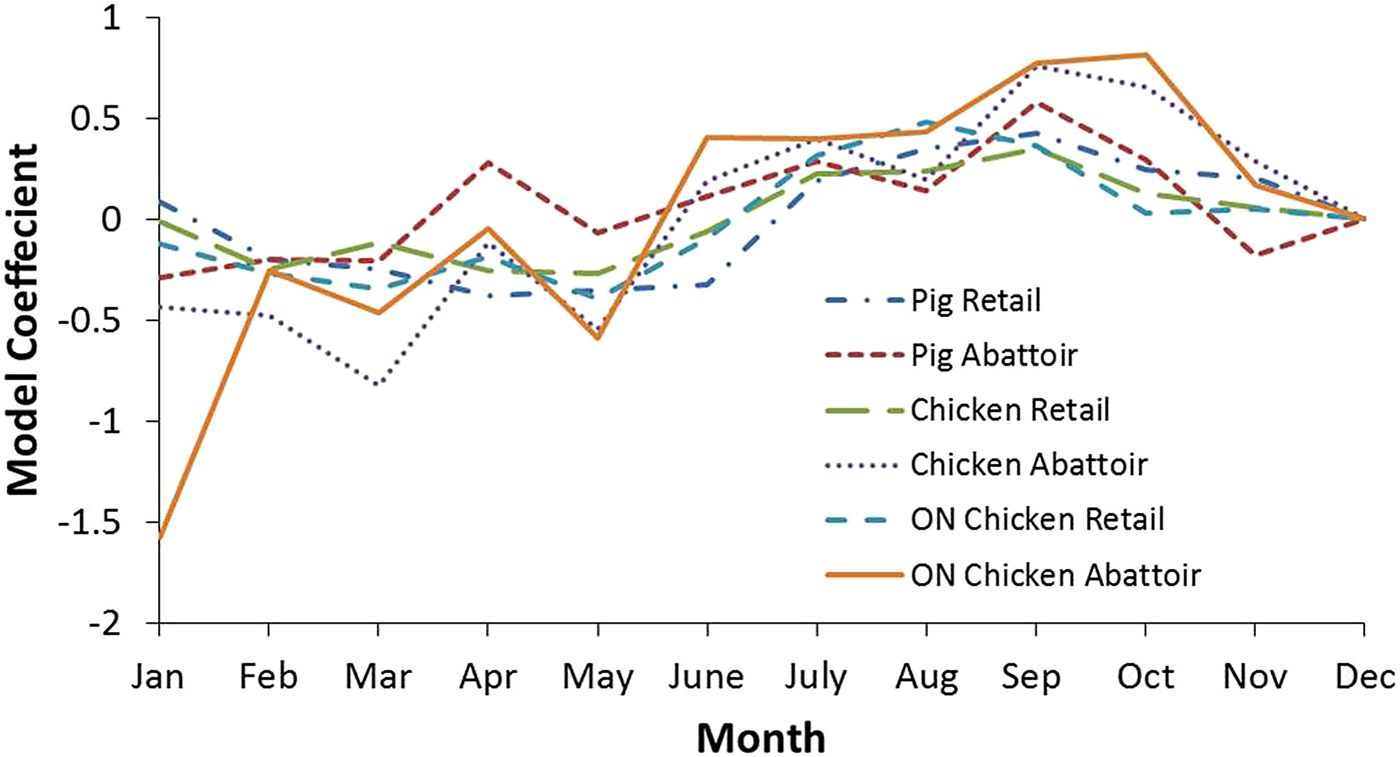
Fig. 3. Model coefficients for Campylobacter by month for select analyses. December was selected as the baseline month to which other months were compared.

Fig. 4. Odds ratios for Campylobacter occurrence in chicken at abattoir and retail by month in Ontario. Average temperatures in production areas are shown for comparison. December was selected as the baseline month to which all other months were compared.
Discussion
This study was designed to use large-scale national data to examine the relationship between weather and contamination of meat products with Campylobacter, generic E. coli and Salmonella. No single weather variable was associated with the prevalence of all bacteria across all meat products; relationships between variables and prevalence were dependent on the bacteria, location along the agri-food chain and meat product. Efforts were taken to restrict the variability of weather data for each province to only the locations where beef, chicken and swine were produced in each province. However, the use of the Census of Agriculture data reduced the area in which weather was considered with varying degrees of success. Beef production was distributed throughout much larger areas of Canada than the other livestock species (Table 2 and Fig. 2) and therefore associated with the largest variability among weather data. In Alberta, the distribution of livestock was more widespread than in other provinces, which reduced the precision of weather data. For this study, we performed a single subgroup analysis for Campylobacter and Salmonella in Ontario chicken to demonstrate how relationships change when analysing on a provincial vs. national scale, and it is expected that results would differ interprovincially as well, based on differences in animal production/processing, climate/weather and data quality.
There were some apparent differences when examining Ontario vs. national data. These differences were primarily related to the precision of relationships where provincial level data can be related to smaller weather increments. If we observed only the direct effects of temperature or precipitation on bacterial contamination, we would expect to identify consistent associations at various scales and locations. Since there was variability in the findings at the national and Ontario level and among location types (farm, abattoir, retail), we can infer that indirect effects of weather on bacteria contamination were apparent in this dataset and that other factors aside from climate impact prevalence of bacteria inter-provincially.
The mechanisms underlying the seasonality in foodborne disease are not fully understood, but they are likely a complex interplay of different factors. These include pathogen prevalence in the animal reservoir, pathogen environmental survival patterns and human behaviour and consumption patterns [Reference Ravel26]. Much of the previous evidence of the seasonality of foodborne pathogens comes from studies which used cases of human illness as the primary outcome of interest [Reference Fleury7, Reference Ravel26]. Since the outcome variable for this research was contamination along the agri-food chain instead of human cases of foodborne illness, an explanation of the relationship excludes many of the seasonal human behaviour and consumption patterns associated with foodborne illness, such as attending a barbeque or picnic and camping [14]. Since no seasonal patterns were evident in the case of Salmonella and generic E. coli, this suggests the relative importance of human behaviour and consumption patterns in their apparent seasonality of human cases. A study of one Canadian community came to a similar conclusion and the researchers suggested that contamination of retail chicken may not be driving the seasonality of salmonellosis in Canada [Reference Ravel26].
We found that odds of contamination of chicken or swine with Salmonella in Canada were correlated with either precipitation or variability in precipitation, respectively. The absolute increase in these weather variables required for a 10% increase in odds were relatively high, suggesting that although significant, Salmonella prevalence is not sensitive to small changes to precipitation metrics. International studies have indicated that rainfall has a minor impact on the incidence of salmonellosis [Reference Aik27] and can even be inversely related to cases [Reference Zhang, Bi and Hiller28].
Seasonality appears to play a significant role in Campylobacter contamination and there is a statistical association with temperature at a range of scales amongst settings and commodities. This phenomenon makes Campylobacter the most likely foodborne zoonotic enteric pathogen studied whose occurrence in meat products is affected by air temperature changes in Canada. The odds of detecting Campylobacter in Ontario chicken, for example, are greater from June through November and July through November in the abattoir and retail environments, respectively (Fig. 4). This suggests a lag of approximately 1 month between abattoir and retail contamination in the summer. However, this pattern is not reproduced throughout the remainder of the year – abattoir contamination remained elevated in the fall whereas retail contamination decreased. This phenomenon warrants further investigation through targeted sampling.
Further research into clarifying the routes of Campylobacter movement pathways in the natural environment would be of great benefit to understanding the relationship between climate/weather and Campylobacter. The bacteria replicate primarily within the intestinal tract of warm-blooded animals [Reference Newell2]. Therefore, it is the post-excretion period that defines the ecology of campylobacteriosis [Reference Skelly and Weinstein29]. Environmental contamination occurs primarily through feces dispersal, including by animals slaughtered at food processing, whereby the carcass can be contaminated [Reference Skelly and Weinstein29]. Laboratory studies have characterised the survival of Campylobacter in swine manure and found a decline in the viable cells observed at higher temperatures (15, 22, 42 and 52 °C) compared to milder temperatures (4 °C) [Reference Bui30]. The seasonal nature of Campylobacter could be driven by some external and localised phenomena such as vectors (e.g. flies, rodents, wildlife, humans) [Reference Agunos31]. Several studies have placed screened barriers on chicken houses and observed significant reductions in the prevalence of Campylobacter compared with control chicken houses [Reference Hald, Sommer and Skovgård32, Reference Bahrndorff33]. The seasonality of flies in Canada would certainly be affected by climate change leading to increased transmission due to a longer warm season, as their lifecycles are strongly regulated by temperature.
Strategic and effective food safety management requires understanding microbiological hazards and how their presence in foods can be prevented or maintained within tolerable levels when subjected to changing external factors such as climate [Reference Tirado34]. Understanding pathogen-specific seasonal patterns is important for improving existing disease surveillance methods, generating appropriate prevention strategies, developing valid prediction models and enhancing cross-border cooperation [Reference Ravel26]. Generally, the increases in temperature variables required to increase the odds of contamination fall within the range of projected climate change in some regions of Canada over the 21st century using medium-high future emission scenarios (and even low-emission scenarios for Ontario) [Reference Warren and Lemmen35]. The statistical associations between weather and foodborne bacteria, as well as variations in seasonal patterns, provide some insight into the complex and nonlinear nature of interactions between environmental, pathogen and host-specific factors and transmission opportunities.
Author ORCIDs
B. A. Smith, 0000-0003-0956-7743
Acknowledgement
This study was funded by the Public Health Agency of Canada under the Adaptation to Climate Change Program.
Conflict of interest
None.


 Open access