


Introduction
Introduced into the Americas by the slave trade [Reference Bryan, Moss and Kahn1], yellow fever (YF), a highly lethal but vaccine-preventable haemorrhagic fever, afflicted the Americas for three centuries. In its urban cycle, YF is transmitted by Aedes aegypti, a short-winged household mosquito that breeds in clean water collections [Reference Strode2]. The sylvatic cycle is kept by non-human primate reservoirs and is transmitted by two forest-living mosquitoes of the genus Haemaghogus and Sabethes [Reference Gubler3].
The last documented urban YF epidemic in the Americas occurred in 1928 in Rio de Janeiro, Brazil [Reference Bryant, Holmes and Barrett4]. In the period between 1948 and 1954, the Brazilian National Service of Yellow Fever (SNFA) used the then-new insecticide DDT in large areas of regions [Reference Dick, Martín, Montoya, del Diego, Zambrano and Dayan5]. As a result, in March 1955 the last focus of Ae. aegypti was detected and eliminated from the state of Bahia in North-Eastern Brazil [Reference Magalhães6]. Over the next three decades, the mosquito was considered eradicated from Brazil.
In the 1980s, Ae. aegypti returned to the urban centres of South America [Reference Gardner and Ryman7]. Although no new urban cycle of YF occurred in South-America since the end of the Aedes eradication program, the high number of non-vaccinated individuals that visit jungle areas, where the sylvatic cycle of YF already exists, and return to Aedes-infested urban areas, poses a threat of a resurgence of the urban cycle of YF. In recent years, an increasing number of human YF cases has been reported in many Brazilian cities where forest remains with non-human primate reservoirs and the presence of the sylvatic mosquitoes are in close contact with human settlements [Reference Massad, Coutinho, Burattini and Lopez8].
In 2016, a YF outbreak characterised as a sylvan or jungle epizootic [9], occurred in Minas Gerais, Brazil. By mid-April 2017, there were 2422 cases of YF reported, including 326 deaths. The case fatality rate was 34%. After this outbreak, there was an important reduction in notified cases incidence in epizootic regions [10]. Until the middle of February, 2018, the State of São Paulo reported 202 cases of YF with 79 deaths. None of those recent cases reported in Brazil was attributed to the Ae. aegypti mosquito, the species which was responsible for all urban outbreaks in the first half of the last century. Urban YF transmission, however, still occurs continuously in Africa, as demonstrated by the outbreaks in Angola in 2016 [11] and in Ivory Coast in 2017 [12]. Moreover, in October 2017, the majority of the larger parks in the city of São Paulo was closed to visitation due to the death of Allouatta monkeys infected with YF (see http://www1.folha.uol.com.br/cotidiano/2017/10/1928920-macaco-e-achado-morto-com-febre-amarela-e-horto-florestal-e-fechado.shtml).
Recently, Aedes mosquitoes spread throughout the whole American continent (more than 50% of the USA states are endemic for both Ae. aegypti and Aedes albopictus [13]) which are present in increasing numbers in virtually all cities of tropical America [Reference Amaku, Coutinho and Massad14], in particular in urban centres of the Brazilian coast [Reference Massad, Coutinho and Wilder-Smith15]. The yearly increase in the number of dengue cases and more recently of chikungunya and zika virus demonstrates the high density of Aedes mosquitoes in urban centres of Brazilian coastal regions. These latter urban centres are not included in areas where YF vaccination is recommended. Considering that these areas comprise about 60% of the entire Brazilian population the risk of urban YF resurgence is imminent [Reference Massad, Coutinho, Burattini and Lopez8]. The recent invasion of zika virus in the North American continent demonstrate the presence of Aedes mosquitoes and hence the risk of urban YF resurgence in North American cities as well [Reference Gardner and Ryman16].
Since Aedes mosquitoes are competent to transmit the YF virus [Reference Couto-Lima, Madec, Bersot, Campos, Motta, Santos, Vazeille, Vasconcelos, Lourenço-de-Oliveira and Failloux17], it is worthwhile to try to estimate the probability of at least one YF case resulting from the arrival of one infected traveller to an Aedes-infested area. In addition, it is possible to estimate the expected number of YF cases and deaths after 1 year of its introduction.
In a recent paper, Couto-Lima et al., [Reference Couto-Lima, Madec, Bersot, Campos, Motta, Santos, Vazeille, Vasconcelos, Lourenço-de-Oliveira and Failloux17] demonstrated that the anthropophilic mosquitoes Ae. aegypti and Ae. Albopictus, as well as the YFV-enzootic mosquitoes Haemagogus leucocelaenus and Sabethes albiprivus from the YFV-free region of the Atlantic coast, were highly susceptible to American and African YFV strains. In that paper, the authors demonstrated that the vectorial competence to transmit YFV of urban Aedes mosquitoes is very similar their vector competence to transmit dengue, and this justifies using well-known transmission parameters for dengue as a first approximation to the same parameters for YFV transmission. Of course, the errors of such approximation must be estimated and this is one of the purposes of this paper.
Recently Massad et al. [Reference Massad, Amaku, Coutinho, Struchiner, Lopez, Wilder-Smith and Burattini18] proposed a method to estimate the size of the population of Aedes mosquitoes using dengue incidence data. In that paper, the authors estimated the number of infected, latent and susceptible mosquitoes and used the total number of mosquitoes to roughly estimate the expected number YF cases resulting from the arrival of one infected traveller. Here we extend this analysis by including the estimation of the probability of at least one YF case resulting from the arrival of one infected traveller to an Aedes-infested area for several values of vectorial competence of urban Aedes mosquitoes.
The objective of this study is, therefore, to estimate the risk of urban YF resurgence in Aedes-infested cities.
This paper is organised as follows. After this introduction, we describe the method proposed in [Reference Massad, Amaku, Coutinho, Struchiner, Lopez, Wilder-Smith and Burattini18] to estimate the number of Aedes mosquitoes from dengue incidence data. This is done step-by-step to allow the reproducibility of our results by other authors. The next section shows an illustration of the method for the case of the city of Rio de Janeiro with dengue incidence data from 2012, one of the worst years in the dengue history of that city. In this section, we also comment on the limitations of the method and estimate the errors associated with the calculated outcomes. In the final section, we present the conclusion of this work.
Methods
The method used to estimate the risk of urban YF resurgence in Aedes-infested cities consists in estimating the number of Aedes mosquitoes that explains a given dengue outbreak. Based on the above estimates we calculated the probability of at least one autochthonous urban YF case per unit area acquired as a result of importation by a traveller arriving from a YF endemic or epidemic sylvatic region in his/hers infectiousness period (first generation). Finally, we estimated the expected number of autochthonous infections per unit area produced by that infected traveller (index case) per unit area.
We begin by fitting a continuous function, denoted IncidenceDENV(t), to the number of reported dengue cases multiplied by 4, that is, by taking into account the 4:1 asymptomatic-to-symptomatic ratio [Reference Ximenes, Amaku, Lopez, Coutinho, Burattini, Greenhalgh, Wilder-Smith, Struchiner and Massad19]. The dengue incidence data (from [20]), shown in Table 1, were fitted to the chosen function:
 $${\rm Incidenc}{\rm e}_{{\rm DENV}}{\rm (}t) = c_1\exp \left[ { - \displaystyle{{{\left( {t - c_2} \right)}^2} \over {c_3}}} \right] + c_4$$
representing the time-dependent dengue infection incidence. In Equation (1) c 1 is a scale parameter that determines the maximum incidence, c 2 is the time at which the maximum incidence is reached, c 3 represents the width of the time-dependent incidence function and c 4 is just another scaling parameters. Equation (1) is intended to reproduce a ‘Gaussian’ curve and so c 1 and c 4 are just scale parameters but c 2 represents the ‘mean’ (and mode or maximum) time and c 3 represents the ‘variance’ of the time distribution of cases. All parameters c i, i = 1, …, 4 were fitted to model (1) by the Bootstrap method [Reference Chernick21] the results of which are shown in Table 2.
Table 1. Number of dengue infection in Rio de Janeiro, 2011–2012
a Number of reported cases multiplied by 4 to take account of asymptomatic cases.
Table 2. Parameters’ values (mean, lower bound and upper bound) fitted to Equation (1) by the Bootstrap technique

Figure 1 illustrates the case of the 2011–2012, the years with the outbreak with the highest incidence of dengue in the history of Rio de Janeiro, Brazil.
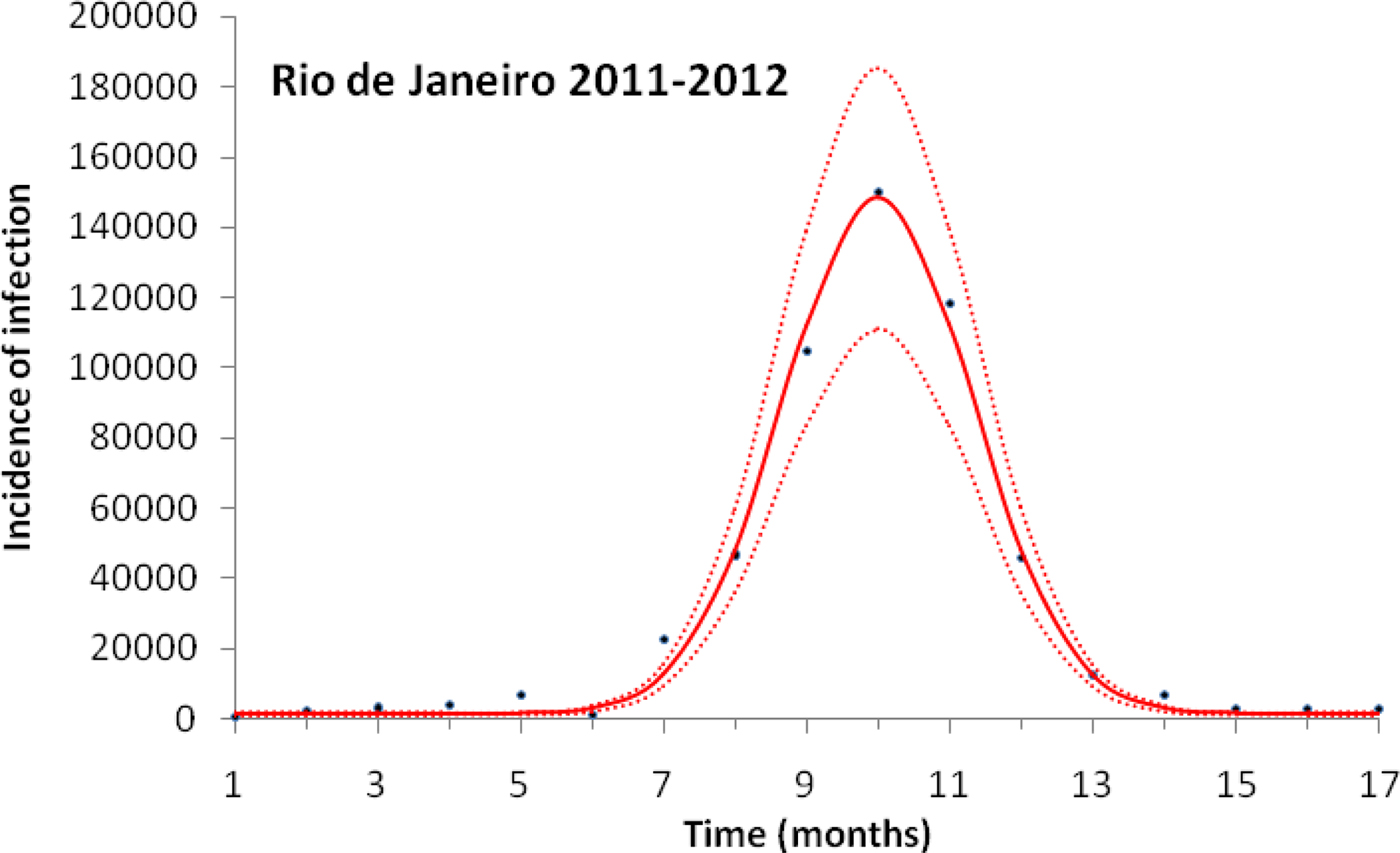
Fig. 1. Fitting a function (Eqn. (1)) to dengue incidence of infections between October 2011 and December 2012 in Rio de Janeiro. Dots represent the notified data multiplied by 4, continuous line the mean fitted incidence and dotted lines de 95% CI.
Dengue incidence is defined as the product of the force of infection, λ(t), times the number of susceptible individuals, S H(t). The force of infection is defined as λ(t) = ((abI M(t))/(N H(t))), where N H(t) denotes the total human population, a is the mosquitoes biting rate, b is the fraction of those bites produced by the infectious mosquitoes I M(t) that are infective to susceptible humans S H(t). All the parameters used in these calculations are shown in Table 3.
Table 3. Model parameters, biological meaning, values and sources
The mean, variance and 95% CI were obtained with 104 Monte Carlo simulations. The dimension of rates is months−1.
a These rates for YF varied along the simulations.
From the fitted incidence, IncidenceDENV(t) we calculate the number of infective mosquitoes  $I_{\rm M}(t) = \displaystyle{{{\rm Incidenc}{\rm e}_{{\rm DENV}}(t)N_{\rm H}(t)} \over {abS_{\rm H}(t)}}$, where S H(t) can be estimated by the previous history of dengue outbreaks [Reference Ximenes, Amaku, Lopez, Coutinho, Burattini, Greenhalgh, Wilder-Smith, Struchiner and Massad19]. From the number of infectious mosquitoes, we calculated the number of latent mosquitoes, L M(t), given by
 $$L_{\rm M}(t) = \displaystyle{1 \over {\gamma _{\rm M}}}\left[ {\displaystyle{d \over {dt}}I_{\rm M}(t) + \mu _{\rm M}I_{\rm M}(t)} \right],$$
where (1/γ M) is the average duration of the extrinsic incubation period and μ M is the natural mortality rate of mosquitoes. The number of susceptible mosquitoes is given by
 $$S_{\rm M}(t) = \displaystyle{{N_{\rm H}} \over {acI_{\rm H}(t)}}\left[ {\displaystyle{d \over {dt}}L_{\rm M}(t) + (\mu _{\rm M} + \gamma _{\rm M})L_{\rm M}(t)} \right],$$
where c is the fraction of the mosquitoes that bite infective humans and acquire the infection, and I H(t) is the number of humans infected with dengue. The estimated total number of mosquitoes is N M(t) = S M(t) + L M(t) + I M(t). We are going to need the derivatives of these functions:
 $$\displaystyle{{dN_{\rm M}(t)} \over {dt}} = \displaystyle{{dS_{\rm M}(t)} \over {dt}} + \displaystyle{{dL_{\rm M}(t)} \over {dt}} + \displaystyle{{dI_{\rm M}(t)} \over {dt}}.$$
For details of the above calculations, see [Reference Massad, Amaku, Coutinho, Struchiner, Lopez, Wilder-Smith and Burattini18].
For the calculation of the probability that one infected travellers produces at least one autochthonous YF case and the total number of Y cases and deaths 1 year after the introduction of the infection we used a variant of the classical Ross–Macdonald model, described in details in [Reference Coutinho, Burattini, Lopez and Massad22, Reference Amaku, Azevedo, Burattini, Coelho, Coutinho, Greenhalgh, Lopez, Motitsuki, Wilder-Smith and Massad23].
The populations involved in the transmission are human hosts and mosquitoes. Therefore, the population densities per unit area are divided into the following compartments: susceptible humans denoted S H; infected humans, I H; recovered (and immune) humans, R H; total humans, N H; susceptible mosquitoes, S M; infected and latent mosquitoes, L M; infected and infectious mosquitoes, I M. The parameters appearing in the model are defined in Table 3.
The model is defined by the following equations:
 $$\eqalign{& \displaystyle{{dS_{{\rm H} - {\rm YF}}} \over {dt}} = - ab_{{\rm YF}}I_{{\rm M} - {\rm YF}}\displaystyle{{S_{{\rm H} - {\rm YF}}} \over {N_{\rm H}}} + \mu _{\rm H}(N_{\rm H} - S_{{\rm H} - {\rm YF}}) + \alpha _{{\rm YH}}I_{{\rm H} - {\rm YF}}, \cr & \displaystyle{{dI_{{\rm H} - {\rm YF}}} \over {dt}} = ab_{{\rm YF}}I_{{\rm M} - {\rm YF}}\displaystyle{{S_{{\rm H} - {\rm YF}}} \over {N_{\rm H}}} - \left( {\mu _{\rm H} + \gamma _{{\rm H} - {\rm YF}} + \alpha _{{\rm YH}}} \right)I_{{\rm H} - {\rm YF}}, \cr & \displaystyle{{dR_{{\rm H} - {\rm YF}}} \over {dt}} = \gamma _{{\rm H} - {\rm YF}}I_{{\rm H} - {\rm YF}} - \mu _{\rm H}R_{{\rm H} - {\rm YF}}, \cr & \displaystyle{{dS_{{\rm M} - {\rm YF}}} \over {dt}} = - ac_{{\rm YF}}S_{{\rm M} - {\rm YF}}\displaystyle{{(I_{{\rm H} - {\rm YF}} + I_0(t))} \over {N_{\rm H}}} \cr & \qquad\qquad\,\, + \mu _{\rm M}(L_{{\rm M} - {\rm YF}} + I_{{\rm M} - {\rm YF}}) + \displaystyle{{dN_{\rm M}} \over {dt}}, \cr & \displaystyle{{dL_{{\rm M} - {\rm YF}}} \over {dt}} = ac_{{\rm YF}}S_{{\rm M} - {\rm YF}}\displaystyle{{(I_{{\rm H} - {\rm YF}} + I_0(t))} \over {N_{\rm H}}} \cr & \quad \quad \quad - \gamma _{{\rm M} - {\rm YF}}L_{{\rm M} - {\rm YF}} - \mu _{\rm M}L_{{\rm M} - {\rm YF}}, \cr & \displaystyle{{dI_{{\rm M} - {\rm YF}}} \over {dt}} = \gamma _{{\rm M} - {\rm YF}}L_{{\rm M} - {\rm YF}} - \mu _{\rm M}I_{{\rm M} - {\rm YF}}, \cr & \displaystyle{{dN_{\rm M}} \over {dt}} = {\rm as}\,{\rm in}\,{\rm equation,}\,{\rm (2)} \cr & N_{\rm H} = S_{{\rm H} - {\rm YF}} + I_{{\rm H} - {\rm YF}} + R_{{\rm H} - {\rm YF}}, \cr & N_{{\rm M} - {\rm YF}} = S_{{\rm M} - {\rm YF}} + L_{{\rm M} - {\rm YF}} + I_{{\rm M} - {\rm YF}}.} $$
Remark: Note that the expression for mosquitoes ((dN M)/(dt)) was estimated from dengue data (see [Reference Massad, Amaku, Coutinho, Struchiner, Lopez, Wilder-Smith and Burattini18] for details).
System (3) was solved assuming that one infected individual was introduced by unit area, I 0(t), (see [Reference Amaku, Azevedo, Burattini, Coelho, Coutinho, Greenhalgh, Lopez, Motitsuki, Wilder-Smith and Massad23]) at t = t 0 and remains infective for a period of (μ H + γ H−YF + α YH)−1 months, that is:
 $$I_0(t) = \exp \left[ { - \left( {\mu _{\rm H} + \gamma _{{\rm H} - {\rm YF}} + \alpha _{{\rm YH}}} \right)\,(t - t_0)} \right]\theta (t - t_0).$$
The total number of YF cases after one year of its introduction (Δ = 12 months), YF cases, is given by:
 $$YF_{{\rm cases}} = \int\limits_{t_0}^{t_0 + \Delta} {ab_{{\rm YF}}I_{{\rm M} - {\rm YF}}\displaystyle{{S_{{\rm H} - {\rm YF}}} \over {N_{\rm H}}}dt}. $$
The total number of YF deaths after one year of its introduction, YF deaths, (Δ = 12 months) is given by:
 $$YF_{{\rm deaths}} = \alpha _{{\rm YF}}\int\limits_{t_0}^{t_0 + \Delta} {ab_{{\rm YF}}I_{{\rm M} - {\rm YF}}\displaystyle{{S_{{\rm H} - {\rm YF}}} \over {N_{\rm H}}}dt}. $$
The risk of urban YF resurgence is defined as the probability of at least one autochthonous case per unit area produced by one single infected individual per unit area arrived at the area during his/her infectiousness period. For this, the fourth and fifth equations of system (3) take the form:
 $$\eqalign{& \displaystyle{{dS_{{\rm M} - {\rm YF}}} \over {dt}} = - ac_{{\rm YF}}S_{{\rm M} - {\rm YF}}\displaystyle{{(I_0(t))} \over {N_{\rm H}}} \cr & \qquad\qquad\,\, + \mu _{\rm M}(L_{{\rm M} - {\rm YF}} + I_{{\rm M} - {\rm YF}}) + \displaystyle{{dN_{\rm M}} \over {dt}}, \cr & \displaystyle{{dL_{{\rm M} - {\rm YF}}} \over {dt}} = ac_{{\rm YF}}S_{{\rm M} - {\rm YF}}\displaystyle{{(I_0(t))} \over {N_{\rm H}}} \cr & \qquad\qquad\,\, - \gamma _{{\rm M} - {\rm YF}}L_{{\rm M} - {\rm YF}} - \mu _{\rm M}L_{{\rm M} - {\rm YF}}.} $$
From system (3) with equations fourth and fifth replaced by Equation (7) we can calculate the force of infection λ YF (t)
This force of infection can now be used in a non-homogeneous simple birth process [Reference Bailey24] to calculate the required probabilities.
The probability generating a function of such process is given by
 $$P(x,t) = \left\{ {1 + \displaystyle{1 \over {\displaystyle{{e^{\rho (t)}} \over {x - 1}} - \int\limits_0^t {\lambda _{{\rm YF}}(\tau )e^{\rho (\tau )}d\tau}}}} \right\}^a,$$
where a = I 0(0),
 $$\lambda _{{\rm YF}}(t) = ab_{{\rm YF}}\displaystyle{{I_{{\rm M} - {\rm YF}}(t)} \over {N_{\rm H}}}$$
and
 $$\rho (t) = \int\limits_0^t { - \lambda _{YF}(\tau )\theta (\tau - t_0)d\tau}. $$
The quantity ρ(t) must be calculated numerically.
Expanding (8) in powers of x we find:
 $$\eqalign{p_n(t) =& \sum\limits_{\,j = 0}^{\min (n,a)} {\left( {\matrix{ a \cr j \cr}} \right)\left( {\matrix{ {a + n - j - 1} \cr {a - 1} \cr}} \right)} \alpha ^{a - j}\beta ^{n - j} \cr & (1 - \alpha - \beta )^j,}$$
 $$p_0(t) = \alpha ^a,$$
where $\alpha = 1 - \displaystyle{1 \over {e^{\rho (t)} + \int\limits_0^t {\lambda (\tau )\theta (\tau - t_0)e^{\rho (\tau )}d\tau}}} $$
and
 $$\beta = 1 - \displaystyle{{e^{\rho (t)}} \over {e^{\rho (t)} + \int\limits_0^t {\lambda (\tau )\theta (\tau - t_0)e^{\rho (\tau )}d\tau}}}. $$
The risk of urban YF resurgence was defined as the probability of one secondary case generated by a single infected traveller (a = I 0(0) = 1) along his/her infectiousness period. In terms of Equation (9a) it is the probability of a secondary infection, that is, p 2(t), or:
 $$\eqalign{ p_2(t) &= \sum\limits_{\,j = 0}^1 {\left( {\matrix{ a \cr j \cr}} \right)\left( {\matrix{ {a + n - j - 1} \cr {a - 1} \cr}} \right)} \alpha ^{a - j}\beta ^{n - j}(1 - \alpha - \beta )^j \cr & = \alpha \beta ^2 + \beta (1 - \alpha - \beta ).} $$
The total number of YF cases and deaths after one year and the probability of at least one autochthonous case produced by introducing in the area a density of infected individuals (equal to one) during his/her infectiousness period where calculated for various degrees of the Aedes vector competence. This parameter is defined as a factor less than one that represents both the probability of infection from vector to host and from host to vector, b and c, respectively, as in Table 3.
Results
Figure 1 illustrates the fitting procedure of dengue incidence with the case of the 2011–2012 Dengue Outbreak in Rio de Janeiro, Brazil. Figure 2 shows the calculation for the number of mosquitoes for the city of Rio de Janeiro in the same period.
Fig. 2. Estimation of the size of the Aedes mosquitoes’ population from dengue incidence between October 2011 and December 2012 in Rio de Janeiro. Continuous line the mean number of mosquitoes and dotted lines de 95% CI.
To test the method's accuracy for estimating the number of mosquitoes, we used the above equations to calculate the number of Aedes mosquitoes in the neighbourhood of Olaria in Rio de Janeiro. In the 2000 census, Olaria had an estimated population of 62 509 inhabitants in an area of around 4 km2. This neighbourhood was chosen because in 2008 Maciel-de-Freitas et al. [Reference Maciel-de-Freitas, Eiras and Lourenço-de-Oliveira25] estimated through the MosquiTrap and aspirator methods, the population size of Ae. aegypti. The two devices were used in the same area at the same time. In the assumed 0.8 km2 area covering the average flight range of Aedes mosquitoes, the authors collected 3505 and 4828 female mosquitoes in the MosquiTrap and aspirator, respectively, totalising 8333 female mosquitoes (note that it is assumed that the two capturing techniques are equally efficient so each technique capture about half the total number of mosquitoes in the area). Using the data from dengue in the same period, we estimated a total Aedes population in each of the five areas of 0.8 km2 of Olaria in a period of 2 weeks as 8145 ± 284 female mosquitoes, which is a good approximation to the empirical data.
To calculate the expected number of YF cases generated by one infected traveller after 1 year, we used the Ross–Macdonald model. We introduced a term in the susceptible mosquitoes’ equations of the Ross–Macdonald model, so that we reproduce the number of mosquitoes calculated before. The new equation reads
 $$\displaystyle{{dS_{\rm M}} \over {dt}} = - acS_{\rm M}\displaystyle{{I_{\rm H}} \over {N_{\rm H}}} + \mu _{\rm M}(L_{\rm M} + I_{\rm M}) + \displaystyle{{dN_{\rm M}} \over {dt}}, $$
where the new term ((dN M)/(dt)) is the sum of the derivatives of the equations for the susceptible, latent and infectious mosquitoes described above. The YF-specific parameters used were the terms related to vector-competence, c and b, the extrinsic incubation period, 1/γ M, the duration of viraemia 1/γ H, and the disease-induced mortality rate α H of infected humans. Using the Ross–Macdonald model for the areas in which the number of mosquitoes can be calculated from dengue data allows the estimation of the expected number of new cases produced by infective travellers arriving at different moments.
As an example of the above procedures, we estimated the expected number of autochthonous cases and deaths generated by introducing a density of infective individuals over the whole city arriving at different times of the year, t = t 0, in Rio de Janeiro. Figure 3 shows that the maximum number of autochthonous cases is reached when the imported infection arrives at around 5.6 months, with the number of YF virus infections peaking between 169 and 282 and deaths peaking between 55 and 92.
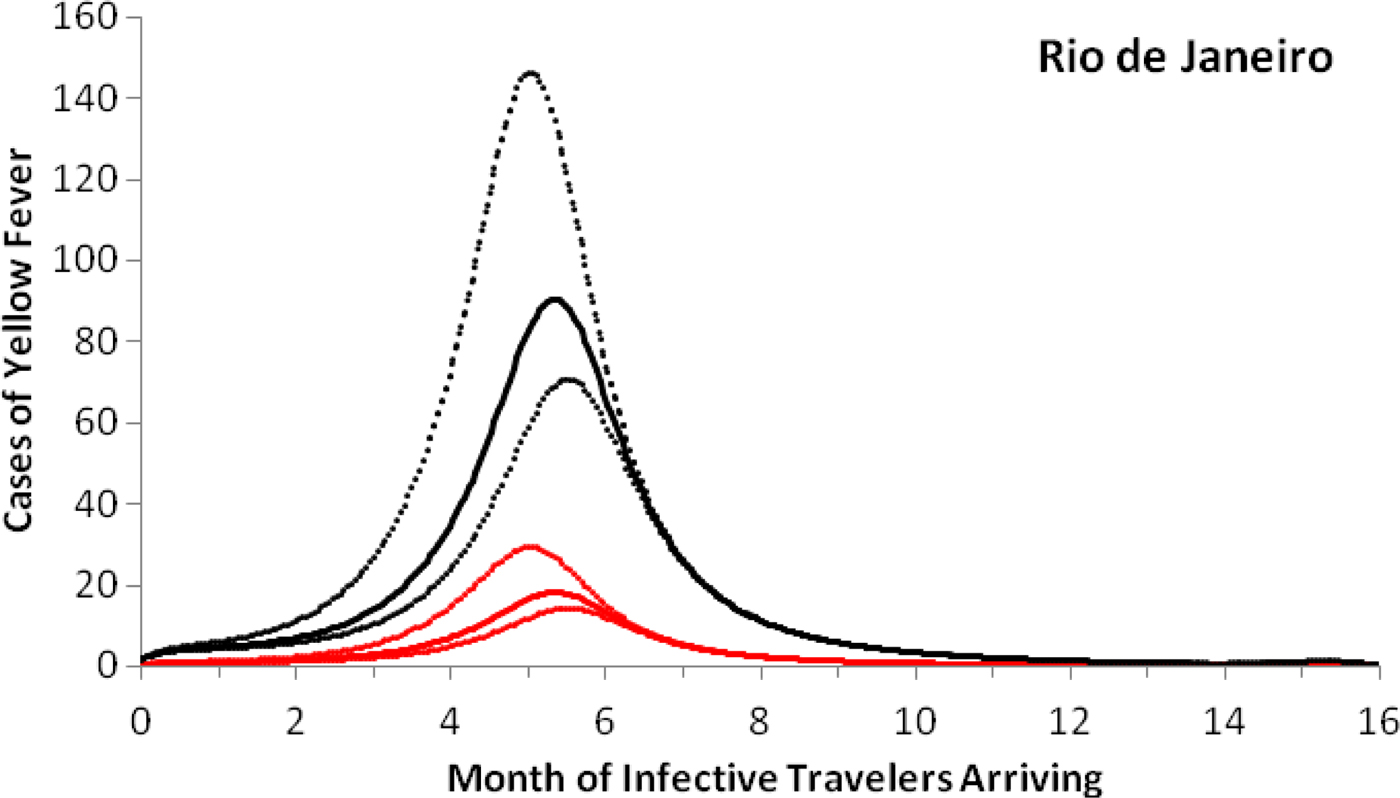
Fig. 3. Cases of yellow fever estimated by the model as a function of the month of infective travellers’ arrival. Estimation of the number of yellow fever infections (black lines) and mortality (red lines) after 1 year, if a density (equal to one) of infected individuals were introduced in the city of Rio de Janeiro (2011–2012) at different months of the year. Continuous lines represent the mean and dotted lines the 95% CI.
Note that with conditions that resulted in the number of cases shown in Figure 3, the maximum probability of outbreak is 1.32 × 10⁻⁵ (95% CI 0.96 × 10⁻⁵–2.21 × 10⁻⁵).
The risk of urban YF resurgence depends on the size of Aedes mosquitoes’ populations and their vectorial competence, defined as the variation in the values of the parameters c and b specific for YF are shown in Figure 4.
Fig. 4. Estimation of the risk of yellow fever introduction in the city of Rio de Janeiro by the arrival of infective travellers (with density one) in week eleven along his/her first generation and (dashed line) the expected number of secondary cases (continuous line) as a function of the relative (with respect to dengue) vector competence. The finely dotted line highlights the threshold of one secondary case. The number of Aedes mosquitoes was calculated from dengue incidence in 2011–2012.
Note that there is a threshold in vector competence (0.7, or 70% of Aedes competence for YF transmission), below which the expected number of cases produced by one infected traveller along his/her infectiousness period is less than one. This compares with the empirical data compiled by Johnson et al., [Reference Johnson, Chambers, Crabtree, Filippis, Vilarinhos, Resende, Macoris and Miller26] who demonstrated that Brazilian strains of Ae. aegypti artificially infected with the YFV had a maximum infection and dissemination proportion of 0.58 and 0.52, respectively. Compared with the parameters b and c of Table 2, which were obtained for dengue, we conclude that there is a relative competence between 0.52 and 0.58, which is below the threshold of 0.7. This perhaps explains the current absence of urban cycle transmission of YF in the Americas.
Discussion
In this paper, we calculated the theoretical number of YF infections after one year, if one infective traveller arrived in February 2012, as well as the probability that the infected individual will produce a secondary case along his/her infectiousness period. Both estimations are presented in Figure 4 varying the simulated values of the local Aedes vector competence and the risk incurred by the city of Rio de Janeiro of urban YF re-introduction, RiskUYFR(t), if in February 2012 the city of Rio de Janeiro were invaded by infected travellers with density one per area of the city.
We showed that there is a low but non-negligible risk of urban YF resurgence in dengue-endemic areas due to the high Aedes mosquitoes’ densities in these areas. The actual risk will be dependent on the probability that at least one infective human arrives at the right moment of the year, that is, when the local population of Aedes mosquitoes is increasing in size and also on their vector competence for YF transmission. Moreover, the vector competence of Aedes mosquitoes in transmitting YF is a crucial factor in determining the transmission of YF and for the risk of urban-YF resurgence. It is believed that the vector competence of Ae. aegypti for transmitting YF is lower than that for transmitting dengue [Reference Massad, Coutinho, Burattini and Lopez8] (see, however [Reference Couto-Lima, Madec, Bersot, Campos, Motta, Santos, Vazeille, Vasconcelos, Lourenço-de-Oliveira and Failloux17]). This fact, in addition to the relatively high vaccination coverage of large regions of the Brazilian territory, may explain why urban-YF has not resurged in these areas. However, the coastal areas of Brazil, including the South Eastern region currently heavily hit by YF epizooties, are not included in the routine vaccination programmes either of the Brazilian Ministry of Health or the State's Health Authorities. This fact, associated with high density of Aedes mosquitoes and a large number of epizooties that keep recurring in these non-vaccinate areas pose a serious risk of an urban-YF resurgence in these regions.
One important limitation of our approach is the fact that the Ross–Macdonald model used in the calculations assumed a homogenously mixing of humans and mosquitoes. Moreover, when we introduce an infected traveller, it is assumed that this infected individual will interact with all the mosquitoes in the area considered, a highly unlikely event in the real world. Therefore, the results of our methods would be more reliable the smaller the geographical area considered, ideally the area covered by the mosquitoes’ range of flight (the 0.8 km2 mentioned in the Olaria example).
Another important limitation of our model is that factors such as travel rates and population density, two determinants previously identified as major factors in YF transmission (see [Reference Johansson, Arana-Vizcarrondo, Biggerstaff, Gallagher, Marano and Staples27, Reference Kraemer, Faria, Reiner, Golding, Nikolay, Stasse, Johansson, Salje, Faye, Wint, Niedrig, Shearer, Hill, Thompson, Bisanzio, Taveira, Nax, Pradelski, Nsoesie, Murphy, Bogoch, Khan, Brownstein, Tatem, de Oliveira, Smith, Sall, Pybus, Hay and Cauchemez28]) were not considered in the model. These factors certainly influence the risk of YF introduction but as we considered the introduction of only one infected traveller in a point in time, we think that travel rates or population density would not significantly affect our results.
Two additional factors not included in the model but that could play an important role in the transmission of YF and consequently the risk of an epidemic, namely, the heterogeneity of vectors distribution and density in the area and the heterogeneity between the different categories of travellers coming from areas with distinct transmission intensity and arriving in areas with different mosquitoes’ densities. However, the model assumed that the traveller arrived already infected, irrespectively from where he/she was coming from. Moreover, data on mosquitoes’ abundance in different areas are either non-available or are very difficult to be obtained. This restricted our analysis to the whole city.
Finally, estimating the risk of urban YF resurgence is crucial for designing an optimum vaccination strategy considering vaccination coverage, vaccine efficacy and the risk of adverse events of the current YF vaccine [Reference Massad, Coutinho, Burattini, Lopez and Struchiner29]. Moreover, since Aedes is invading large parts of the American continent (it is well established in Africa and Asia) the risk of urban YF resurgence in the American cities should because of great concern to public health authorities. We believe that this work represents a step forward to understanding the magnitude of the problem.
Acknowledgements
This work has been funded by LIM01-HCFMUSP, CNPq, by the Brazilian Ministry of Health (grant #777588/2012), by ZikaPLAN through the European Union's Horizon 2020 research and innovation programme under grant agreement No. 734584, and the Canadian Institutes of Health Research (CIHR), consortium Canada-Latin/America-Caribean Zika Virus Program (Grant no. 372512). Data used in this paper are available at http://portalsinan.saude.gov.br/dengue, accessed in January 2017.
Conflict of interests
None.


