


Introduction
A central mission of public health is to track reportable diseases to monitor for outbreaks and trends. Data are used for planning, evaluation of disease prevention and control programmes, outbreak investigations and to assure appropriate availability and use of medical therapy [Reference Chorba1]. Incomplete reporting compromises the ability of public health agencies to execute on their mission. In this report, we use Q fever as an example to explore potential under-reporting of a notifiable disease.
Q fever, caused by the bacteria Coxiella burnetii (C. burnetii), is a nationally notifiable disease that may be under-reported because of its often non-specific symptoms [Reference Anderson2]. This condition was selected for study because it is uncommon in the USA, and the majority of testing is likely to be performed by a small number of clinical reference laboratories. Thus, one large national reference laboratory most likely represents a substantial proportion of all C. burnetii antibody testing nationwide.
Cattle, sheep and goats are the primary reservoirs for C. burnetii, although a variety of species may be infected. Organisms can survive long periods after excretion through milk, faeces, urine or other fluids, and can be spread by wind and dust. The most common route of transmission to humans is inhalation of infectious aerosols directly from birth fluids of infected animals or via inhalation of dust contaminated with dried birth fluids or excreta [Reference Anderson2].
Q fever can cause acute or chronic infection in humans. Frequently, many human infections result in asymptomatic or may result in benign constitutional symptoms, therefore making a diagnosis of Q fever often challenging. Acute symptoms include onset of high fever, peaking in 2–4 days and gradually declining for 1–2 weeks, accompanied by malaise, anorexia, myalgia, weakness and intense headache. Liver damage with hepatomegaly often leads to hepatic granulomas when treatment is delayed or diagnosis is missed. Q fever may also manifest as pneumonitis or bronchitis. Of cases reported to the Centers for Disease Control and Prevention (CDC) for 2002–2014, more than 50% were hospitalised, with a peak of 71% in 2009 [3]. Because of its highly infectious nature and aerosol route of transmission, C. burnetii is also considered a potential bioterrorism agent [Reference Hoek4].
The CDC surveillance case classification consists of clinical evidences of infection with laboratory criteria for acute and chronic Q fever. Laboratory diagnosis relies mainly on serology. Laboratory serologic testing of Q fever may include testing of both phase I and II antibodies of IgM and IgG by immunofluorescence assay (IFA). The presence of IgG to phase II antigen indicates acute disease, and the presence of IgG to phase I antigen indicates chronic disease [5, Reference Fenollar6]. For acute cases, IgM results usually provide ancillary evidence; however, because of the potential for long-term persistence of IgM (>1 year), this marker has limited diagnostic value as a standalone test for acute Q fever. Also, IgM antibodies have much lower specificity than IgG and might have higher cross-reactivity [Reference Anderson2].
Q fever became a nationally reportable disease in 1999; as of 2014, it was a reportable condition in all states and territories except Iowa, New Hampshire, and Vermont and the District of Columbia. The number of cases reported to the CDC annually increased from only 19 in 2000 to 173 in 2007; after a rapid decline in 2008 following a change in reporting to distinguish acute from chronic infection, the numbers increased again to 176 in 2014 (137 acute, 39 chronic) based on year of illness onset [3]. However, at least two reports have suggested that the frequency of Q fever may still be severely under-reported [Reference Sickbert-Bennett7, Reference Dahlgren, Haberling and McQuiston8].
This study examined the incidence of laboratory-based diagnosis of acute and chronic infections by C. burnetii within one national clinical reference laboratory over a 7-year period: 2010–2016. The primary goal was to estimate the gap in Q fever reporting by comparing our results to the numbers of cases reported to the CDC during this period (2010–2016) for which published CDC data were available. Based on our literature research, this is the first such report using reference laboratory test result data to examine the completeness of Q fever reporting.
Methods
Quest Diagnostics maintains the largest private clinical laboratory database in the USA, comprising results from more than 160 million patient encounters annually with individuals from every state. This study is part of the ongoing Quest Diagnostics Health Trends™ effort deemed exempt by the Western Institutional Review Board (Puyallup, Washington, USA).
For this study, we included all patients who were tested for C. burnetii IgG antibody from January 2010 through December 2016, from all 50 states in the USA and Washington, DC (D.C.). Serum specimens were tested for IgG phase I and II antibodies by indirect IFA using a United States Food and Drug Administration-cleared diagnostic kit (Q Fever IgG, product code, IF0200G, Focus Diagnostics, Cypress, California, USA). Antibody screen-positive results were reported as antibody titres. Testing was performed by Quest Diagnostics at two different reference laboratories in California: Quest Diagnostics Nichols Institute in Valencia and San Juan Capistrano. Due to a low volume of PCR tests, we did not include positive PCR results in identifying Q fever cases in this study.
In CDC surveillance cases, in addition to clinical criteria, a confirmed acute Q fever from serological testing requires a fourfold rise in phase II IgG antibody titre between paired serum samples, one taken during the first week of illness and a second 3–6 weeks later, while a probable acute Q fever has laboratory-supportive results of a single IgG titre ⩾1:128 to C. burnetii phase II antigen by IFA. The CDC chronic Q fever can be based on clinical evidence with laboratory confirmation (IgG titre ⩾1:800 to C. burnetii phase I antigen by IFA) for confirmed cases or laboratory-supportive results (IFA IgG titre ⩾1:128 and <1:800 to C. burnetii phase I antigen) for probable cases. The CDC data reported in this study include both confirmed and probable cases. Despite the limitation of a single elevated antibody titre in diagnosing acute Q fever, this is the most commonly applied diagnostic criterion among cases reported to CDC, likely because clinical suspicion for Q fever is uncommon for patients who initially seek care for symptoms [Reference Anderson2].
For the Quest Diagnostics data in this study, presumptive acute Q fever was defined as a phase II IgG titre of ⩾1:128 and a phase I IgG titre of <1:1024 (including phase I antibody screen-negative results), equivalent to the CDC laboratory-supportive cases. Chronic Q fever was defined as a phase I IgG titre of ⩾1:1024, consistent with the CDC laboratory confirmation of chronic infection (phase I IgG titre ⩾1:800), given that the next-lowest titre below 1:1024 reported by Quest Diagnostics laboratories is 1:512. Though there is a lack of data confirming clinical manifestation, it is reasonable to assume that the majority of serological tests were ordered based on clinical indications of or epidemiologic links to probable infection. Therefore, conceptually, the presumptive cases identified at Quest Diagnostics are merely a subset of the cases that should have been reported to CDC. The cut-off of phase I IgG titre (1:1024) was included in the definition of acute infection to ensure that acute and chronic categories were mutually exclusive in the cases of an elevated phase I antibody titre.
Patient-level records were stored using the patient's first name, last name and date of birth throughout the study period; however, only aggregated, de-identified data were reported. Patient-level analyses were based on their initial positive tests since 1 January 2010, the start of the study period. The reported year and month for the Quest Diagnostics data are when serologic tests for C. burnetii IgG phase I or II antibodies are ordered, while the indicated year in the CDC data is year of reporting. Results with missing gender and state data were excluded from specific analyses that required those elements. When the state of patient residence was not on record, the state of the ordering physician was used. Data derivation and analysis were performed in SAS version 9.4 (SAS Institute, Cary, NC, USA).
Results
Acute Q fever
From January 2010 through December 2016, 18 672 serum specimens submitted for C. burnetii IgG phase II antibody testing were reported with a valid titre result. Of those, 4372 specimens (23.4%) from 2298 patients had a phase II IgG titre of ⩾1:128 and a phase I IgG titre of <1:1024. Thus, 2298 patients met our criteria for presumed acute Q fever over a 7-year study period. Among those patients, 1460 (63.5%) were male; no gender information was available for 25 patients (1.1%). At the time of their initial positive tests, 48% of patients were 50–69 years old; 37% were younger than 50, and 15% were 70 or older. The majority of phase II IgG antibody results at the time of initial positive testing had a titre of 1:256 (53%), followed by a titre of 1:128 (35%) and then by a titre of ⩾1:512 (12%).
Figure 1 depicts the number of acute Q fever cases for each year from 2010 to 2016, along with the annual average, for the CDC and Quest Diagnostics [Reference Adams9–15]. The number of acute cases identified annually at Quest Diagnostics was much higher than that reported by the CDC in each year of 2010–2016. The largest deviation was in 2010, when the number reported to the CDC represented only 27.2% (106/389) of the cases identified at Quest Diagnostics. The proportion was fairly consistent from 2011 to 2014 (CDC/Quest Diagnostics: 40.3%, 38.7%, 40.8%, 38.9%), dropped to 33.6% in 2015, and then grew to 43.1% again in 2016. On average, the annual number of acute cases reported to the CDC was equivalent to 37.2% (122/328) of the number of presumed acute cases identified in this study during 2010–2016.
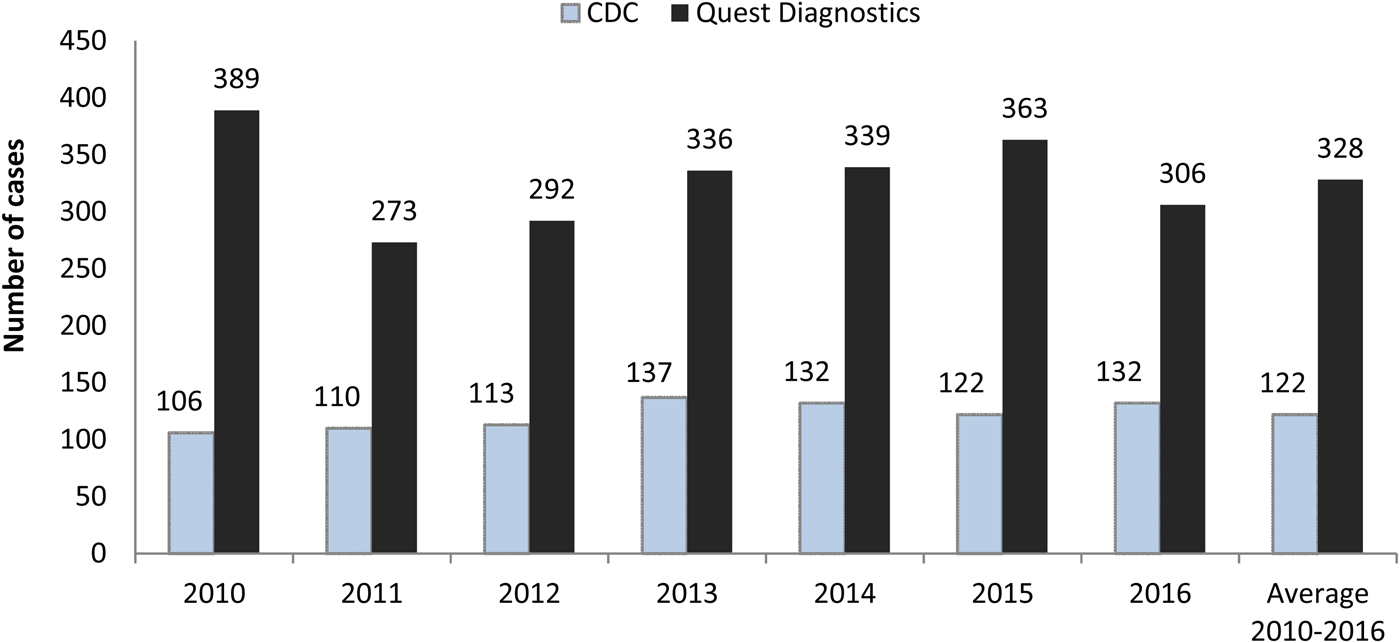
Fig. 1. Acute Q fever cases reported by the Centers for Disease Control and Prevention (CDC) and identified at Quest Diagnostics. CDC data are for the reporting year and include both confirmed and probable cases. Quest Diagnostics data represent laboratory-supported (probable) cases in the testing year.
In this study at least one patient from every state had presumed acute Q fever in the years 2010–2016. Among 2286 patients (99.5%) with a patient address or ordering physician address provided, 30.7% were from California, followed by Utah (11.9%), Texas (7.4%), Minnesota (4.3%), New York (4.2%), Pennsylvania (4.0%), Missouri (3.4%) and Arizona (3.1%); all other places combined represented 31% of the total. Twelve patients had no information on state of residence.
There was a seasonal pattern in initial positive specimens among all patients with presumed acute Q fever. Among the 2298 first-positive specimens, the most active months were June (accounting for 10.2%), July (10.3%) and August (11%); the least active months were November (5.4%) and December (6.4%).
Chronic Q fever
Over the same study period, 14 579 serum specimens were reported with a valid titre result for C. burnetii IgG phase I antibody testing. Of those, 537 specimens (3.7%) from 237 patients had a phase I IgG titre of ⩾1:1024. Of these patients, 75.1% were males and 1.7% had no gender information available. At the time of their first-positive tests, more than half of the patients with laboratory-confirmed chronic Q fever were 50–69 years old (57%); 28% were under 50, and 15% were at least 70 years. Phase I IgG titre results were 1:1024 in 78% of patients, and greater in the remaining patients (maximum titre of 1:262 144).
In 2010–2012, an average of 38 chronic Q fever cases was identified annually at Quest Diagnostics. This decreased to an average of 11 cases annually in 2013–2015, but surged to 88 cases in 2016 (Fig. 2). When compared with the CDC data, the numbers of laboratory-confirmed chronic Q fever in this study were moderately higher in the first 3 years from 2010 to 2012 (CDC/Quest Diagnostics: 52.1%, 66.7%, 71.0%), became much lower during 2013–2015 (366.7%, 211.8%, 425.0%), and then reversed to be significantly higher in 2016 (36.4%). On average, the annual number of chronic cases reported to the CDC was just slightly lower than the number of presumed chronic cases identified at Quest Diagnostics during 2010–2016 (Fig. 2).
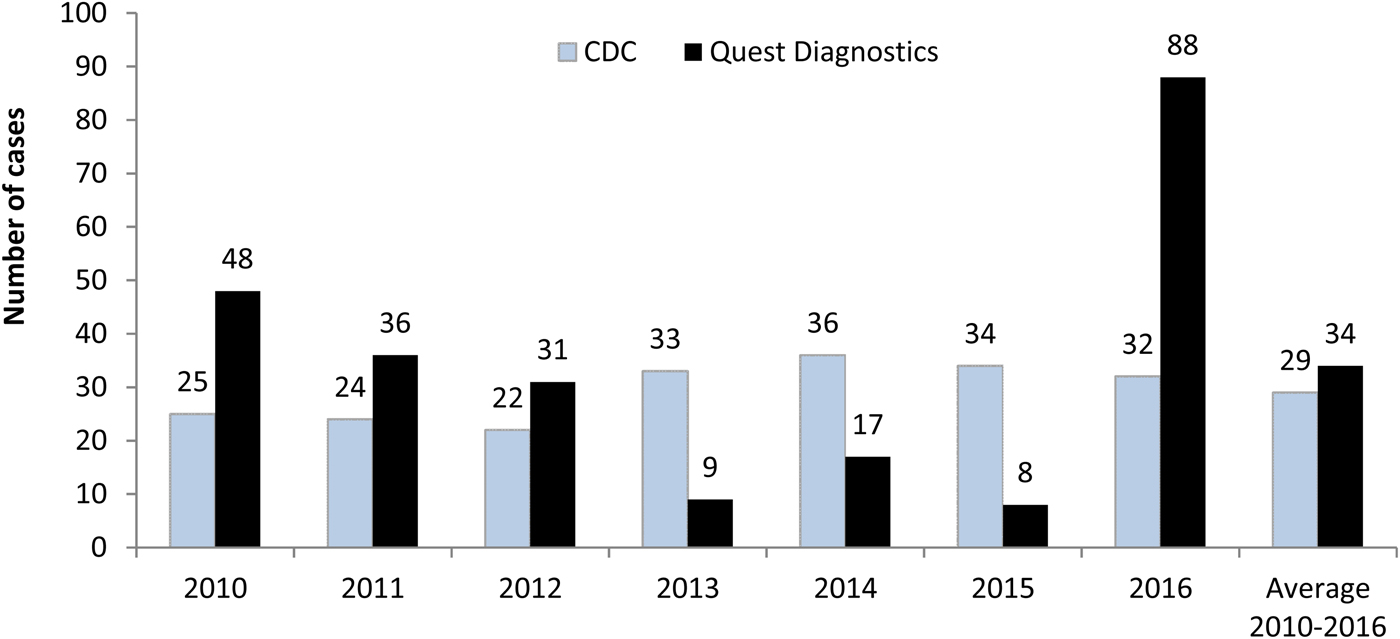
Fig. 2. Chronic Q fever cases reported by the Centers for Disease Control and Prevention (CDC) and identified at Quest Diagnostics. CDC data are for the reporting year and include both confirmed and probable cases. Quest Diagnostics data represent laboratory-confirmation (confirmed) cases in the testing year.
Among 231 patients (97.5%) with either a patient address or ordering physician address, the highest proportion of patients with presumed chronic infection was from California (48.1%), followed by Texas (6.1%), Arizona (5.2%), New York (4.8%) and South Dakota (3.5%); all other places represented 32.5% of the total. The peak month in terms of the first positive specimens was June (14%) and the least active month was December (2.5%), but there was not a clear pattern in other months.
Discussion
During 2010–2016, the numbers of presumptive acute Q fever cases observed from the largest private clinical laboratory database in the USA were consistently higher than what were reported to the CDC, indicating a potentially significant under-reporting in acute Q fever illness. The numbers of acute cases reported to the CDC were between 27.2% in 2010 and 43.1% in 2016 of the numbers identified at Quest Diagnostics. On average, 328 acute laboratory-supportive cases were identified annually at Quest Diagnostics. In contrast, an annual average of 122 cases was reported to the CDC during the same time period. Thus, the cases reported by the CDC represented only 37.2% of the annual average in this study. Given that Quest Diagnostics does not perform all C. burnetii antibodies testing nationally and that the Quest data include only the probable cases but the CDC data contain both probable and confirmed infections, it would be reasonable to assume that the extent of under-reporting is greater than depicted in this study. One previous study estimated that the number of Q fever cases reported to the CDC through CRFs underestimated the number of actual cases by at least a factor of 14 [Reference Dahlgren, Haberling and McQuiston8]. Similarly, the incidence of Q fever in the Netherlands high-incidence area was underestimated by a factor of 12.6 by comparing the number of notifications and the number of infections [Reference Hoek4].
The data in this study were not sufficient to show evidence of under-reporting in chronic Q fever reporting. Although <5% of acute Q fever cases are estimated to progress to potentially fatal chronic infections, 19% of Q fever cases reported to the CDC from 2010 to 2016 were chronic Q fever [Reference Adams9–15]. Presumably, chronic Q fever tends to be clinically more distinct, lending itself to more aggressive diagnostic exploration and therefore more reporting [Reference Dahlgren, Haberling and McQuiston8].
Q fever, like other reportable conditions, has different reporting requirements in different states. In the USA, the authority to require disease notification resides in the respective state legislatures or by state law has been delegated to state boards of health; still other states require reports both under statutes and under health department regulations. Variation among states also exists among conditions and diseases to be reported, time frames for reporting, agencies receiving reports, persons required to report and report formats. For Q fever, reporting is generally required by physicians who have direct access to patient history and are aware of clinical symptoms. In 2014, Q fever was not a reportable disease in Iowa, New Hampshire, Vermont and D.C. [3]. These states and D.C. have relatively small populations and would have a small impact on reported cases to the CDC; only 1.2% of acute cases and 0.4% of chronic cases in our study originated from one of these regions.
In CDC data and ours, infection was more common among males than females. The age distribution of infected patients between this study and the CDC studies appeared similar. The seasonal pattern in acute Q fever we observed was identical to that reported by the CDC. The active months for acute infection coincide with more outdoor activity and the birthing season for domestic animal species [3].
In 2014, four states (California, Texas, Colorado and Illinois) accounted for more than 35% of cases reported to the CDC, where ranching and rearing of livestock are common [3]. In our study, the following states had high numbers of acute (and chronic) Q fever: California (acute and chronic), Utah, Texas (acute and chronic), Minnesota, New York (acute and chronic), Pennsylvania, Missouri and Arizona (acute and chronic).
Experts have lamented on the challenges of disease reporting for at least four decades [Reference Marier16]. A 1988 study estimated that the completeness of reporting for many common notifiable diseases ranged from 6% to 90% [Reference Thacker and Berkelman17]. A 2002 review found completeness to vary from 9% to 99%, dependent upon the medical condition [Reference Doyle, Glynn and Groseclose18]. A 2011 study found that completeness of reportable disease reporting in North Carolina was generally low even for diseases with great public health importance, including Q fever (26% completion) [Reference Sickbert-Bennett7]. Currently, large clinical commercial laboratories have automated electronic reporting for medical conditions for which the primary diagnosis is clinical laboratory test results. CDC reporting of Q fever includes clinical information that is rarely available to clinical laboratories. Electronic health records lag in the ability to automatically submit reportable cases, and electronic reporting systems create new challenges [Reference Nguyen19, Reference Gluskin, Mavinkurve and Varma20]. States and territories report to the CDC through the National Electronic Telecommunications System for Surveillance. It is unknown whether automated electronic systems have had any adverse or positive impact on the completeness of reporting. There is hope that health information systems may improve the collection and timely transmission of reportable diseases [Reference Shapiro21]; interventions aimed at improving education and awareness have had limited success [Reference Weiss, Strassburg and Fannin22, Reference Konowitz, Petrossian and Rose23].
The strengths of this study include the consistent testing methodology over a 7-year study period extending through 2016. Because testing for C. burnetii antibody is considered esoteric, large national laboratories likely perform a high proportion of testing in the USA. Patients who were categorised as having presumed acute Q fever came from all 50 states in the USA and D.C.
The weakness in this study is that we depended upon laboratory data only, with no access to clinical or epidemiological evidence to confirm a Q fever acute or chronic case. Furthermore, for acute cases, we used a single (presumably) convalescent titre instead of paired acute and convalescent specimens – ideally taken 3–6 weeks apart. For chronic cases, we chose to only report laboratory-confirmed cases to avoid double counting a patient in both acute and chronic groups due to the limitation of using the same dataset to identify both classifications. Though for estimating the gap between the occurrence of infection and notification, our operational definition is consistent with CDC and other reports when analysing laboratory data only.
In summary, our analysis of data for C. burnetii IgG antibody testing by a large national clinical laboratory suggests that the occurrence of acute Q fever is very likely more than three times higher than what was reported to the CDC during 2010–2016.
Public health implications
Epidemiologic surveillance of reportable infectious diseases is a vital component for disease detection and control. However, the completeness of reportable disease reporting is variable. Better reporting completeness would lead to improved understanding of Q fever prevalence and could lead to more rapid detection of outbreaks, including those potentially related to bioterrorism.
Conflict of interest
The authors are full-time employees of Quest Diagnostics. The authors have indicated that they have no financial relationships relevant to this article to disclose.


