


Introduction
Antimicrobial resistance (AMR) surveillance programmes perform antimicrobial susceptibility tests on pathogens and indicator bacteria. Surveillance programmes monitor changes in the prevalence of non-susceptible isolates for a given drug–bacteria combination over time and space. This information is valuable to guide antimicrobial stewardship recommendations, evaluate AMR interventions and support policy decisions such as removal of drugs that are critically important for human medicine from animal agriculture use [Reference Collignon1–Reference Zawack3]. Antimicrobial surveillance data are multivariate as each isolate is tested against multiple antimicrobial drugs in a panel. Analysis of the associations among phenotypical resistances at the bacterial population level can provide additional information on the changes of the multidrug nature of bacteria. However, this information is not commonly sought in AMR surveillance programmes. We recently developed a network-based approach to analyse and report the associations among phenotypical resistances [Reference Love2]. Representing the correlated resistances as graphical models provides an intuitive method for communicating how the resistances interact and a framework for analysis.
Antimicrobial use is one of the most important selection pressure for phenotypical resistance traits, and this selection may occur via several mechanisms [Reference Mouton4–Reference zur Wiesch6]. Repeated use of a specific drug will likely result in an increase of the mean minimum inhibitory concentration (MIC) to the drug in a population of bacteria where the wild type is more sensitive. This selection is referred to as direct selection since the selected trait is the one responsible for improved survivorship in the environment, e.g. repeated tetracycline use directly selects for increased tetracycline MICs over time. Other AMR phenotypes may be selected indirectly because they are correlated with directly selected traits. A variety of mechanisms, including linked genes and mutations to shared antimicrobial targets, can result in correlated phenotypical resistance traits. These collateral resistances can allow for the indirect selection of MDR bacteria by use of a single antimicrobial drug [Reference Canton and Ruiz-Garbojosa7]. For example, if tetracycline and ampicillin MICs are positively correlated in a population of bacteria, tetracycline use in this population may indirectly select for higher ampicillin MICs. Graphical models of AMR surveillance data can highlight the potential for indirect phenotype selections in the modelled population.
Non-typhoidal salmonellosis (NTS) is a leading cause of bacterial gastroenteritis worldwide [Reference Hunter, Francois Watkins and Brunette8]. NTS is caused by serotypes of Salmonella enterica ssp. enterica other than S. typhi and S. paratyphi, which cause typhoid fever [Reference Hohmann9]. Some of these serotypes are host-adapted to production animals, e.g. S. dublin in cattle, and others can subclinically infect multiple hosts, e.g. S. enteritidis and S. typhimurium [Reference Uzzau10]. Contact with contaminated animal food products is the most common source of infection. Many cases of NTS are self-limiting and antimicrobial administration is contra-indicated [Reference Bush, Perez, Porter and Kaplan11, Reference Onwuezobe, Oshun, Odigwe and Onwuezobe12]. However, treatment with antimicrobials can be life-saving in severe or invasive NTS (iNTS) cases. Ciprofloxacin, ceftriaxone or azithromycin are the drugs most commonly prescribed to treat iNTS [Reference Onwuezobe, Oshun, Odigwe and Onwuezobe12–Reference Kariuki14]. Cases of iNTS are more likely to occur in patients who are very young, very old or immunosuppressed. The risk of iNTS also appears to vary by aetiologic serotype; invasive disease has been reported to occur in 5–10% of patients infected with the most common serotypes S. typhimurium and S. enteritidis, but iNTS has been reported in 60–70% of patients infected with S. dublin [Reference Jones15, Reference Lanridge16].
Since NTS is typically attributed to non-human sources, the use of antimicrobials in food animals has the potential to increase the prevalence of resistant NTS organisms. Ciprofloxacin, ceftriaxone and azithromycin are not approved for use in livestock in the USA, but resistance to these drugs may still occur via indirect selection. Enrofloxacin, ceftiofur and erythromycin are licensed for use in production medicine and are functionally similar to ciprofloxacin, ceftriaxone and azithromycin, respectively [17]. The use of these licensed drugs may indirectly select for clinically important resistance traits via cross-resistance, the collateral resistance attributed to a single gene or mutation that increases the MIC for several related drugs [Reference Canton and Ruiz-Garbojosa7]. The collateral resistance induced by the extended-spectrum β-lactamase CMY-2 is another example of cross-resistance [Reference Arlet18]. This enzyme is encoded by bla CMY-2 and is effective against many β-lactams antimicrobials including, ceftiofur and ceftriaxone, third-generation cephalosporins. In populations where bla CMY-2 is variably present, ceftiofur and ceftriaxone MICs will be correlated. The use of ceftiofur will then select for isolates carrying bla CMY-2 and indirectly select for increased ceftriaxone resistance. Co-resistance is a distinct source of collateral resistance that occurs when two or more resistance genes tend to be transmitted together. Integrons in some NTS serotypes contain both bla CMY-2 and tetA, a tetracycline resistance gene [Reference Canton and Ruiz-Garbojosa7]. These integrons are a source of co-resistance and the use of tetracycline in populations where these integrons occur may indirectly select for increased ceftriaxone MICs.
The objectives of the current study are to map the phenotypical patterns of collateral resistance in several subpopulations of NTS organisms and to identify specific antimicrobial drugs that may indirectly select for increased resistance to the antimicrobials used to treat NTS. Phenotypical patterns of collateral resistance were estimated using graphical models. The graphical models’ structures were then used to select a set of general linear models for the medically important resistances: azithromycin, ceftriaxone and ciprofloxacin. The linear models were used to quantify the strength of the collateral resistances for medically important resistances.
Materials and methods
Data sources
Salmonella isolate data were taken from the National Antimicrobial Resistance Monitoring System (NARMS) [19, 20]. The current study used data from NTS organisms isolated from animal carcasses and retail meat during 2011–2013. Isolates obtained prior to 2011 are omitted because the drug panels changed in 2011 and older data may not be representative of more contemporary Salmonella populations. Data were available for 5384 isolates of Salmonella spp. across 110 distinct serotypes from chicken, cattle, swine or turkey sources during this period [21]. The data were divided into subpopulations defined by host species and serotype. Subpopulations were selected if data were available for 75 or more isolates. For brevity, each subpopulation was assigned an abbreviation comprised of the first two letters of the host species and the first three letters of the serotype. Ten subpopulations containing a total of 2875 isolates (53.4% of total sampled) were identified for further evaluation (Table 1). Serotypes E nteritidis and T yphimurium are most commonly associated with NTS gasteroenteritis in human patients. Therefore, the subpopulations of S. enteritidis isolated from chickens (ChEnt) and S. typhimurium in cattle (CaTyp) and in chickens (ChTyp) were selected. These serotypes were isolated from other sources, but were not numerous enough to be included in the study. Subpopulations of S. kentucky from chickens (ChKen), S. montevideo from cattle (CaMon), S. hadar from turkeys (TuHad) and S. anatum from swine (SwAna) were selected as the most common serotypes isolated from the respective non-human sources. Salmonella dublin from cattle (CaDub) and S. heidelberg from chickens (ChHei) and turkeys (TuHei) were selected because these serotypes have been reported to cause iNTS in more than 10% of human cases in the USA [Reference Jones15]. Other highly invasive serotypes such as Newport and Choleraesuis were isolated from animal sources during the NARMS study, but the data available for these subpopulations in the NARMS study contained very few isolates for analysis.
Table 1. Summary of non-typhoidal Salmonella enterica isolates, stratified by host and serotype, from the NARMS study collected during 2011–2013, including subscript (s), size of the subpopulation (n s) and the reported invasive index

A total of 5384 isolates were collected from all animal sources during this time period, and 2875 isolates were included in the study.
Phenotypical resistance was measured as MIC, and MIC results for 21 antimicrobials were available from the selected isolates. However, MICs were only consistently available for the following 15 phenotypical resistance traits: ampicillin (AMP), amoxicillin plus clavulanic acid (AMC), cefoxitin (FOX), ceftriaxone (AXO), ceftiofur (TIO), streptomycin (STR), gentamicin (GEN), kanamycin (KAN), nalidixic acid (NAL), ciprofloxacin (CIP), sulfisoxazole (FIS), trimethoprim plus sulfmethoxazole (COT), tetracycline (TET), azithromycin (AZI) and chloramphenicol (CHL). Antimicrobials were classified based on the chemical structure and target of action (Table 2). While it is common practice to interpret MIC values using established breakpoints which define sensitive, resistant and occasionally intermediate ranges, interpreted MIC values were not used in the analysis in the current study. Instead, the graphical and linear models were fit using log2(MIC) values. Categorisation has been shown to significantly decrease statistical power, resulting reduced sensitivity of an analysis to detect correlation [Reference Cohen22, Reference Beckstead and Beckie23]. Preserving susceptibility results in their continuous form also allows for the detection of variance when all MICs are below published breakpoints, which would result in monotonically ‘sensitive’ results (Figs 1–4).

Fig. 1. The R-nets for four NTS serotypes collected from chicken by the USDA and FDA during the 2011–2013 NARMS study. Vertex size is scaled to the proportion of clinical resistance, and vertex colour represents the class of the respective drug resistance (see Table 2). Line colour and weight represent the sign and strength, respectively, of the partial correlations ω ij.

Fig. 2. The R-nets for three NTS serotypes collected from cattle by the USDA and FDA during the 2011–2013 NARMS study. Vertex size is scaled to the proportion of clinical resistance, and vertex colour represents the class of the respective drug resistance (see Table 2). Line colour and weight represent the sign and strength, respectively, of the partial correlations ω ij.

Fig. 3. The R-nets for two NTS serotypes (Heidelberg and Hadar) collected from turkey and one serotype (Anatum) collected from swine by the USDA and FDA during the 2011–2013 NARMS study. Vertex size is scaled to the proportion of clinical resistance, and vertex colour represents the class of the respective drug resistance (see Table 2). Line colour and weight represent the sign and strength, respectively, of the partial correlations ω ij.
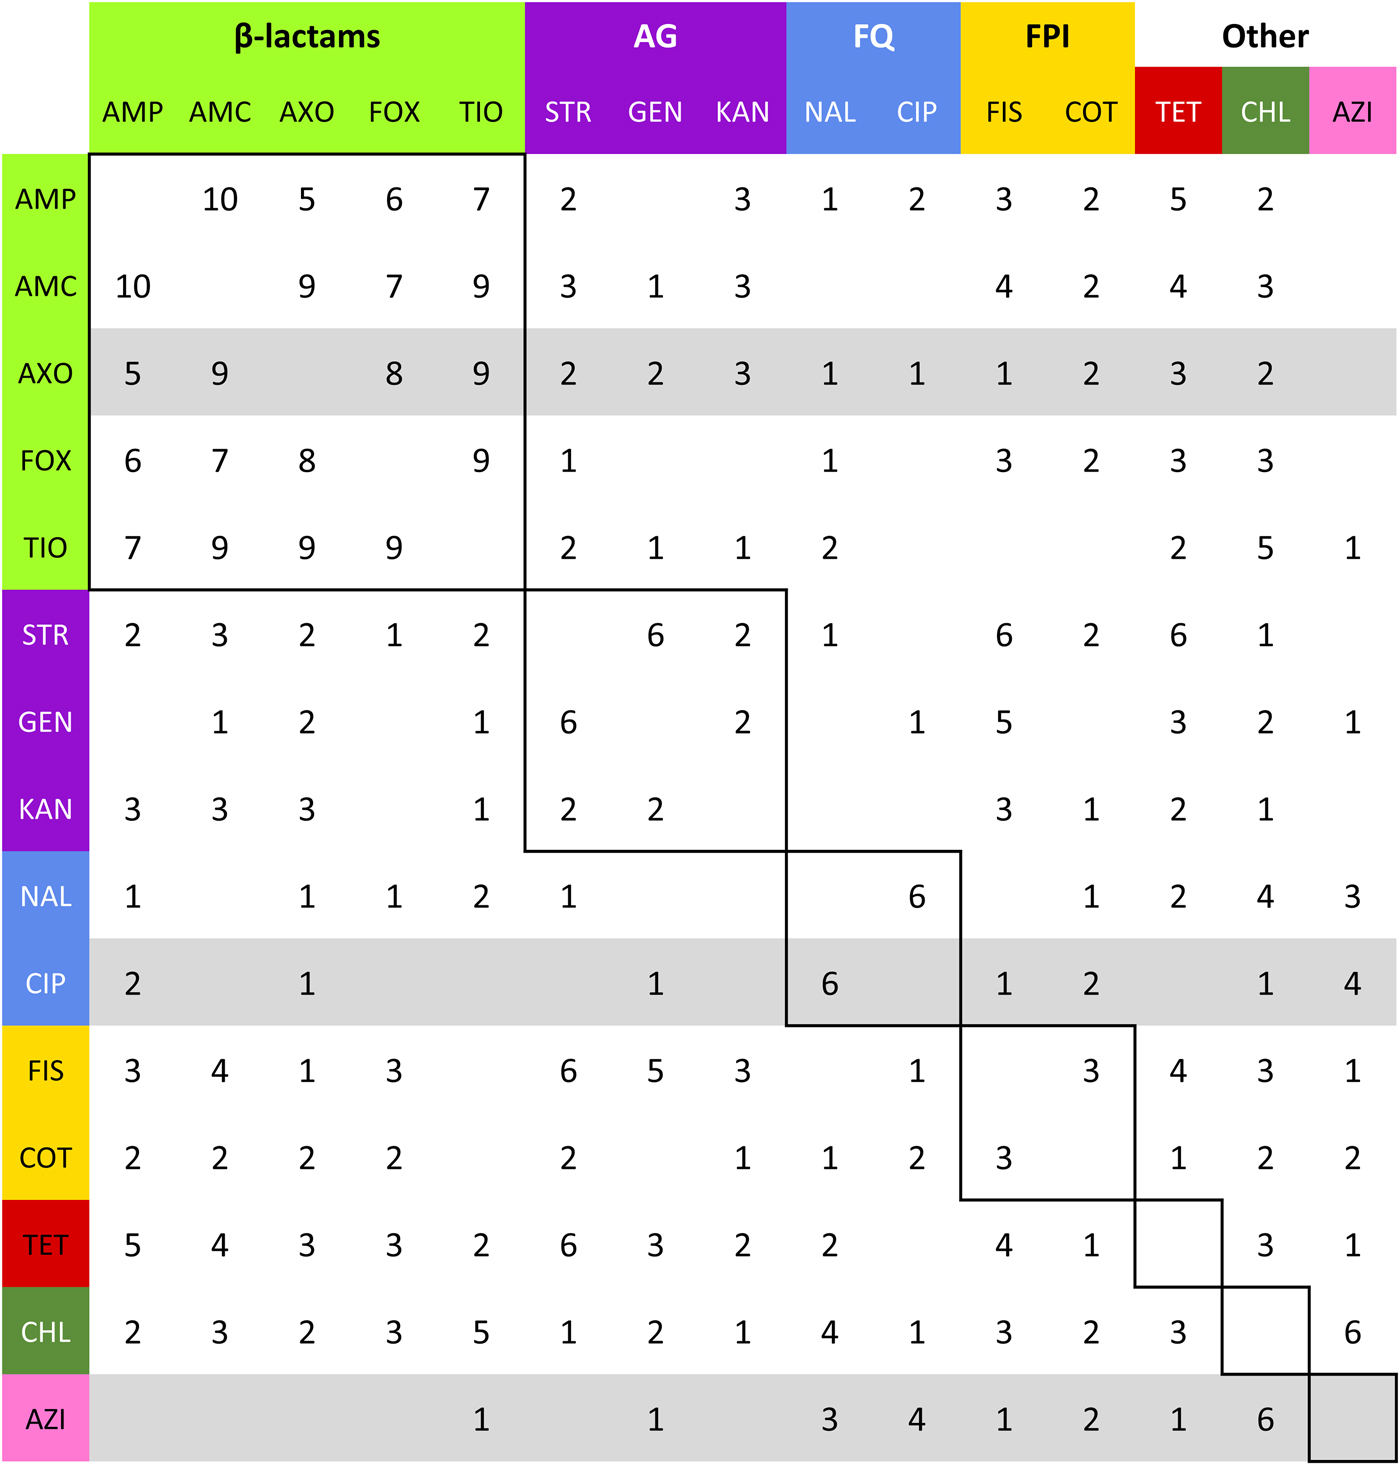
Fig. 4. Summation of adjacency matrices of R s. Elements of the matrix represent the frequency of the edges corresponding to row and column. Row and column labels are coloured to correspond to the class of the respective drug resistance (see Table 2). Elements enclosed by solid lines in the matrix represent edges that join resistances to drugs of the same class (matched-class edges) and other elements represent edges between resistances to drugs of different classes (cross-class edges). Rows representing resistances to drugs used to treat NTS are highlighted in grey.
Table 2. Antimicrobial descriptions, classes and resistance breakpoints for Salmonella enterica [24, Reference Sjölund-Karlsson25]

The prevalence of each resistant trait, i.e. the proportion of isolates with an MIC which met or exceeded published breakpoints, in each subpopulation is reported to provide a context for interpretation [24]. The Clinical and Laboratory Standards Institute (CLSI) has not published breakpoints for azithromycin resistance for S. enterica isolates other than Typhi, so suggested epidemiologic cut-offs for azithromycin were used instead [Reference Sjölund-Karlsson25].
Resistance relationship network estimation
Resistance relationship networks, or R-nets, were used to estimate correlations between AMR traits in the selected subpopulations. These networks are Markov random fields (MRF), a type of undirected graphical model that can be estimated from empirical data [Reference Love2, Reference Hastie, Tibshirani and Friedman26]. A graphical model consists of two sets: a vertex set V and an edge set E containing the connections between the elements of V. An R-net's vertex set V represents the k antimicrobial drugs in the resistance panel. The edge set E represents the m non-zero partial correlations between resistances. The partial correlation between vertices i and j (ω ij) is the standardised covariance after controlling for the remaining resistances in the panel. The R-nets provide a profile of the correlated phenotypical resistance traits in a population, and strongly connected sets of resistances represent traits that can be selected together via indirect selection. For example, if FIS, STR and CHL were all connected in the network, it would be expected that chloramphenicol use would select for increased CHL directly and increased STR and FIS indirectly [Reference Love2]. An R-net R s was estimated separately for each of the 10 selected subpopulation s.
Spearman's rank correlation matrices were estimated for each subpopulation and transformed to partial correlation matrices using the graphical LASSO, an L 1 regularisation method [Reference Daniel27–Reference Liu, Langford and Pineau29]. Regularisation methods use penalties to select sparser or simpler models; in the graphical LASSO, higher values of the L 1 penalty λ reduce more ω ij to zero and produces sparser networks [Reference Friedman, Hastie and Tibshirani28]. In the current study, the stability approach to regularisation selection (StARS) was used to select an appropriate λ for each subpopulation [Reference Liu, Roeder, Wasserman and Lafferty30]. Stability scores for candidate penalties from λ = 0.05 to λ = 0.50, in 0.05 increments, were evaluated for each subpopulation s. For each subpopulation s and for each candidate λ, 100 subsamples of s selected without replacement of size 7√n s were used to estimate StARS stability statistics D s for that subpopulation. The smallest λ that had a D s < 0.05 was selected to estimate R s.
Analysis
Univariate descriptive statistics for log2(MIC) values were estimated to better understand the subpopulations’ susceptibility characteristics. The structures of R s were compared in several ways. The maximum number of edges in a graph is m max = kC 2 = k(k − 1)/2 and network density  $\bar m$ describes the size of the network as a proportion of the network's maximum size ( $\bar m$ = m/m max). In each R s, the proportion of edges present between vertices representing resistances to the drugs of the same class (matched-class edges), e.g. AXO–AMP, and edges joining resistances to different drug classes (cross-class), e.g. CHL–AXO, was compared using a χ 2 test for homogeneity.
In addition to the density of the complete R-nets, two important induced subgraphs were also evaluated. The first included all five β-lactam resistances: AMP, AMC, FOX, AXO and TIO. These drugs share a common structure and target, in some cases allowing resistance mechanisms to be broadly effective against many drugs in the class. The second induced subgraph of AMP, CHL, STR, FIS and TET was also constructed. The co-occurrence of these five phenotypical resistances is frequently seen in DT104 Typhimurium isolates. The ‘ACSSuT’ resistance genes (bla CARB2, floR, aadA2, sul1 and tetA, respectively) are known to reside on a chromosomal type 1 integron [Reference Briggs and Fratamico31].
Linear models for the medically important resistances AXO, AZI and CIP were created based on the R-net structures to parameterise the relationships between these and other resistances. These models provide unbiased estimates of the magnitude of the relationships between the resistances of interest. The linear models were of the general form log2(Y s) = β 0 + Σ β Xslog2(X s) where Y ∈ {AXO, AZI, CIP} in R s, X s is the set of resistances adjacent to Y in R s and β Xs represents the average change in Y associated with a one dilution, or twofold, increase in X s. For example, if CIP was only adjacent to NAL in R s, the corresponding model for ciprofloxacin would be log2(CIP) = β 0 + β NALlog2(NAL), and β NAL = 1.5 would indicate that a twofold increase in nalidixic acid resistance was on average associated with a 21.5 = 2.8-fold or 180% increase in ciprofloxacin MICs. Quantile–quantile or Q–Q plots were used to evaluate if the models’ standardised residuals conformed well to a normal distribution. Coefficients from linear models that had standardised residuals that did not conform to the standard normal distribution were reported, but not interpreted. Adjusted R 2 values were used to assess the fit of each linear model.
Analyses were performed using R and network structure estimate was performed using the ‘glasso’ package [Reference Friedman, Hastie and Tibshirani28, 32].
Results
General descriptive statistics
No clear patterns across the subpopulations were noted in the MIC descriptive statistics (Supplementary Tables S1–S3). Overall, AMP, FIS, STR and TET were the most prevalent resistances and CHL resistance was uncommon except in Typhimurium and Dublin isolates from cattle. Resistance to azithromycin, defined by the epidemiologic cut-off, was noted only in one Kentucky isolate. Isolates of the most common serotypes in the respective hosts generally had low resistance prevalence to all antimicrobials, and the subpopulation of Dublin isolates had the highest prevalence of resistance for most antimicrobials.
Network structures
The most stable network structures were found 0.1 ⩽ λ ⩽ 0.3 (Table 3). The number of edges in the most stable networks ranged from 12 edges in the Enteritidis isolates from chicken, to 44 edges in the Dublin isolates from cattle, with respective densities  $\bar m_{{\rm ChEnt}} $ = 11.4% (λ ChEnt = 0.25) to $\bar m_{{\rm CaDub}} $ = 41.9% (λ CaDub = 0.25). Over the 10 subpopulations, $\bar m$ was not significantly correlated with λ (Spearman's ρ = 0.11, P = 0.77). With k = 15 drugs in the panel, there were 15C 2 = 105 unique edges which could be observed, and 83 of those edges appeared in at least one R s. Fifteen of the 105 possible edges were matched-class edges and all matched-class edges appeared in two or more R s. Many of the edges most frequently observed over all 10 subpopulations were matched-class edges. The 10 edges joining pairs of β-lactams were the most common matched-class edges observed and each of these 10 edges were present in five or more subpopulations. The STR–GEN edge appeared in six networks, while KAN–STR and KAN–GEN were only noted in four networks. The NAL–CIP edge was seen in six networks and the FIS–COT edge was only noted in three networks. The most common cross-class edges were STR–FIS, STR–TET and CHL–AZI, which each appeared in six subpopulations. Among the medically important resistances for iNTS, AXO was most frequently correlated with increased resistances to other β-lactams; AZI was linked to TET, CHL and CIP; CIP was most commonly linked to NAL and AZI; and COT had few links, with FIS being the most common.
Table 3. Summary of R-nets for NTS subpopulations, included StARS-selected penalty (λ), network size (m), network density ( $\bar m$) and the number of edges connecting resistances to drugs of the same class or between different classes (m matched and m cross, respectively), and the P value for χ 2 test (df = 1) comparing the proportions of matched-class edges present to cross-class edges present

Linear models
The linear models fit for the medically important resistances AXO, AZI and CIP showed various patterns (Tables 4–6, respectively). Instances where the vertex representing a medically important resistance was not adjacent to any other vertices, the linear model consisted only of the intercept; these models were omitted for brevity. The AXO linear models tended to have very high adjusted R 2 values (adj. R 2 > 0.9), many of the coefficients for other β-lactam resistances were significant, and several other coefficients for non-β-lactam MICs also appeared to be influential on AXO. The adjusted R 2 values in the linear models for AZI and CIP tended to be much lower, with a few exceptions.
Table 4. Linear models of ceftriaxone resistance (AXO) given R s and adjusted R 2 statistics
Subpopulations in which AXO was not adjacent to other resistances are omitted for brevity.
*P < 0.05.
Table 5. Linear models of azithromycin resistance (AZI) given R s and adjusted R 2 statistics

Subpopulations in which AZI was not adjacent to other resistances are omitted for brevity.
*P < 0.05.
Table 6. Linear models of ciprofloxacin resistance (CIP) given R s and adjusted R 2 statistics

Subpopulations in which CIP was not adjacent to other resistances are omitted for brevity.
*P < 0.05.
The Q–Q plots of the linear models’ standardised residuals are available in the Supplementary Materials (SF-1 through SF-23). Standardised residuals from the AXO linear models from the subpopulations CaDub, CaTyp, ChHei, ChTyp, TuHad and TuHei showed the expected quantile distribution, while models from CaMon, ChEnt and ChKen had a large number of standardised residuals that fell outside the expected normal distribution. All of the Q–Q plots for the AZI linear models showed standardised residuals with substantial deviation from the expected distribution. The residuals for the CIP models generally conformed well to the expected normal distribution. The violations of the normality assumption, where they occurred, tended to occur in the tails and led more than 5% of the standardised residuals to fall outside of the (−2, 2) interval.
The coefficients for NAL in the linear models for log2(CIP) were significant when they were included. Other coefficients in the CIP models tended to be small and only AZI in Enteritidis from chicken was significant and had a significant coefficient of meaningful size (β AZI = 0.36, 28% increase in CIP when AZI doubles, P < 0.005).
Discussion
The R-nets presented provide insights about collateral resistance patterns in 10 subpopulations of seven serotypes from four food animal species in the NARMS study. The R-nets demonstrated a variety of patterns and densities across the subpopulations. The range of penalties selected by the StARS method, 0.1 ⩽ λ ⩽ 0.3, was similar to the penalty selected in a previous study [Reference Love2]. While MRF density is a function of λ,  $\bar m$ and λ were not significantly correlated across serotypes (ρ = 0.11, P = 0.77), so differences in R s could be attributable to other characteristics of the subpopulations.
The R-net for S. enteritidis in chickens was very sparse, containing only 12 edges. Salmonella enteritidis is a clonal serotype with little genetic variability and isolates are typically pansusceptible [Reference Olson33–Reference Sukhnanand35]. The minimal genetic variation in this population is likely responsible for the low standard deviations in Enteritidis isolates log2(MIC) values, which in turn limited the covariance between the traits. Hence, the sparse structure of R ChEnt is likely the product of the serotype's clonal population.
Other networks, e.g. R ChKen, R TuHad and R ChHeid, had larger log2(MIC) standard deviations, but were still relatively sparse ( $\bar m$ < 0.25) due to few non-zero partial correlations. The sparsity indicates that the phenotypical resistances in these subpopulations tend to be conditionally independent, instead of simply lacking genetic variation. The edges in these R-nets were disproportionately matched-class edges (Fisher's P < 0.01) which could be attributable to cross-resistance from common genes. For example, β-lactam resistance genes, such as bla TEM1 or bla CMY-2, provide cross-resistance to multiple β-lactam drugs, leading to denser R BL subgraphs. Otherwise, the co-resistances that require inheritance of multiple genes providing resistance to drugs of different classes are uncommon in these subpopulations.
The densest R-nets, R CaDub and R CaTyp, had large MIC standard deviations and large partial correlations among the phenotypical resistances. These subpopulations have the highest risk of indirect selection producing multiple increased phenotypical resistances in response to exposure to a single drug. The risk of selecting for MDR isolates of serotype Dublin is of particular concern due to its high invasive index [Reference Jones15, Reference Lanridge16]. The prevalence of other dense networks, R CaMon and R SwAna, had much lower resistance prevalence, demonstrating that the resistance defined by breakpoints may not be a sensitive metric for identifying correlated phenotypical traits. The high density of the R-nets in the serotypes from cattle, particularly R CaDub and R CaTyp, indicate that these are the serotypes most likely to evolve MDR phenotypes via indirect selection, though this is certainly not the only mechanism that could lead to MDR selection in these subpopulations. These networks had high densities despite relatively high penalties (λ s ⩾ 0.25).
It is not clear why these serotypes in cattle had denser networks, but some hypotheses can be made. Antimicrobials belonging to several classes included in the susceptibility panels, including aminopenicillins, third-generation cephalosporins, sulfonamides and tetracyclines, are used to treat diarrhoea and respiratory disease in beef and dairy cattle and mastitis in dairy cows. The variety of therapeutic antimicrobial drugs used generate a spectrum of selection pressures which in turn may play some role in the evolution of the correlated phenotypical resistances. Another explanation could be that beef and dairy cattle tend to be harvested at older ages than the other production animal species, allowing individuals more opportunities to receive therapeutic antimicrobials and more time for Salmonella to exchange genetic material with other organisms in the environment. Since the NARMS data combine isolates of both beef and dairy cattle into a single category, the correlations seen could also be confounded by differences in production systems, but this is unlikely given the extensive correlations.
The induced subgraph R βL represents broad resistance to β-lactam drugs, and as expected R βL was particularly dense, with  $\bar m_{\beta {\rm L}} $ ⩾ 80% in all R s except R ChEnt and R SwAna. The prevalence of isolates fully β-lactam-resistant isolates exceeded 25% prevalence in only four of the 10 subpopulations (Table 7). The networks based on continuous MICs may be more sensitive for detecting clusters correlated resistances. The induced subgraph R ACSSuT represents the co-resistance set expected with the DT104 integron. Generally, this subgraph was less dense than R βL in all subpopulations, with only R CaDub and R CaTyp having $\bar m_{{\rm ACSSuT}} $ > 50% density. The prevalence of ACSSuT isolates was also uncommon except in cattle isolates of Typhimurium (40.4%) and Dublin (51.0%).
Table 7. Comparison of prevalence of β-lactam pan-resistant isolates and the corresponding induced subgraph (m βL) and of prevalence of ACSSuT phenotype and the corresponding induced subgraph

The consistency of the AZI–CHL edge in the R-nets may indicate that phenotypical chloramphenicol resistance may be an important source of collateral selection for phenotypical azithromycin resistance in chickens, poultry and swine, but the edge did not appear in NTS subpopulations from cattle. The adjusted partial R 2 statistics for CHL, when present, were the higher than any other predictors but these estimates may not be reliable since the AZI models generally showed violations of the normality assumption for parametric linear models. However, in both cases, there appears to be a possibly influential effect. While chloramphenicol is not used in food animal production in the USA, florfenicol is licensed for use in these species. The phenicol-specific efflux pump floR provides cross-resistance to both chloramphenicol and florfenicol in S. enterica [Reference Bolton36]. Even if the co-resistance between chloramphenicol and azithromycin does not push latter above the epidemiologic cut point, selection of higher AZI values increases the likelihood that additional mutations or genetic exchanges will result in isolates resistant to azithromycin.
Phenotypical ceftriaxone resistance was found to be strongly correlated with other β-lactam resistances. A number of molecular mechanisms can provide cross-resistance to multiple β-lactam drugs, but the collateral resistances here may be more likely attributable to penicillin-binding protein mutations than extended spectrum β-lactamases (ESBLs) [Reference Paterson and Bonomo37]. Genes for ESBLs will increase AXO but will not increase AMC since ESBLs are inactivated by clavulanic acid. Cross-tabulation of AXO and AMC showed that elevated AXO values only occurred in isolates with elevated AMC, indicating the mechanisms increasing AXO in these isolates were not inactivated by clavulanic acid. Other possible explanations for these results include the presence of β-lactamases that are not inactivated by clavulanic acid, e.g. CMY-2, or the presence of other resistance mechanisms insensitive to clavulanic acid in addition to ESBLs [Reference Bauernfeind38]. Cross-class edges associated with AXO were varied. From the linear models where the Q–Q plots suggested the models’ residuals were normally distributed, the cross-class terms associated with increased AXO were COT in R TuHei (β COT = 0.18, P = 0.01), KAN in R TuHad (β KAN = 0.19, P < 0.005) and GEN in R CaDub (β GEN = 0.08, P = 0.03), hence the use of trimethoprim-sulfamethoxazole and aminoglycosides may select for increased ceftriaxone MICs in non-typhoidal Salmonella isolates in cattle and poultry. The large adjusted R 2 values for the AXO linear models could indicate that indirect selection may be an important factor in maintaining ceftriaxone resistance in these NTS serotypes.
Ciprofloxacin resistance was most frequently correlated with NAL, the other quinolone antibiotic in the panel, and typically conditionally independently of other resistances. The CIP model for R SwAna was difficult to interpret: as previously discussed CIP was highly connected in the network, but only one coefficient was significant (β NAL = 1.18, P < 0.005). This could be attributed to low statistic power due the limited sample size (n SwAna = 84) or the limited range of CIP values. Overall, given the small number of isolates with CIP near or exceeding its breakpoint and weak or absent edges with other resistances, indirect selection for ciprofloxacin resistance does not appear to be a major concern.
In multiple instances, vertices had one or more edges even though no isolates had MIC values that met or exceeded clinical breakpoints. Also, R ChHei and R CaMon had relatively high densities but resistance was infrequent. In these examples, the correlations are being driven by the variation in MICs below defined breakpoints, which has several important implications. Had network topology been estimated using dichotomised MICs results, i.e. MICs interpreted as sensitive or resistant, susceptibilities with monotonically sensitive responses would have variances equal to zero. In turn, these transformations resulting in monotonic variables would have undefined covariances and correlations with other traits. These cases highlight the value of estimating the network structures from continuous MICs, instead of the more clinically useful dichotomised MICs results. In particular, correlations between AZI and other resistances are concerning, despite finding only one isolate in any subpopulation to be azithromycin-resistant since selection for higher AZI values increases the likelihood of later genetic changes leading to resistance to azithromycin.
The density of the induced subgraphs for the ACSSuT resistances aligned well with the frequency of the ACSSuT resistance phenotype. Cattle isolates of Typhimurium and Dublin most frequently demonstrated this five-way resistant phenotype (40% and 51%, respectively) and had the densest subgraphs (90% and 70%, respectively). The penta-resistant phenotype was much less common in the other serotypes, which also had four or fewer edges in the corresponding subgraph. Several serotypes had intermediate subgraph densities and very few penta-resistant isolates. In these serotypes, one or more AMR traits, typically chloramphenicol, had substantial covariance to detect an edge but the high values did not meet or exceed the breakpoints. This demonstrates that the R-nets are able to detect AMR patterns, even if not all resistance traits exceed the clinical breakpoints. A future research objective is to identify dense-induced subgraphs that represent important AMR patterns via algorithms such as CODENSE [Reference Hu39].
The linear models provide a convenient method to parameterise the observed MICs in the collateral resistances. The networks and linear models provide complementary information: the graphical models provide a holistic view of population, while the linear models focus on medically important phenotypical resistance traits. General linear models are more likely familiar to many researchers. The β coefficients are not influenced by the L 1 penalisation and are therefore more comparable between models. On the other hand, many of the Q–Q plots showed that the linear models’ residuals were not normally distributed, indicating the models’ parameter estimates and P-values may not be reliable [Reference Anscombe40]. The terms in the linear models were selected based on the networks’ structures, and several coefficients were small (β < 0.10, 7% increase in MIC) and were not significant (P > 0.05). With some exceptions, the corresponding partial correlations were also relatively weak (|ω ij| < 0.10), but it is difficult to interpret the |ω ij| since these values were biased toward 0 as a result of the penalisation. This is consistent with the StARS method's strategy to identify a superset of edges that is likely to contain all important edges in graph, at the expense of including some that are unimportant. Another possible cause of the disagreement between the linear and network models is that the former assumes a linear relationship between log2(MIC) values and the latter is built on non-parametric rank correlations without specified relationships. Evaluation of model fit in this case, including interpretation of P values, is difficult because the fit is assessed using the same data used to select the model [Reference Fithian, Sun and Taylor41]. Ideally, separate datasets would be used to select the model and assess the model's fit, but this approach was not feasible due to the limited sample size for many of the subpopulations. The small sample size of some subpopulations, such as TuHei (n s = 82) and SwAna (n s = 84), may be sensitive to a small number of isolates with high influence, producing less robust estimated correlation matrices. However, unlike more ordinary least squares methods that rely on hypothesis testing model selection using the graphical LASSO is not driven by estimated standard errors and is independent of sample size, it is unlikely the results have problem with underfitting. This property of the graphical LASSO is also what allows estimation where n s < m max, which would not be possible using ordinary least squares methods.
The results of the current study are largely consistent with what is currently understood about these AMR traits in NTS. However, the quantitative approach used here provides a more formal method for studying collateral resistance in these subpopulations and other bacterial populations. The methods applied to the current study allow the network structures and the pair-wise effect measures to be estimated with minimal oversight. Knowledge about the aetiologic agents and their genetics is critical for the interpretation of the networks produced, but this is similarly true for the interpretation of any statistic model.
Conclusions
The R-nets generated in the current study provide an initial screening for important collateral resistances in 10 subpopulations of NTS organisms from animal sources. Due to the density and strength of the R-net edges in the isolates from cattle, these appeared to have the greatest potential for selection of multiple resistance traits from individual antibiotic use. The partial correlations used in the network models estimated the consistency of MIC relationships, and the linear models provided a deeper evaluation of the collateral resistances of interest. The secondary linear models provide estimates of collateral resistance strength, though the assumptions of linear relationships and normally distributed data underlying parametric regression may not be met. Resistance to azithromycin was linked with chloramphenicol resistance in 6/10 of the R-nets, and may be influenced by the use of florfenicol in relevant species. Ceftriaxone resistance appeared to be most impacted by the use of other β-lactams, though trimethoprim-sulfamethoxazole, streptomycin and kanamycin may select for increased AXO in some cases. Resistance to ciprofloxacin did not appear to be correlated with other resistance traits outside of nalidixic acid, which is not used in food animal medicine. The R-nets are a useful method for studying and monitoring collateral resistances in pathogen populations using data currently produced by AMR surveillance systems.
Supplementary material
The supplementary material for this article can be found at https://doi.org/10.1017/S0950268818000833
Conflict of Interest
None.
Ethical standards
The current work involves no human or laboratory animal experimentation. The authors assert that all procedures contributing to this work comply with the ethical standards of the relevant national and institutional committees.


