INTRODUCTION
Dengue fever (DF) has been known from antiquity and is still a major global public health concern. The disease, which can be caused by four distinct dengue viruses, is transmitted by Aedes mosquitoes [Reference Gubler1] and is epidemic in more than 100 countries. DF is now the fastest spreading mosquito-borne disease in the world, and in the past 50 years, case incidence has multiplied 30-fold, with about 30–54·7% of the world's population (2·05–3·74 billion) now living in areas where dengue viruses can be transmitted [Reference Brady2].
In 1978, a sudden outbreak of DF occurred in Foshan City, Guangdong Province after an absence of 30 years. Since then, Hainan, Guangxi, Fujian, Yunnan and Zhejiang have all reported DF outbreaks [Reference Lu3]. Guangdong Province has had the highest DF incidence in mainland China during the past decades, accounting for more than 65% of all cases in the country [Reference Liu4]. However, the incidences in the counties within Guangdong is not homogenous [Reference Liu4]. A better understanding of the spatial pattern of DF would help to identify high-risk areas and might assist in the development of DF control and prevention strategies in the province.
Meteorological factors can influence the lifespan, breeding, survival, and population dynamics of the vector mosquitoes both directly and/or indirectly. Studies have shown that meteorological factors, including rainfall, temperature, and relative humidity, are important environmental factors that could influence the transmission dynamics of DF. El Niño/Southern Oscillation (ENSO) is a significant index of quasi-periodic climate pattern, which affects most countries in the Pacific and Indian Oceans. The Southern Oscillation Index (SOI), the atmospheric component of El Niño, is defined as the normalized difference in atmospheric pressure between Darwin (Australia) and Tahiti (French Polynesia). In Guangdong Province, negative SOI values are associated with El Niño conditions (dry and warm), and positive SOI values with La Niña conditions (wet and cool). Other studies have linked the SOI to the risk of DF transmission [Reference Descloux5]. The use of geographical information systems (GIS) with spatial statistics, including spatial smoothing and autocorrelation analysis, has been increasingly applied to infectious diseases, especially zoonoses and vector-borne diseases over recent years [Reference Lin6–Reference Lu, Lin and Liu9]. In this study, we explored the spatial pattern of DF transmission in Guangdong Province from 2005 to 2011 with the aim of identifying the high-risk areas of DF transmission, to provide a basis for dengue control and prevention measures. We further examined the short-term effect of meteorological factors and SOI on DF epidemics to assess their ability to predict dengue outbreaks.
MATERIALS AND METHODS
Setting
Guangdong Province is located in southeastern China (20° 12′ N, 25° 31′ N, 109° 45′ E, 109° 45′ E) as showed in Figure 1. The province comprises 21 prefecture-level cities and 122 counties with a total land area of 179 800 km2 and a population of about 104 303 132 according to the national census in 2010. Guangdong has a subtropical climate influenced by the Asian monsoon, with an annual average temperature of 19–24°C. The summer is wet with temperatures between 28 and 29°C in July, while the winter is usually mild, dry and sunny with temperatures between 16 and 19°C in January. The average annual rainfall in the study area was between 1300 and 2100 mm and the humidity was between 69% and 83%.
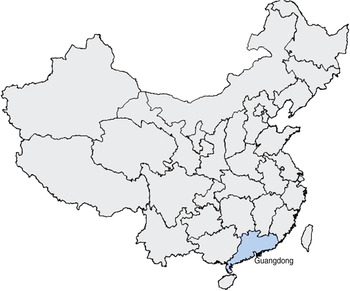
Fig. 1 [colour online]. Location of Guangdong Province in China.
Materials
Records of DF cases in Guangdong Province between 2005 and 2011 were obtained from the National Notifiable Disease Surveillance System. Blood samples from all DF patients' were collected in hospitals and sent for diagnostic confirmation to the laboratory of Guangdong Provincial Center for Disease Control and Prevention. Demographic data were obtained from the Guangdong Statistical Yearbook.
To conduct a GIS-based analysis on the spatial distribution of DF cases, the county-level polygon map at 1:250 000 scale was obtained from Data Sharing Infrastructure of Earth System Science (www.geodata.cn), on which a county-level layer containing information regarding latitudes and longitudes of central points of each county was created. All DF cases were geocoded and matched to the county-level layers of polygon and point by administrative codes using ArcGIS 10.0 software (ESRI, USA).
Daily meteorological data, including mean temperature, maximum temperature, minimum temperature, relative humidity, rainfall, atmospheric pressure and SOI from 2005 to 2011, were retrieved from the China Meteorological Data Sharing Service System (http://cdc.cma.gov.cn/index.jsp) and the website of the Australian Bureau of Meteorology (http://www.bom.gov.au/).
GIS mapping and spatial analysis
To manage variations of incidence in small populations and areas, the annual average incidences of DF per 100 000 in each county over the 7-year period were calculated, and spatial rate smoothing was implemented. Based on the overall annual average incidence (2·5/100 000), all counties were grouped into four categories [Reference Lu, Lin and Liu9]: non-epidemic areas, low epidemic areas with annual average incidence between 0 and 2/100 000 persons, medium epidemic areas with an incidence between 2 and 4/100 000 persons, and high epidemic areas with an incidence >4/100 000 persons. The counties were coloir-coded according to the epidemic level. To assess the risk of DF in each county, an excess risk map was produced. The excess risk was defined as the ratio of the observed incidence at each county divided by the average incidence. The average incidence of the whole province was calculated as the number of cases in the province divided by the total population at risk [Reference Yi10].
Global spatial autocorrelation analysis was performed in GeoDa095i software. Moran's I, spatial autocorrelation statistic was calculated and visualized in the form of a Moran scatter plot. First, a contiguity-based spatial weight was constructed for each county by creating a rook contiguity weights file. Second, Moran's scatter plot was produced with a spatial lag of incidence on the vertical axis and a standardized incidence on the horizontal axis. The number of permutation tests was set to 999 and the pseudo-significance level was set at 0·01.
Time-stratified case-crossover analysis
A time-stratified case-crossover model was utilized to examine the short-term association of daily DF with daily meteorological factors (including temperature, relative humidity, precipitation, and atmospheric pressure) and SOI. This design compares the exposure in the case period when events occurred with the exposures in nearby control periods to determine the differences in exposure that might explain the differences in the daily number of DF cases [Reference Maclure11, Reference Maclure12]. In the present study, the case and control periods were matched by day of the week in order to control for any weekly patterns of DF cases or weather variables. Control periods were compared with cases using the time-stratified method with 28 days strata [Reference Guo13]. Such a time-stratified case-crossover study design ensured that each case day had three matching control days to avoid an overlap bias in the risk estimation [Reference Whitaker, Hocine and Farrington14]. For this study, the first stratum was 1–28 January 2005, and the second was 29 January to 25 February 2005; for a DF case on 28 January 2005, the control days were 7, 14 and 21 January 2005. The case-crossover method inherently controls for any long-term trends and seasonal patterns of disease and explanatory variables, and individual characteristics such as age, sex, and educational level [Reference Bateson and Schwartz15]. Studies have demonstrated that the time-stratified case-crossover analysis provides unbiased estimates in the presence of strong seasonal confounding [Reference Forastiere16, Reference Guo17]. Here, public holidays (as a binary variable) were included in all models as a potential confounding factor. We did univariate and multivariate models, only two weather variables were included in one model. We also performed analysis to include all the weather variables in one model. We estimated the linear effect of the meteorological factors according to different lag structures including the current day (lag 0) up to 3 days prior (lag 3). Results of the analysis were expressed as excess risk (ER) of DF based on a one-unit increase in the weather variables. ER was calculated using the formula: ER = (OR − 1) × 100%, where OR (odds ratio) was obtained through the conditional logistic regression model. All statistical tests were two-sided. The ‘season’ package of R version 2.14.1 (R Foundation, Austria) was used to fit the time-stratified case-crossover model.
RESULTS
Spatial distribution of DF in Guangdong Province
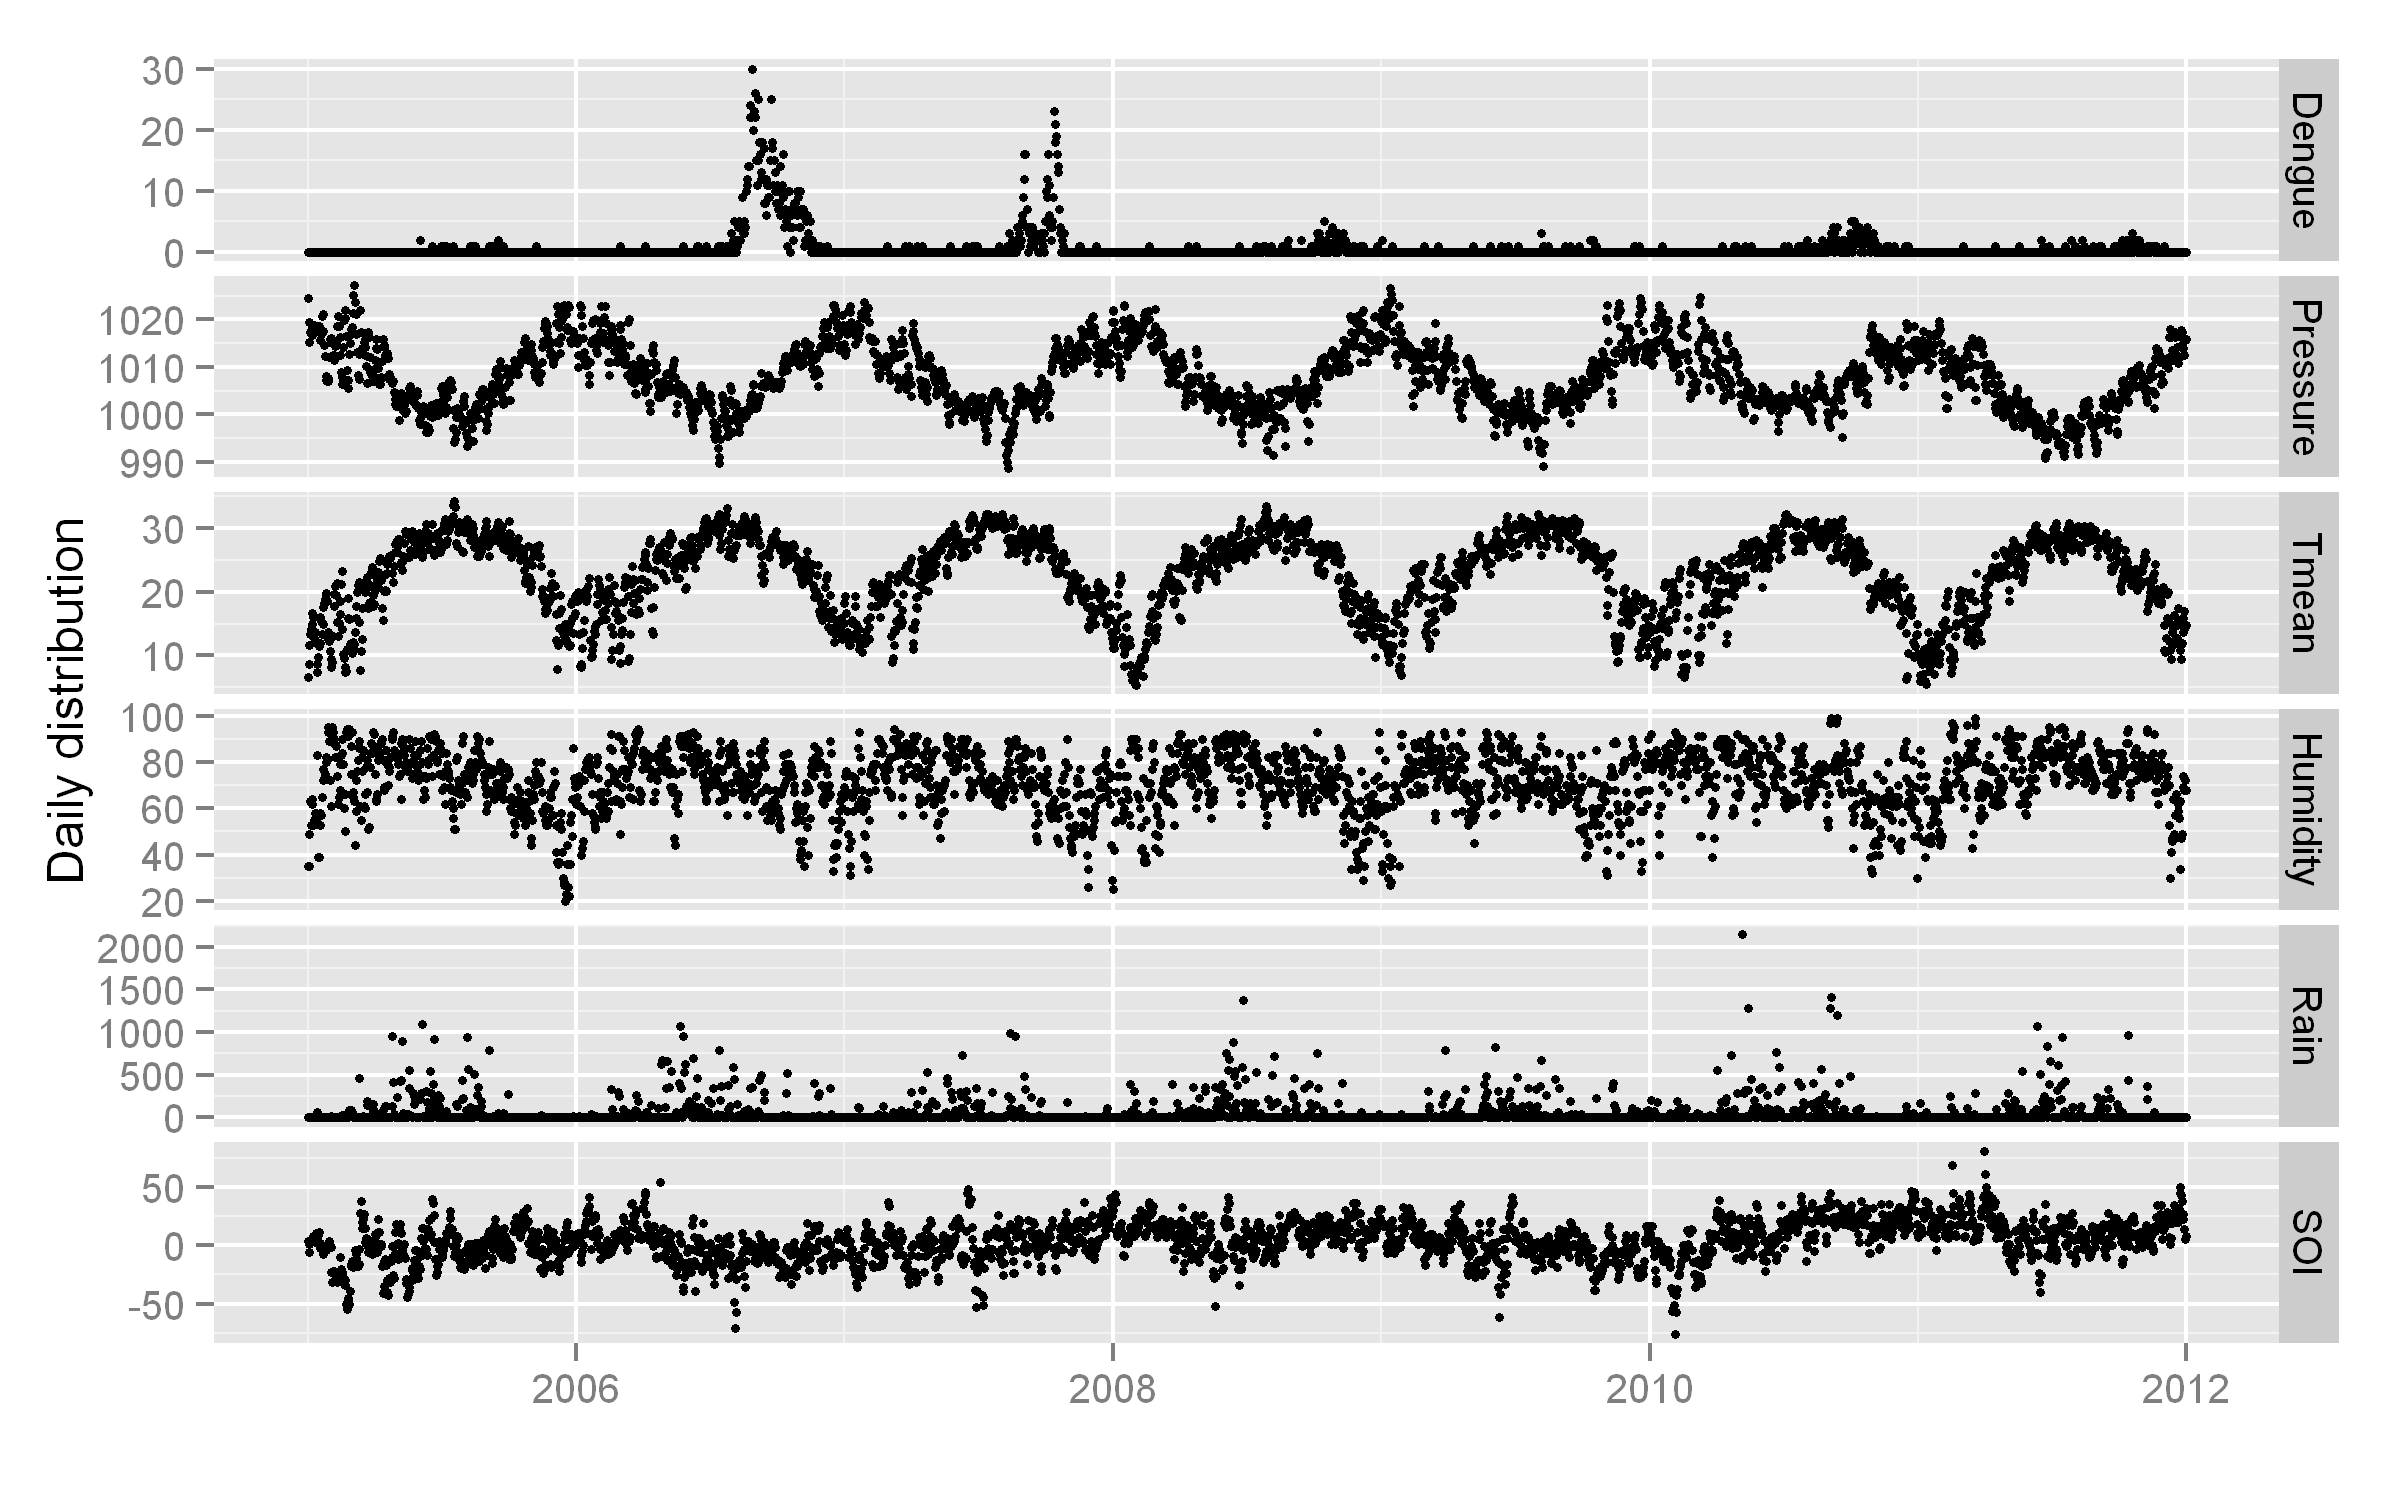
There were 1709 DF cases reported in Guangdong Province during 2005–2011. The time series of daily DF cases and key meteorological variables are depicted in Supplementary Figure S1 (available online). There were seasonal patterns in these variables. Annual average incidences at the county level ranged from 0 to 8·07/100 000. High-epidemic DF areas were mainly restricted to the Pearl River Delta region and Han River Delta region, the DF incidences of the counties in these two areas were 2–4/100 000 persons or more than 4/100 000 persons (Fig. 2).

Fig. 2. Annual average incidence of dengue fever in the counties in Guangdong Province, China, 2005–2011.
Figure 3 shows the risk map of DF, where the ER is defined as a ratio of the observed number divided by the expected number of DF cases. Counties in light grey had lower incidences than expected, with risk ratios <1. In contrast, counties in dark grey to black shading had incidences higher than expected or risk ratios >1.

Fig. 3. Risk map of dengue fever at the county level in Guangdong Province, China, 2005–2011.
Spatial autocorrelation of DF in Guangdong Province
A Moran scatter plot was created and a significance assessment through a permutation test was implemented by global spatial autocorrelation analysis for annualized average incidence of DF (Fig. 4). The number listed on the top of the graph (0·2433) is Moran's I statistic (Fig. 4 a), and a histogram was generated by performing the significance assessment of Moran's I statistic (Fig. 4 b). The brown part is the reference distribution and the yellow bar is the statistic (Fig. 4 b). In addition the number of permutations (n = 999) and the preudo-significance level (0·002) were also listed in the upper left corner, as well as the value of the statistic (0·2433), its expected mean [E(I) = 0·0083], and the mean and standard deviation of the empirical distribution were −0·0057 and 0·0494 (as shown at the bottom of Fig. 4 b). The statistic was significant for Moran's I at a level of 0·01. Spatial autocorrelation analysis for annualized incidence of DF in Guangdong Province from 2005 to 2011 showed that Moran's I was significant from 2005 to 2006 and from 2009 to 2011, but not significant in 2007 and 2008 (Table 1).

Fig. 4. Global spatial autocorrelation analysis for annualized average incidence of dengue fever (DF) in Guangdong Province, China, 2005–2011. (a) The Moran's scatter plot for annualized average incidence of DF. (b) Histogram for significance assessment of Moran's I.
Table 1. Spatial autocorrelation analysis of annual average incidences of dengue fever in Guangdong Province, 2005–2011
The association between DF and meteorological factors
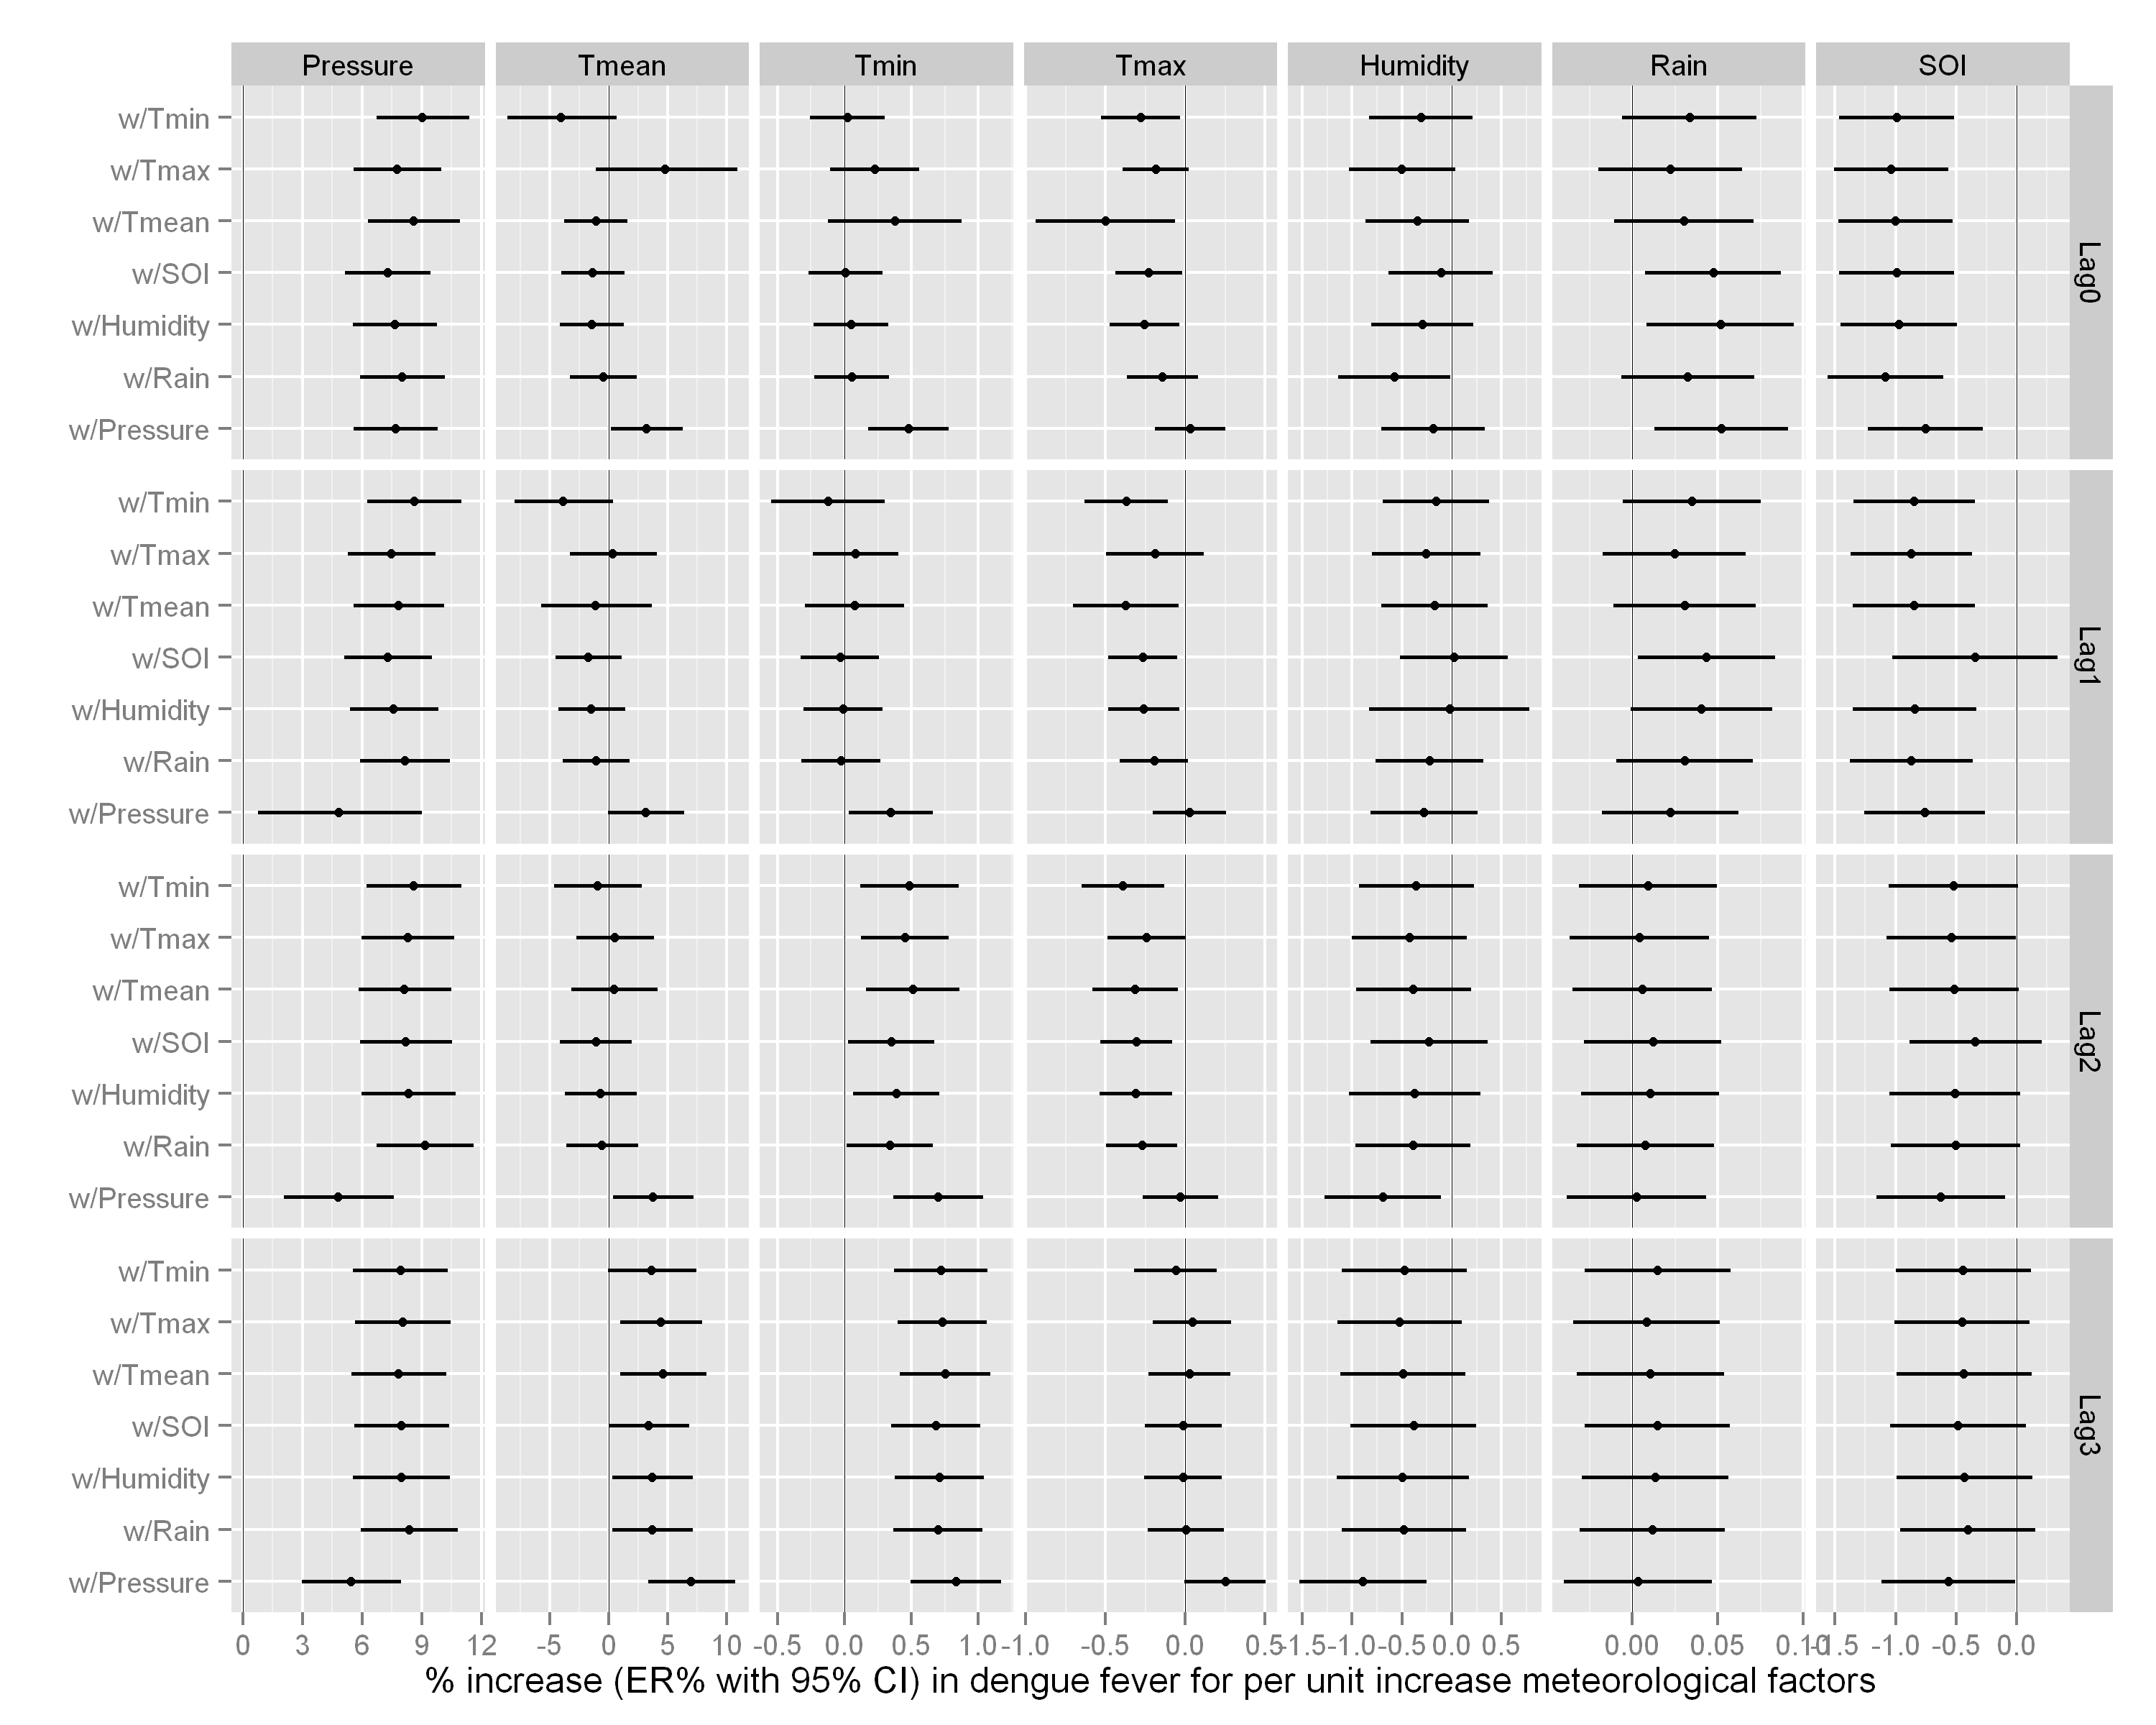
Figure 5 illustrates the results of the time-stratified case-crossover analyses. In the figure, w/Tmin on the y-axis means that the minimum temperature was controlled for in the model. However, when one weather variable was controlled in the model of the same variable, it was the result of univariate model for that variable. It was found that atmospheric pressure (at lag 0–3 days) was associated with increased DF risk in both single- and two-factor analyses, and the ER appeared to be larger when other meteorological factors were controlled for. Daily mean and minimum temperatures have delayed effects on DF with lags of 3 and 2 days, respectively. Daily maximum temperature was associated with decreased DF risk at a lag of 0–2 days, and this effect persisted when other meteorological factors were included. The SOI was found to be associated with decreased DF at lags of 0–1 days. Corresponding ERs were 7·68 [95% confidence interval (CI) 5·58–9·83] per 1 hPa increase in atmospheric pressure on the current day, 6·99 (95% CI 3·38–10·74) for a 1°C increase in daily mean temperature after controlling for pressure at a lag of 3 days, 0·83 (95% CI 0·50–1·17) for a 1°C degree increase in daily minimum temperature after controlling for pressure at a lag of 3 days, −0·50 (95% CI −0·94 to −0·06) for a 1°C increase in daily maximum temperature after controlling for mean temperature on the current day, and −0·99 (95% CI −1·46 to −0·52) for a one-unit increase in SOI on the current day, respectively. No significant association was observed for relative humidity and rainfall in the results. When all the weather variables were included in one model, a similar result was produced.

Fig. 5. The association between dengue fever and meteorological factors in Guangdong Province, China, 2005–2011. On the y-axis, w/Tmin means that minimum temperature was controlled for. Lag on the right y-axis was the effect estimation on different lag days.
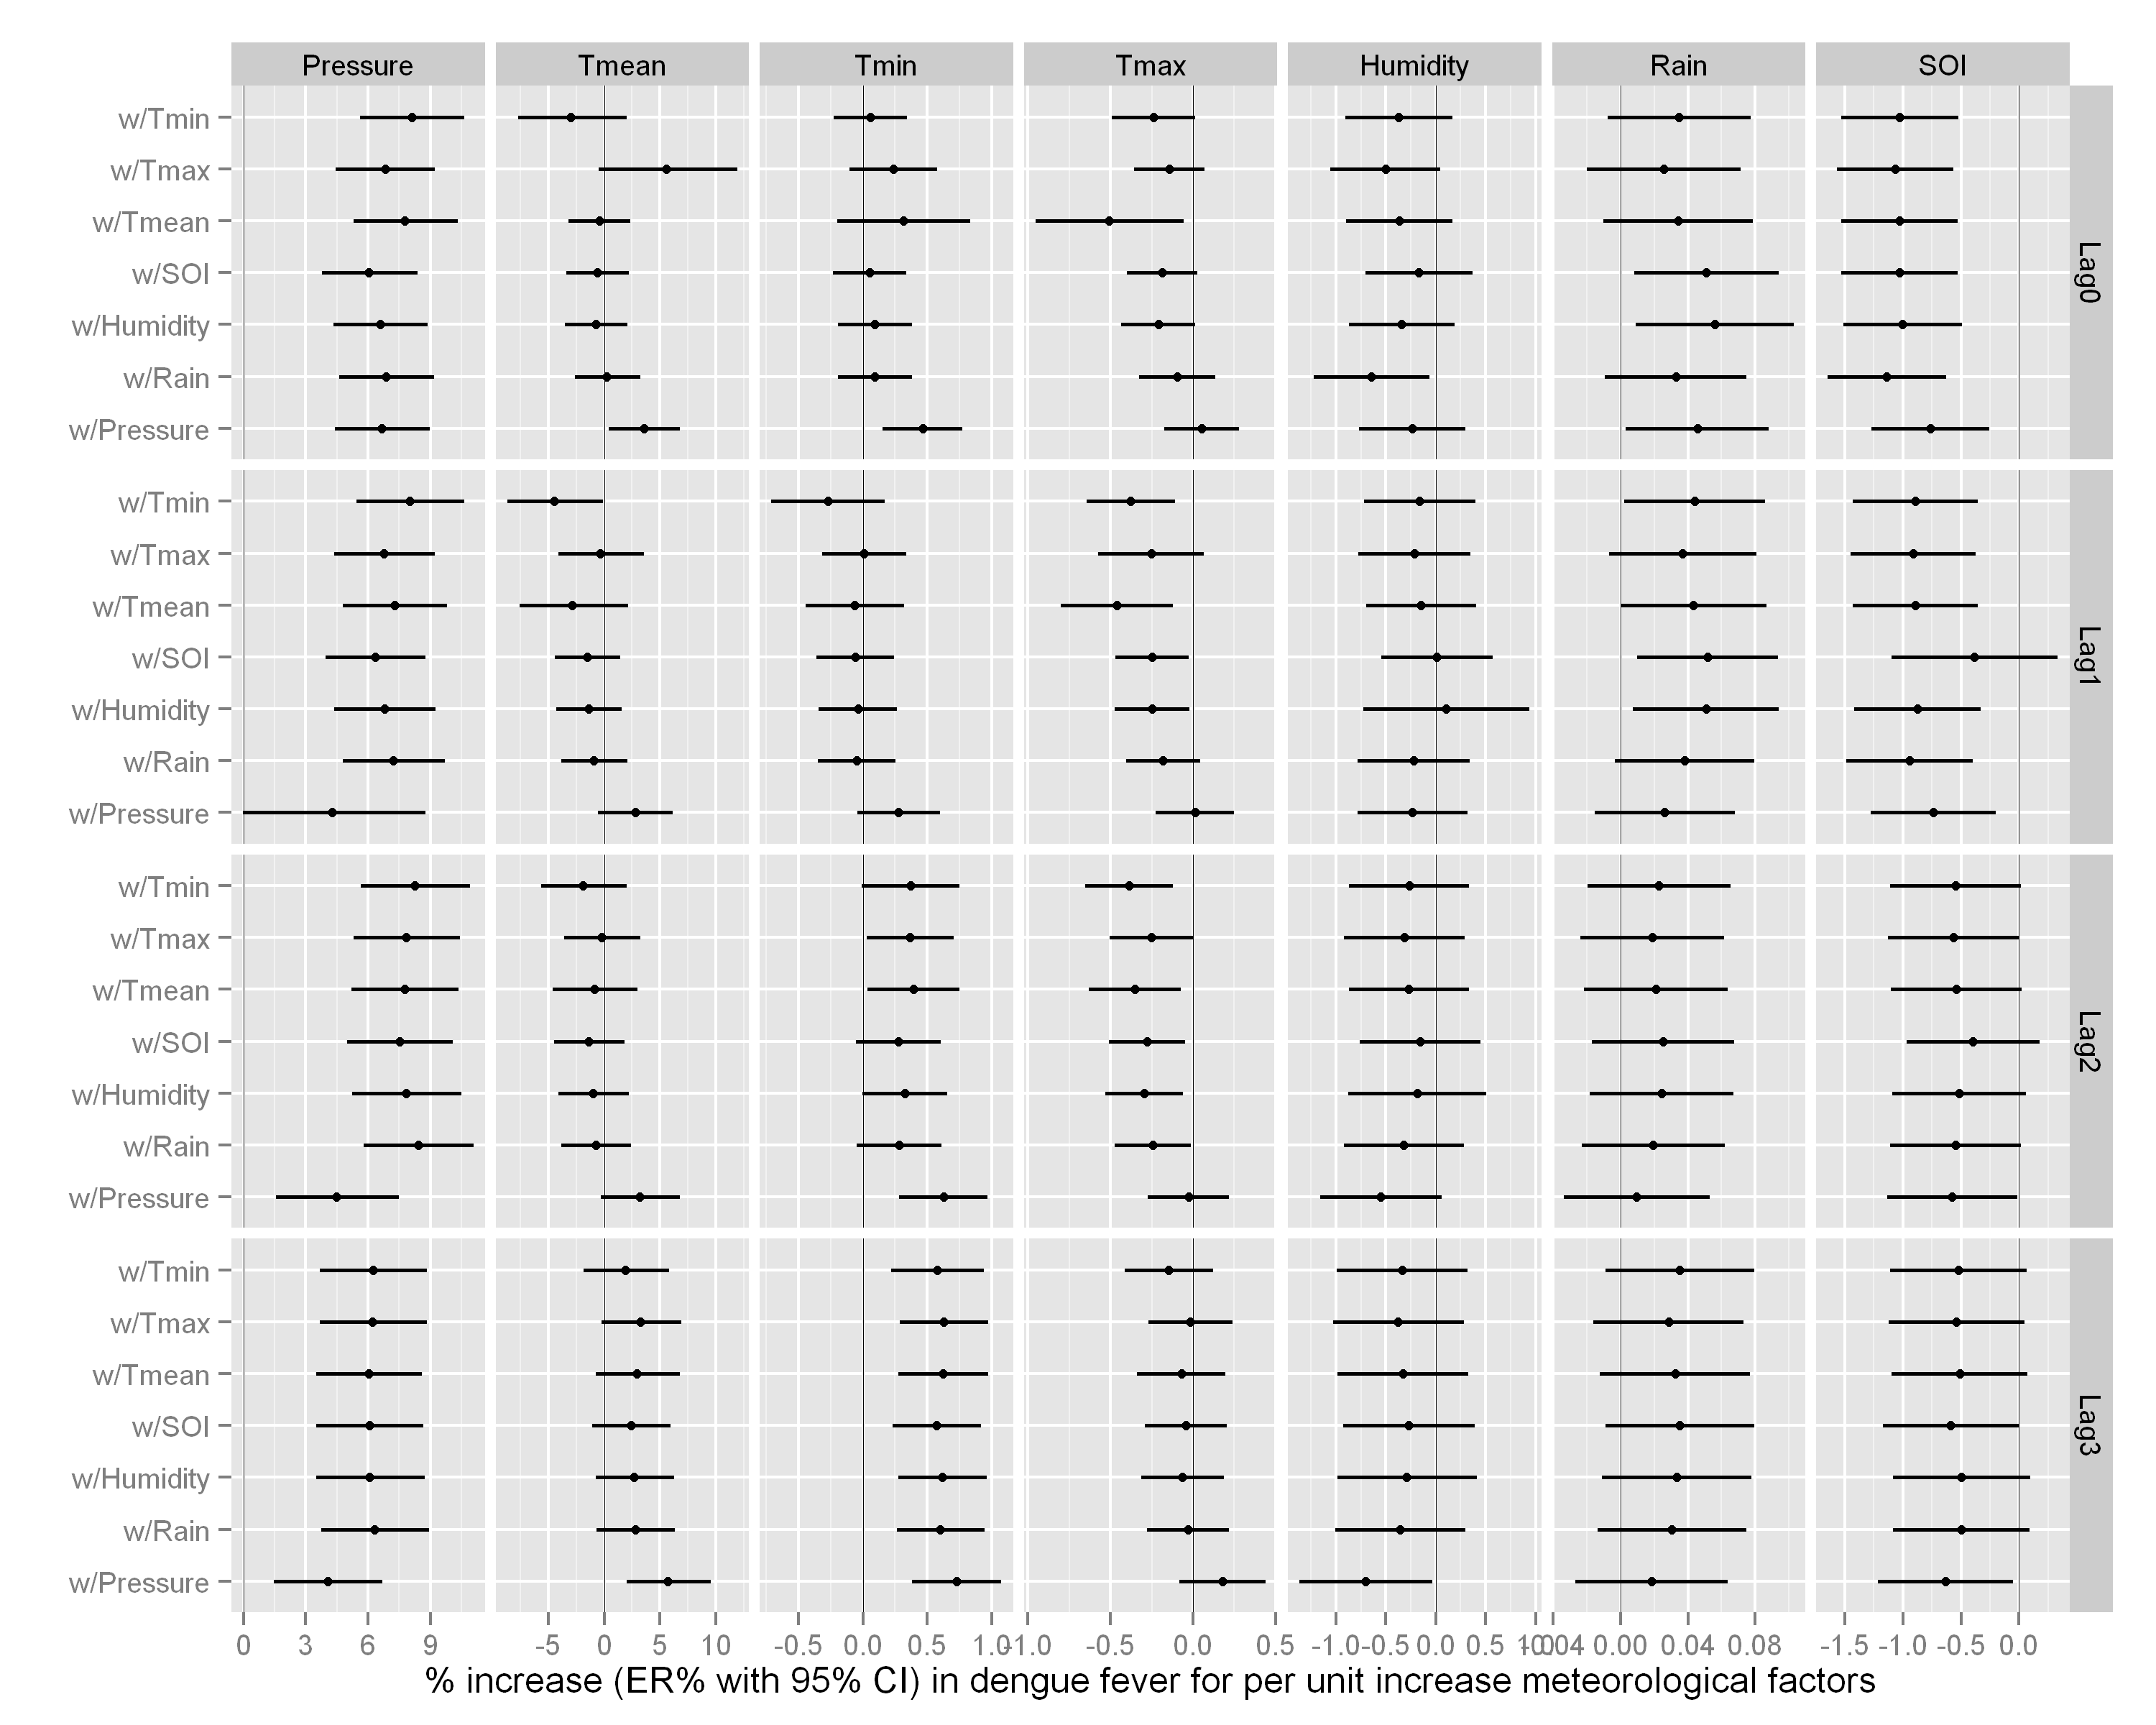
In the sensitivity analysis, we conducted a time-stratified case-crossover study for the high-risk areas of the Pearl River Delta and Han River Delta regions, separately, which yielded similar results with that of the whole province (Supplementary Figs S2 and S3).
DISCUSSION
In this study, both exploratory spatial analysis and case-crossover analysis of DF and meteorological factors were conducted in Guangdong Province. Our analyses demonstrated that spatial distribution of DF in the counties in Guangdong Province was non-random, and the high-epidemic areas were mainly restricted to the Pearl River Delta and Han River Delta regions. From the analysis of the association between DF and meteorological factors, we found that atmospheric pressure (at lags of 0–3 days) and daily mean and minimum temperatures with 2- to 3-day lags were statistically significantly and positively associated with DF, while daily maximum temperature (at lags of 0–2 days) and SOI (at lags of 0–2 days) were negatively associated with DF epidemics.
Since 2005, the high-epidemic areas of DF have been mainly restricted to the Pearl River Delta and Han River Delta regions, which is consistent with previous studies [Reference Liu4, Reference Yi10]. Efficient allocation of health resources in DF control and prevention programmes requires such accurate information on the geographical pattern of DF transmission. Thus, the results of this study may assist with the allocation of health resources more effectively and efficiently. According to the findings of this study, we suggest that more dengue control resources should be placed in the Pearl River Delta and Han River Delta regions. We identified areas of increased risk that are again located in the Pearl River Delta and Han River Delta regions (Fig. 3). Yi and colleagues [Reference Yi18] analysed the distribution pattern of Aedes mosquitoes in Guangdong Province, and found that both the Pearl River Delta and Han River Delta had higher Aedes mosquito density than other areas, which suggests that the high risk of DF in these two areas must be partly attributed to the high density of Aedes mosquitoes. Additionally, Guangdong is also the major source of labourers in South East Asia. As a result, many overseas Chinese communities had their origins in Guangdong. The residents in these regions keep close connections with South East Asian countries that are in the dengue-endemic regions. Imported dengue cases were believed to have been the cause of the outbreaks according to some studies [Reference Liu4]. Since 2000, frequent migration and rapid urbanization have emerged in Guangdong Province, especially in the Pearl River Delta and Han River Delta regions [Reference Wu19], which are the core economic region in the Province. Gubler [Reference Gubler20] predicted that if global trends of unprecedented population growth, continued globalization and unprecedented urbanization continue as projected, there will be continued increases in the severity, frequency, geographical distribution and magnitude of DF epidemics in the future. All these factors may contribute to the increased DF risk in the Pearl River Delta and Han River Delta regions. Preventing or reducing dengue virus transmission depends critically on the control of the mosquito vectors or interruption of human–mosquito contacts. At present, integrated vector management (IVM) is the strategic approach to mosquito control and dengue prevention promoted by the WHO [21], but an efficient long-term sustainable control programme is needed, which should combine a top-down and a bottom-up approach, including IVM, environmental improvements, climate and vector surveillance-based early warning system, planned population growth and controlled urbanization.
Spatial autocorrelation analysis showed that there was non-random spatial distribution of DF in Guangdong Province during the period 2005–2011. More specifically, by calculating Moran's I annually, our study showed that the distribution of DF from 2005 to 2006 and from 2009 to 2011 was non-random geographically, but in 2007 and 2008 distribution of cases appeared to be random. Fluctuation in population immunity plays a major role in dengue transmission, because the disease does not induce permanent immunity. The non-random and clustered distribution in Guangdong from 2005 to 2011 might be due to population immunity. Two major outbreaks in Guangdong Province occurred in 2002 and 2006, with more than 1000 cases each year, and the population immunity may have been maintained at a high level after the outbreaks. The distribution would therefore appear to occur randomly in the following years. Some studies have shown that both the incidence and geographical distribution of DF were related to environmental factors and climatic factors [Reference Lu3, Reference Wu19]. In the future it will be helpful to investigate the changes in these factors when DF distribution is non-random and random. This study provides baseline information on the geographical distribution of DF in Guangdong Province.
Previous studies have reported that meteorological factors are associated with dengue transmission [Reference Lu22, Reference Hu23]. The results of this study illustrated that vapour pressure, which is a measure of the actual water vapour content of the atmosphere, has a strong positive correlation with the incidence of DF in Guangdong Province. This finding was in accordance with studies in other areas. For example, on the Caribbean island of Barbados a positive relationship was found between vapour pressure and DF incidence at a lag of 6 weeks [Reference Depradine and Lovell24]. Hales and co-workers analysed climatic associations of global dengue outbreaks between 1975 and 1996, and found that the annual average vapour pressure was the most important individual predictor of DF distribution [Reference Hales25]. Higher atmospheric vapour pressure may favour the vector mosquitoes; under these conditions infected mosquitoes would feed more frequently or feed on multiple individuals, thereby increasing the transmission of the disease [Reference Depradine and Lovell24].
Daily mean and minimum temperatures were positively associated with DF incidence, while daily maximum temperature was inversely associated with DF incidence. Temperature has been shown to influence many vector-borne diseases [Reference Lin6, Reference Lin26], affecting both the survival time and habitats of the vector, and also their replication, maturation, and infective periods. Higher temperature was found to shorten the extrinsic incubation period and viral development rate, and increase the amount of infectious mosquitoes in the environment [Reference Watts27]. Correlation studies between climatic factors and the distribution of A. albopictus [Reference Wu28] showed that they breed in those areas where the annual mean temperature is above 11·8°C, the mean temperature in January was above 5·8°C, and the annual precipitation was above 500 mm [Reference Wu28]. When the atmospheric temperature is too low, dengue virus development slows down and the mosquito biting rate declines. According to a study by Hawley, the optimum temperature limits for A. albopictus range from 20 to 27°C, with a maximum temperature around 30°C [Reference Hawley29]. In laboratory studies survival rate started to decrease when the temperature rose above 28°C [Reference Delatte30]. Guangdong Province has a humid subtropical climate influenced mainly by the Asian monsoon. Summers are wet with high temperature and a high humidity index. Winters are mild, dry and sunny. The annual mean temperature ranges from 19 to 24°C; the annual maximum temperature ranges from 34·6 to 39·0°C. Therefore, as temperature increases to the optimum temperature for A. albopictus, particular dengue prevention measures should be implemented. When the temperatures rise above the optimum levels for the development and activity of adult mosquitoes, their survival will be adversely affected and risk of the disease is expected to decrease.
We did not find any significant relationship between humidity or rainfall and DF incidence at lags of 0–3 days in the present study, which was consistent with the findings of previous studies [Reference Lu22]. Kovats has suggested that rainfall could affect the breeding of mosquitoes but this might be less important in urban areas, as the vectors often breed in small containers, such as plant pots, which may contain water in the absence of rain [Reference Kovats31]. The distribution of DF in Guangdong Province was mainly concentrated in the developed urban areas, where public health facilities and drainage system were in good condition and rainfall had little impact on increasing breeding sites for mosquitoes. Optimal humidity conditions can increase mosquito survival significantly, although the lower limit of annual relative humidity (69%) was generally in winter, when the temperature was too low to transmit dengue virus. However, in the dengue epidemic season, the relative humidity was high enough to facilitate dengue transmission in Guangdong Province.
It has been suggested that the geographical expansion of DF throughout the world may be partly attributable to global climate change. The ENSO is a systematic pattern of global climate variability, affecting most countries in the Pacific and Indian Oceans [Reference Kovats32]. Our study found that ENSO was associated with dengue transmission risk in Guangdong Province. Furthermore, ENSO has been found to be related to various health outcomes, including waterborne infectious diseases, vector-borne disease and natural disaster-related deaths in other areas [Reference Hu33, Reference Lin34]. In Thailand, which does not have a strong ENSO signal, there was no correlation [Reference Hay35]. Alexandre [Reference Alexandre36] examined the relationship between dengue epidemics and ENSO across the Indonesian archipelago and northern South America [Reference Alexandre36], and found that there was a statistically significant correlation at the 95% confidence level between El Niño and dengue epidemics in French Guiana and Indonesia and at the 90% confidence level in Colombia and Surinam [Reference Alexandre36]. In Indonesia, which has a strong El Niño effect causing drought, dengue epidemics consistently occurred in the year after El Niño [Reference Kovats31]. Our study suggests that warmer temperatures (negative SOI values in Guangdong Province) were correlated with increased DF incidence. Hu stated the SOI was a regionally aggregated measure of climate variability, which associated with dengue risk [Reference Hu23]. Further studies are needed to improve the understanding of the mechanisms underlying these associations, and to assess the extent to which relationships between ENSO and dengue may be useful as a basis for an early warning system.
Our findings illustrate that spatial and temporal analysis of DF is useful for improving our understanding of the characteristics of this disease, and for generation of new hypotheses. In the meantime, further epidemiological and ecological studies are required to investigate the mechanisms of the observed association. Climate is not the only factor affecting DF transmission, environmental and socioeconomic factors, host–pathogen interactions and population immunological factors can all influence the dynamics of virus transmission [37]. Although climate factors could directly influence the breeding and survival of the mosquito vectors and thereby affect their abundance and distribution. Climate is therefore an important predictor of vector-borne disease epidemics, and regional climate changes may drive an increase in transmission in larger, more populated area.
There are certain limitations to this study. First, the use of passive surveillance data might have introduced measurement and information biases. For example, including individuals who were infected with DF but experienced only sub-clinical symptoms and did not seek medical treatment might have led to under-reporting [Reference Mackenzie38]. Second, the incidence of DF has been rising worldwide in recent decades. This is probably related to global trends such as population growth, urbanization, weakening of public health infrastructure, and climate change not measured here. Third, more information on the community- and individual-level risk factors (e.g. mosquito population dynamic, health education frequency, individual behaviours and awareness) is required because these might be confounding factors between socio-ecological characteristics and DF transmission [Reference Hu39]. Therefore, future attempts to study the relationship between dengue and meteorological factors should consider collecting and analysing more data on entomological and eco-health variables. Finally, some studies have suggested that the time-stratified case-crossover study design could suffer severe bias from residual seasonality [Reference Whitaker, Hocine and Farrington14], in this study, we did perform a sensitivity analysis using a generalized additive model, which yields a generally similar estimation, suggesting that the seasonal residual bias in this analysis was not a serious drawback.
The findings of this study may have significant implications for the development of strategic plans to control and prevent DF outbreaks in Guangdong Province.
ACKNOWLEDGEMENTS
This study was supported by the National Basic Research Programme of China (973 Programme) (Grant no.: 2012CB955504), the Special Research Programme for Health (Grant no.: 201202006) and the National Science Foundation of China (NSFC) (Grant no.: 81273139, 30972563).
DECLARATION OF INTEREST
None.
SUPPLEMENTARY MATERIAL
For supplementary material accompanying this paper visit http://dx.doi.org/10.1017/S0950268813001519.