


INTRODUCTION
Acute rheumatic fever (ARF) remains an important public health problem in New Zealand (NZ) [Reference Gurney1, Reference Milne2]. This is despite a major national intervention, the Rheumatic Fever Prevention Programme (RFPP), aiming to reduce its occurrence [Reference Jack3]. ARF is an immune mediated illness triggered in response to untreated Group A Streptococcus (GAS) infection. Episodes of ARF can damage heart valves producing rheumatic heart disease (RHD) – a serious and sometimes fatal condition [Reference Carapetis4]. Over the last century, ARF rates declined dramatically. In modern times ARF is rarely seen in high-income countries, with the exceptions of Australia and NZ. This decline is attributed to improvements in living conditions and increased use of antibiotics to treat streptococcal infections [Reference Vendsborg, Hansen and Olesen5, Reference Gordis6]. Indigenous Australians, and NZ Māori and Pacific peoples, have among the highest reported rates of ARF in the world. RHD remains a major cause of preventable mortality and morbidity in these groups [Reference Milne2, Reference Carapetis4, Reference Milne7].
NZ has two national sources of ARF surveillance data, hospitalisations and notifications, but major limitations affect both. Consequently, accurate case totals cannot be generated [Reference Oliver, Pierse and Baker8]. Hospitalisation data come from the National Minimum Dataset (NMDS), which contains information on all publically funded hospitalisations [9]. As ARF is a serious condition, it is recommended suspected cases be hospitalised [10]. Thus, in theory, ARF hospitalisation data should be fairly complete. However, overcounting has been observed; an audit of hospitalisation data from the Waikato district health board (DHB) area found cases were over-counted by 25% [Reference Atatoa-Carr, Bell and Lennon11]. An audit of Auckland regional data identified an even higher level of over-counting, at 33% [Reference Moxon12]. ARF has been notifiable to public health authorities since 1986 [Reference Millen13]. Case notification data are compiled on the EpiSurv database. In our previous research paper, we used these two data sources to estimate the likely true number of ARF cases arising over the period 1997–2011 [Reference Oliver, Pierse and Baker14]. Our study noted significant under-notification to the EpiSurv national case database, although the discrepancy between these two data sources reduced in recent years [Reference Oliver, Pierse and Baker14]. At worst, regional undernotification approached 50% [Reference Oliver, Pierse and Baker14, Reference Loring15].
In 2012, the NZ Government announced a key goal to reduce the incidence of ARF by two-thirds, to 1·4 per 100 000 by mid-2017. The large-scale RFPP was launched in 2012 to support this target [Reference Jack3]. The RFPP had a $65 million NZD budget. The emphasis was on primary prevention, with a hypothesised effect of enhancing ARF surveillance through improving awareness of ARF case definitions and the need to notify cases in the health sector. Prevention activities had a focus on sore throat management programmes, which were set up in schools and healthcare clinics in areas with high rates of ARF. Here children reporting a sore throat could have throat swab and receive antibiotics free of charge if the swab produced GAS when cultured [Reference Jack3, Reference Oliver, Pierse and Baker8]. It remains difficult to accurately measure progress towards rate reduction targets. An analysis of hospitalisation data suggested that some progress has been made: in 2015 a statistically significant (27%) reduction in the incidence was reported, compared to the baseline period (2009–2011) rate of 3·7 per 100 000 [Reference Jack3]. The initial case notification rate for 2010–2011 was slightly lower, 3·5 per 100 000 [16].
Given the changing epidemiology of ARF and recent RFPP efforts, we updated our previously published incidence estimates [Reference Oliver, Pierse and Baker14] to include 2012–2015. The aims of this present study were to estimate the likely true incidence of ARF in NZ to help measure progress towards the national ARF reduction target, and comment on the changing ability of ARF surveillance systems to detect cases.
METHODS
Ethics approval was obtained from the University of Otago Ethics Committee (Study no. HD16/058). The methodology follows on from that described in the previous paper [Reference Oliver, Pierse and Baker14].
Data sources
ARF diagnoses covering the period 1988–2015 were obtained from the Ministry of Health (NMDS, ICD-10: I00-I02 and ICD-9: 390–392). RHD diagnoses for the same period were also obtained (ICD-10: I05-I09 and ICD-9: 393–398). ARF notifications were obtained from the EpiSurv database for the period 1997–2015.
Information on patients’ NZDep Index score, prioritised ethnicity and DHB were added using information contained in their encrypted NHI (national health index) number. The NZDep Index score is an ecological measure of deprivation based on national census data. Prioritised ethnicity categorises people identifying as two or more ethnic groups into a single ethnic group based on a prioritised order of Māori, Pacific, Asian and European/Other. For example, someone who identifies as both Māori and European will be categorised as Māori only.
The programme R v3.1.0 was used throughout the analysis [17]. The first entry for each individual in each of the hospitalisation and notification datasets was identified and all later entries deleted. When creating the initial hospitalisation dataset (IHD), all individuals who had an admission for RHD before their first hospitalisation for ARF were excluded, as ARF precedes RHD in the causal pathway. All admissions for non-NZ citizens were removed. All entries included the encrypted NHI. Hospital transfers were excluded, so only the first record was included for each admission. In doing this, we attempted to make the dataset exclusive to initial presentations of ARF in accordance with the method adopted by the Ministry of Health in 2013 [18]. All entries missing the encrypted NHI were removed from the Initial Notification Dataset (IND). Where notified individuals could be matched with a hospitalisation for RHD and no previous diagnosis of ARF was applied, their notification was removed. This was an attempt to make the IND exclusive to new presentations of ARF. A match occurred when an encrypted NHI in one dataset was identified in the other dataset. Basic descriptive analyses were performed for the IHD and IND.
Matching individuals between datasets
The IHD was matched with the IND, and vice versa. The number of matched individuals was noted and their data were extracted. When categorising matched individuals by year, their hospitalisation date was used. The number of individuals in either dataset who could not be matched was noted. Two datasets (containing not-matched hospitalised cases and not-matched notified cases) were created. The proportion of matched individuals over the updated study period, 2012–2015, was compared with the proportion identified in the original study period, 1997–2011.
How matched individuals in the updated period differed according to key demographic characteristics with those who were not matched, and differed to those matched in the original study period, was investigated with stratified analyses using logistic models. The odds ratio (OR) and 95% confidence interval (CI) of matching was calculated, compared with a reference subgroup. Reference subgroups were usually selected on the basis that they contained the largest number of individuals, e.g. aged 5–14 years old/Māori/male.
Capture–recapture analysis
The total size of the clinically detectable NZ ARF case population may be detected using two imperfect surveillance systems – hospitalisations and notifications. The likely number of true cases was calculated for the original study period, updated period and the entire study period. Using the Chapman Estimate, the true number of cases may be estimated using the following equation.
 $$N = \displaystyle{{(M + 1)(C + 1)} \over {(R + 1)}} - \; 1$$
where N is the case estimate, M is the number of cases in the IHD and C the number of cases in the IND. R is the number of matched cases.
According to the central limit theorem, the variance of N may be calculated using the following equation:
 $${\rm var}(N) = \displaystyle{{(M + 1)(C + 1)(M - R)(C - R)} \over {(R + 1)(R + 1)(R + 2)}}$$
Consequently, 95% CI can be calculated:
 $$95\% \;{\rm CI} = N \pm (1.96\surd {\rm var}(N))$$
The sensitivity of the IHD and IND were calculated by dividing the case number estimate by the number of cases that dataset detected (e.g. N/M).
The Chapman Estimate uses a number of assumptions, which are likely flawed when applied to this analysis, namely that datasets are independent and only record true cases (independence assumption). The published research containing our original case number estimates considered a number of potential scenarios for how our ARF incidence estimate might be biased as a result of these (likely incorrect) assumptions. We identified a scenario thought to be least biased (termed ‘Scenario 5’). Here the dataset positive predictive values (PPV) identified by the Auckland and Waikato audits were each weighted at 50%, as approximately half the ARF cases occurred in Auckland. The Auckland case audit identified PPVs of 78·7% for notification data (due to undernotification of true cases), 67·0% for hospitalisations (due to overcounting true cases by 33%), and identified a PPV of 88·0% for the overlap section, R (i.e. cases matched between datasets). Waikato PPVs were taken to represent data from the rest of the country and were also weighted at 50%. The Waikato audit identified different PPVs from the Auckland audit: 97·3% for notification data and 75·0% for hospitalisations. The PPV of the overlap was set as 78·0%. When Waikato GPs (rather than hospital-based practitioners) notified cases, the PPV of case matching was 78·0%, thus incorporating this value allowed us to adjust for direct hospital reporting of cases [Reference Oliver, Pierse and Baker14]. The PPVs selected for use in the adjusted analysis were therefore, 88·0% for the IND, 71·0% for the IHD and 83·0% for R.
The number of cases identified in the IHD, the IND and the likely true case number estimates for each study period were compared. Annual case numbers according to different surveillance measures were graphed.
Rate calculations
Numerator data were case numbers estimated using the method described above. Denominator data were based on census data from the NZ resident population. Population denominator data were taken from the Statistics NZ website [19]. Incidence rates were expressed as cases per 100 000 people. When calculating average rates for different periods, the numerator was the sum of the cases occurring in each year of the study period divided by the number of years spanning the study period.
RESULTS
Initial datasets
A total of 2856 individuals were hospitalised with a principal diagnosis of ARF during the study period, 2661 of whom were initial cases and 195 cases were excluded due to having prior admissions for ARF or RHD. The 2661 cases included 121 non-NZ residents, thus a total of 2540 cases were included in the IHD. Altogether 2482 notifications were recorded. Entries missing the encrypted NHI were removed (n = 317). The most recent entry missing an NHI occurred in 2008. Other removed notifications were for individuals who had been notified multiple times and had all entries after their first deleted. Where notifications were matched to entries in the RHD dataset (listing people hospitalised with RHD without any prior admission for ARF) the notification was removed. This left a total of 1906 individuals in the IND (Fig. 1).

Fig. 1. Selecting cases for the initial notification dataset and the initial hospitalisation dataset 1997–2015.
Māori and Pacific people and children aged 5–14 years old were substantially represented in both ARF initial case datasets. Cases were slightly more frequently male, especially in hospitalisation data. Initial ARF cases aged over 30 years were much less common, although hospitalisation data contained double the proportion observed in the notification data. NZDep information was not available for notifications; however, people from quintile 5 (most deprived) were dramatically overrepresented in the hospitalisation dataset, with ARF much less common in quintiles 1–3. In total, 50% of hospitalised cases and 46% of notified cases occurred in the Auckland region. Both hospitalisations and notifications peaked in 2013 (Table 1).
Table 1. Descriptive characteristics of individuals in the initial hospitalisation dataset and the initial notification dataset, 1997–2015

When reviewing the original study period, 1997–2011, more cases were identified in the IND (n = 115), and one less case was identified in the IHD than when findings for this period were first published [Reference Oliver, Pierse and Baker14].
When data were restricted to 2012–2015, both datasets contained a slightly higher proportion of 15–29-year-old patients and a slightly lower proportion of those in other age groups, compared with the 1997–2011 period (24·8% 15–29-year-old patients and 18·3%, respectively). The 2012–2015 data also contained a higher proportion of Pacific (45·6% compared with 36·3%) individuals, and a lower proportion of European/Others (6·5% compared with 13·4%).
Matching between datasets
Altogether 2888 individuals were identified in the initial case datasets and 1558 individuals (53·9%) were matched between them (1997–2015). Matched individuals comprised 81·7% of the IND and 61·3% of the IHD. When restricted to 2012–2015, a total of 687 individuals were identified. Matched individuals comprised 74·7% of this total (83·8% of notifications and 87·2% hospitalisations, Fig. 2).

Fig. 2. Overlap between initial case datasets, 1997–2015.
When restricted to 2013–2014, 82·8% of notifications were matched and 80·5% of hospitalisations. In 2014–2015, 85·5% of notifications matched and 96·3% of hospitalisations.
Factors that influence the likelihood of case matching
A number of characteristics significantly altered the odds of matching between datasets. ORs for case matching may be seen in the Results Appendix. When matching hospitalisations to notification data, people older than 14 years were less likely to match, as were those of European/Other ethnicity. This was also the case when matching notified individuals to hospitalisation data. Female cases and patients with NZDep scores outside of the most deprived quintile were less likely to be matched with notifications, as were cases that came through a non-routine admission source or discharge type (e.g. self-discharged). Patients who spent more than a week in the hospital were more likely to be matched with notifications.
Generally notified cases from outside Auckland were more likely to match with hospitalisation data; however, those from certain DHBs (Waitemata and MidCentral) were less likely to, compared with cases from Counties Manukau. Cases without PR interval by electrocardiograph (ECG) (a diagnostic sign of ARF [Reference Dajani20]), those notified through laboratories or other sources (not including GPs and self-reports), and those of unknown prophylaxis status were less likely to match. If the erythrocyte sedimentation rate (ESR) was not elevated (a minor criterion of the Modified Jones diagnostic criteria [Reference Dajani20]), then notified cases were non-significantly less likely to match with hospitalisation data. A non-significant reduction in the likelihood of matching also occurred when it was unknown whether cases presented with fever (Table 2).
Table 2. Characteristics that significantly influence odds of matching between datasets 2012–2015

NA, Information not available; NS, OR not statistically significant.
* OR is almost statistically significant.
Some changes in findings concerning what characteristics influence odds of matching cases were noted between the original and updated study periods. Female cases were no longer less likely to be matched between datasets. Pacific patients no longer had reduced odds of matching notification data, and nor did cases <5 years old.
Likely true ARF case numbers
A range of scenarios was used to estimate the likely true number of ARF cases arising over different periods. Here we estimate a total of 2342 new cases arose during the 19-year period 1997–2015 (95% CI 2309–2375, annual mean: 123·3 cases, mean annual incidence 2·9 per 100 000). In the original 15-year period, 1997–2011, we estimate a total of 1822 new cases occurred (95% CI 1785–1858, annual mean 121·5 cases, mean annual incidence 3·0 per 100 000), and in the updated 4-year period an estimated 529 new cases occurred (annual mean: 132·3 cases, mean annual incidence 3·0 per 100 000, Table 3).
Table 3. Range of likely true initial rheumatic fever case numbers and mean annual national incidence rates

NB: The PPVs used in the adjusted analysis were 88·0% for the IND, 71·0% for the IHD and 83·0% for R, as described in the Methods.
During the pre-RFPP baseline period, 2009–2011, an annual mean of 148 estimated cases occurred, yielding a mean annual incidence of 3·4 per 100 000 (95% CI 2·9–4·0). By 2015 the rate had fallen dramatically (by 44%), to 1·9 per 100 000 (95% CI 1·5–2·3, estimated 86 cases).
Notification data sensitivity improved considerably in recent years, with sensitivity for 2012–2015 estimated as 100·0%, compared with 62·5% in 1997–2011. Hospitalisation dataset sensitivity improved slightly, from 76·1% (1997–2011) to 79·0% (2012–2015). The adjustment of the overlap section (R) is based on case audits conducted before 2012. It appears that after 2012, the number of notifications and their accuracy increased.
ARF hospitalisations peaked in 2013 and declined sharply afterward. All ARF diagnoses (including cases hospitalised multiple times) and the estimated true case numbers reached lows in 2015. Initial hospitalisations and initial notifications also declined from 2013, although less dramatically. Compared with the pre-RFPP baseline (2009–2011) annual average, by 2015 the estimate of likely true cases had declined by 42% (Fig. 3).
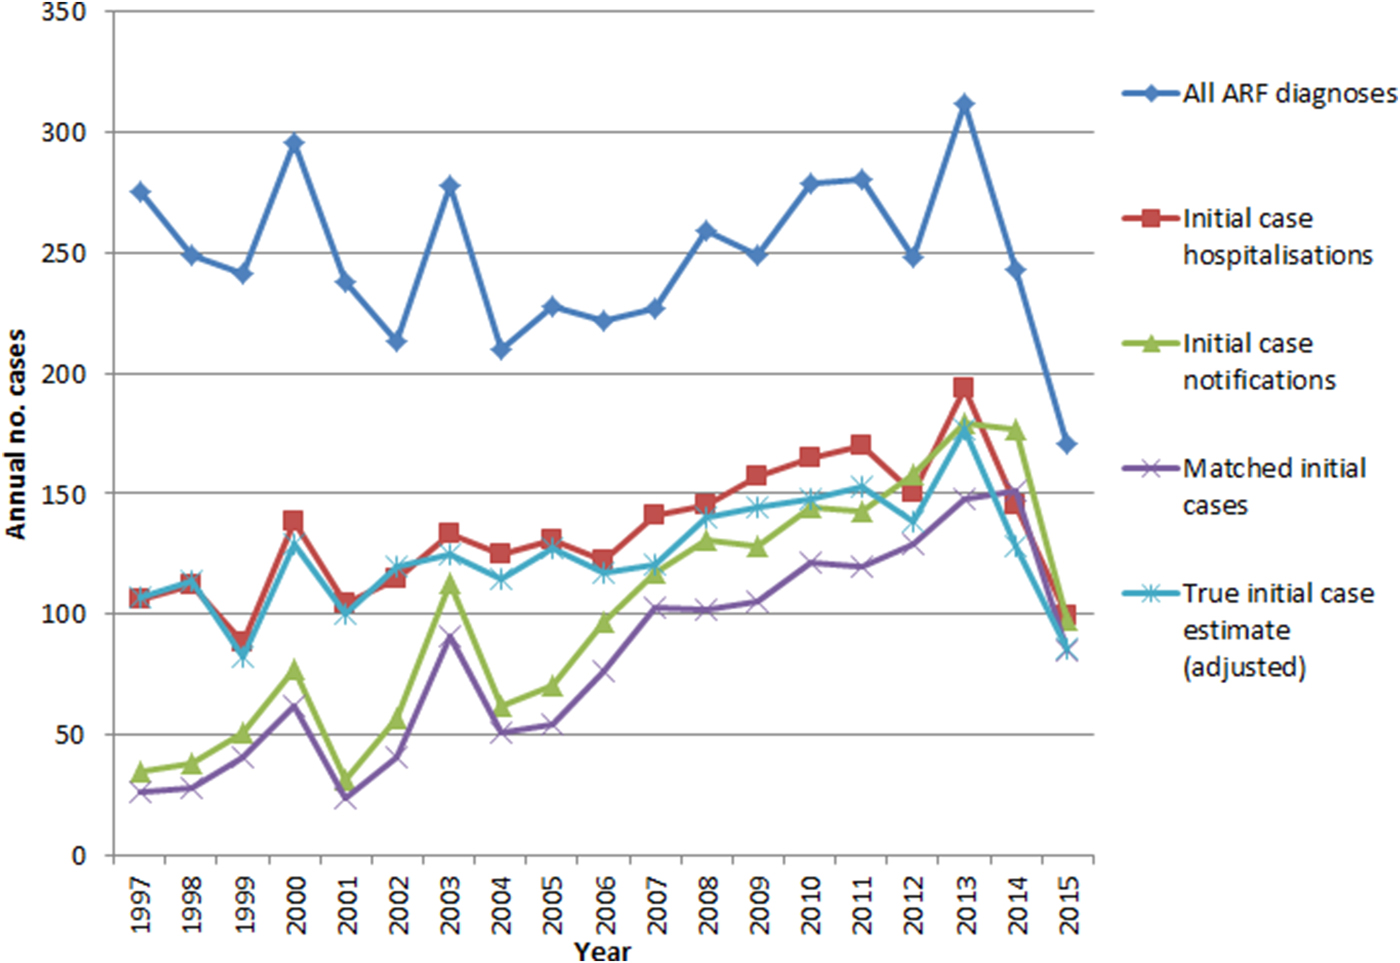
Fig. 3. ARF hospitalisations and notifications, 1997–2015.
DISCUSSION
The large gap in data completeness between the notification database and hospitalisations is slowly closing. Case notifications have improved dramatically since the RFPP began. The original study period identified a case matching the proportion of 53·5% from hospitalisation to notification data, which was consistent with other research findings at the time. In the updated period, we observed a match of 87·2%. This improvement implies that clinicians have become much more effective in notifying cases they are aware of. Matching from notifications to hospitalisation data have improved slightly: in the original study period we noted 80·8% of cases matched; and in the updated period 83·8% matched. This incomplete match implies some cases are still not being hospitalised and/or that case misdiagnosis and miscoding in hospitalisation data continues. That the improvement here is fairly small (3%) is a surprising finding, given the intensive awareness-raising efforts of the RFPP among medical professionals and the publication of an updated clinical ARF guideline in 2014 [21]. It is possible that increased awareness of ARF in the medical sector has led to ARF over-diagnosis or overreporting in hospitals (i.e. more hospitalised cases being labelled as possible ARF and coded accordingly, but later clarified as not being cases and either not being notified or becoming de-notified). Conversely, it is also possible that notified cases are not necessarily hospitalised, though this trend seems unlikely as hospitalisation of new cases is the usual standard of care.
This study indicates that some progress has been made in reducing the likely true rate of ARF over the period since the RFPP became active. The incidence of ARF does fluctuate, however, and follow up time since the RFPP implementation is limited. The rate of ARF remains high (reported as 3·0 per 100 000 people in 2016) and is concentrated in Māori and Pacific children [Reference Jack3, 18]. Multiple explanations have been put forward to explain this, including genetic factors predisposing ARF, environmental factors, such as persisting barriers to healthcare and non-compliance with antibiotic treatment [Reference Engel22, Reference Lennon23]. Socioeconomic factors may also be important drivers of ARF [Reference Carapetis4]. While some ARF outbreaks have been associated with especially virulent GAS strains [Reference Veasy24], a diverse range of GAS emm-types has been associated with ARF in NZ, including strains usually associated with skin infections [Reference Williamson25]. Some evidence suggests GAS skin infection may play a causal role in the development of ARF [Reference McDonald, Currie and Carapetis26].
Whether the recent reduction in case numbers will be sustained is unknown; however, case fluctuation of this magnitude has not previously been seen in NZ (Fig. 3). This implies that the reduction may well be driven by factors besides natural variation and chance. Our findings are in accordance with the interim RFPP evaluation report, which observed a significant drop in the first episode ARF hospitalisations by mid-2015 compared with the baseline period 2009–2011 [Reference Jack3]. This is perhaps unsurprising as both the evaluation and this study used the same methodology to define first episode hospitalisation. Obviously this study is not able to demonstrate a causal association between the decline in cases and RFPP activities, however, the two are temporally, and plausibly, associated.
Atypical cases, who are not Māori or Pacific, aged 5–14 years old, or male, are less likely to match between datasets. When the original study was conducted, we found female cases were significantly less likely to be matched between both datasets. The updated investigation indicates hospitalised female cases are still less likely to be notified, but notified female cases are no longer less likely to be identified in ARF hospitalisation data. Hospitalised Pacific cases were less likely to be notified than Māori cases, but this is no longer the case. Older cases remain much less likely to be matched between datasets. Cases that do not present with some diagnostics signs are also less likely to match. This finding suggests that clinicians need to be reminded of the importance of considering ARF in older patients and those who do not present with classical diagnostic features.
The main limitation of this study is that capture–recapture analyses assume the datasets they work with are independent, but the hospitalisation and notification datasets are likely not. This assumption is almost always violated, and consequently, adjustments to reduce bias are recommended [27]. It is possible to use different estimators for calculating likely true numbers of cases, which would involve utilising different assumptions about co-variates. In this paper, we endeavored to minimise the number of assumptions. There is no way of knowing the extent the datasets were not independent and how greatly this assumption was violated; however, the Chapman estimate is less biased than alternative capture–recapture methodologies [Reference Amstrup, McDonald and Manly28, Reference Chapman29]. In addition, we have adjusted the likely true case estimates to account for the considerable reported inaccuracies in these datasets (using scenario 5) which included adjusting for hospitals directly notifying cases [Reference Oliver, Pierse and Baker14]. The number of matched cases in this analysis has also been adjusted for each period. This has the effect of making the sum of the updated and original study periods not equal to the total calculated for the whole study period. For example, hospitalised cases in 2011 who were not notified until 2012 are counted as matches for the whole study period, but as non-matches when restricted to 1997–2011 and 2012–2015 periods. Such time lags affect the true case number estimates.
There are fundamental differences between hospitalisation and notification data. Notification data are specifically collected for surveillance (and case management) purposes – there is a case definition, and cases are investigated to decide whether they should remain on the database (cases can be de-notified). Hospitalisation data are largely collected for administrative purposes, multiple diagnostic codes are assigned to each patient by coders using case notes and rules (but not case definitions). These diagnostic codes are not updated based on further case investigation, some of which is not completed until after hospital discharge, thus affecting notification status but not the coded hospital discharge data. Notifications are thus generally likely to provide a better ‘reference standard’ than hospitalisations, at least for measuring specificity [Reference Oliver, Pierse and Baker14]. There is a very limited ability to investigate notifications made prior to 1997 as earlier notification data do not exist in an easily assessable format. Consequently, early IND notifications may not be incident events as we had no way of searching for previous notifications. The 2012–2015 period which this analysis focuses on, however, is not likely to be affected. It does appear that after 2012, the completeness and accuracy of notifications improved. Consequently, the reduction adjustment applied to the IHD is probably overly severe for this period.
Capture–recapture analyses have been used extensively in infectious disease research using methodologies similar to ours, and have proved useful in the public health field [Reference Harvey, Craney and Kelly30–Reference Milde-Busch37]. Different case numbers were noted for the period 1997–2011, compared with those identified in our original study [Reference Oliver, Pierse and Baker14]. This inconsistency is likely due to retrospective notification and a misdiagnosis being clarified in the hospitalisation data. Regardless, findings in the original paper remain valid, as they are a better representation of ARF occurrence and the flawed hospitalisation and notification surveillance data available at the time. Cases with more than one NHI number would have been counted multiple times; however, multiple NHIs are rarely assigned to younger patients [Reference Oliver, Pierse and Baker14]. Some notified cases (13%) lacked NHI numbers (although none after 2008). Consequently, these could not be matched between datasets and were excluded from the analysis. Given the positive dependence between datasets, this means that we may have slightly overestimated true cases, although estimates after 2008 are not affected. This finding further supports the conclusion that ARF surveillance data has improved over time.
Diagnostic methods for ARF and RHD have changed over time, particularly with the incorporation of echocardiographic findings since 2012 [Reference Remenyi38]. Consequently, earlier RHD cases (who would now be identifiable using this more sensitive case-finding method) may have been missed or counted incorrectly as ARF. As this analysis focuses on the years 2012–2015, it is largely unaffected, but findings may not be strictly comparable to earlier periods. The 2014 update to the 2006 NZ diagnostic guidelines would also have affected our case inclusion criteria, both for ARF and RHD, though the alternations were not substantial [21].
Our findings once again reinforce the need for a national rheumatic fever register to support improved surveillance and case management. Previous research has indicated a clear need for such a register [Reference Oliver, Pierse and Baker14]. Given the public health importance of ARF and RHD, and the large investment in reducing the disease incidence, the ability to produce valid incidence and distribution estimates is critically important [Reference Jack3]. One option involves adapting the national notifiable disease database Episurv to provide a register function. This would seem a low cost and practical option as the required infrastructure already exists and collation of surveillance information by this database is supported by current legal and administrative arrangements [Reference Oliver, Pierse and Baker8].
CONCLUSION
Our findings indicate that some progress has been made in recent years with reducing the incidence of ARF and improving the proportion of cases who are notified. Clinicians need to remain aware of the need to notify cases in order to support effective case management and surveillance, especially of female and older cases. A possible unintended consequence of the RFPP is over-diagnosis or over-reporting of ARF in hospitals. The need for accurate diagnosis that consistently follows clinical guidelines may need to be re-emphasised in primary care. The incidence of ARF remains unacceptably high. It is important that effective, evidence-based interventions for control and prevention be maintained and strengthened for the recent decline in cases to continue. A national ARF register could support all of these essential actions.
SUPPLEMENTARY MATERIAL
To view supplementary material for this article, please visit https://doi.org/10.1017/S0950268817002734
ACKNOWLEDGEMENTS
We would like to acknowledge Dr Tomasz Kiedrzynski (Ministry of Health) for his assistance in planning and reviewing the original project, which this paper follows on from. We acknowledge Yvonne Galloway (Environmental Science Research), who managed our notification data request and Chris Lewis (Ministry of Health), who encrypted the data. We acknowledge Jane Zhang (University of Otago) who provided the hospitalisation data and Oliver Robertson who proofread the manuscript.
This project was supported by a grant from New Zealand Lottery Health Research in the form of a PhD scholarship awarded to Jane Oliver.
DECLARATION OF INTEREST
None.
DISCLAIMERS
None.


