


Introduction
Gastrointestinal (GI) illness from exposure to pathogens in water can result from factors such as weather events, the failure of water treatment or distribution systems, and human error [1]. Acute GI illness has been associated with pathogenic contamination of drinking water according to self-reported information from telephone surveys [Reference Save-Soderbergh2], though there is less information on illnesses requiring medical care. Similarly, there tends to be more information on outbreaks (e.g. [Reference Benedict3, Reference Efstratiou, Ongerth and Karanis4]) than on endemic rates. In Canada, previous estimates of the health burden of waterborne disease and surveillance efforts (e.g. [5–Reference Vrbova9]) have focused on enteric pathogens introduced via faecal contamination, such as Giardia spp., Cryptosporidium spp. and Escherichia coli. Exposure to these pathogens occurs via ingestion. However, there is growing concern about pathogens that are naturally occurring in water and can be transmitted by inhalation of aerosols [Reference Ashbolt10–Reference Wang14]. Such pathogens include Legionella spp. and Pseudomonas spp., which are naturally occurring in water and not correlated with faecal indicators often used to assess water quality [Reference Ahmed15]. These two pathogens along with non-tuberculous mycobacteria (NTM) were collectively associated with 91% of deaths from diseases transmitted by water in the USA [Reference Gargano16].
Pulmonary infections are the principal outcome of NTM exposure, with a much smaller number of extrapulmonary infections (e.g. skin) resulting from exposure to this pathogen [Reference Marras12]. Pontiac fever (mild flu-like illness) or the more serious Legionnaires' disease can result from Legionella spp. exposure. Exposure to Pseudomonas spp. can result in pneumonia, as well as blood and skin infections. Pseudomonas spp. can also be transmitted by direct contact with water and healthcare workers [Reference Falkinham11]. These three pathogens are able to resist disinfection, grow in biofilm and amoebae and survive in stagnant (low oxygen) water [Reference Falkinham17]. They can reside in drinking-water distribution systems and premise plumbing (the portion of the water distribution system inside buildings) [Reference Falkinham11]. The three pathogens have been referred to as opportunistic premise plumbing pathogens because of the attributes listed above and their tendency to infect individuals who are older, immunosuppressed and/or have pre-existing chronic diseases [Reference Naumova18].
The number of notifiable cases of illness reported to public health authorities and captured in surveillance systems is typically fewer than the number of people who become ill, seek medical care and receive confirmatory laboratory diagnostic testing [19]. Even when diseases of public health significance are reported, the exposure source (e.g. food, animal, water) is often unclear or unknown [Reference Vrbova9], making it difficult to attribute the reported cases to any particular source. In addition, surveillance may be based on the identification of specific pathogens, even though many cases may never be traced back to a specific pathogen. Previous studies found the burden of foodborne illness not traced back to a particular pathogen was 1.3–4.1 times larger than the total foodborne burden attributed to major known pathogens [Reference Scallan20, Reference Thomas21].
Researchers have estimated emergency department (ED) visits and hospitalisations in the year 2013 [Reference Adam22] and deaths from 2003 to 2009 [Reference Gargano16] for select diseases that can be transmitted by water in the USA. The studies, which made use of surveillance, administrative and death certificate data for disease estimates, found most of the disease was not due to enteric pathogens. Both studies noted their estimates did not account for the portion of disease transmitted by water as opposed to other sources (e.g. food, human, animal) and suggested that an attribution process was a necessary next step for a comprehensive analysis.
Burden of disease analyses, which involve attributing a fraction of disease outcomes (e.g. deaths) to an exposure or source, can be useful for understanding the relative impact of different environmental exposures on population health [Reference Hanninen23, Reference Prüss-Ustün24]. We estimated the burden of disease from exposure to waterborne pathogens in Ontario, Canada (population ~14 million) as part of a larger effort to understand the relative burdens from significant environmental exposures. We were interested in the portion of disease outcomes attributable to water for (1) specific enteric pathogens, (2) unspecified pathogens leading to GI illness and (3) pathogens largely transmitted through inhalation of water aerosols. Taking advantage of comprehensive administrative health databases, we evaluated the burden in terms of ED visits, hospitalisations and deaths; measures reflecting moderate-to-severe outcomes and readily understood by decision-makers.
Methods
We followed a framework similar to other environmental burden of disease studies (e.g. [Reference Hanninen23, Reference Prüss-Ustün24]). After selecting the pathogens of interest, we used diagnostic codes to quantify the diseases of interest in terms of counts and crude rates. Then, we attributed a fraction of the disease to the waterborne transmission route. We used a probabilistic model and inputs as described below.
Selection of waterborne pathogens
To select the waterborne pathogens to include in our analysis, we first examined surveillance-derived annual case rates (2006–2015) representing laboratory-identified cases of reportable diseases in Ontario [25]. We next reviewed modelled estimates of annual hospitalisations and deaths, for 19 bacteria, five parasites and six viruses in Canada (2000–2010) [Reference Thomas21]. After ranking the estimates based on the expected contribution from waterborne transmission, we selected 10 pathogens that were among the top of either list, including nine enteric pathogens and Legionella spp.
We next reviewed the indexed scientific literature and consulted with clinicians to augment our pathogen list. We added Pseudomonas spp. and NTM based on their expected contributions to hospitalisations and deaths in the province [Reference Marras12, Reference Hota26]. We also added a general category for gastroenteritis not traced back to a specific pathogen (hereafter called ‘unspecified pathogen GI illness’) since causative pathogens are not identified in all cases. Illustrating this, in the USA, 80% of foodborne illness was due to unspecified agents, including known agents with insufficient data for estimating agent-specific illness, and 20% was due to major known pathogens [Reference Scallan20]. Figure 1 contains a list of the 12 pathogens (plus unspecified pathogen GI illness) we included in our study.
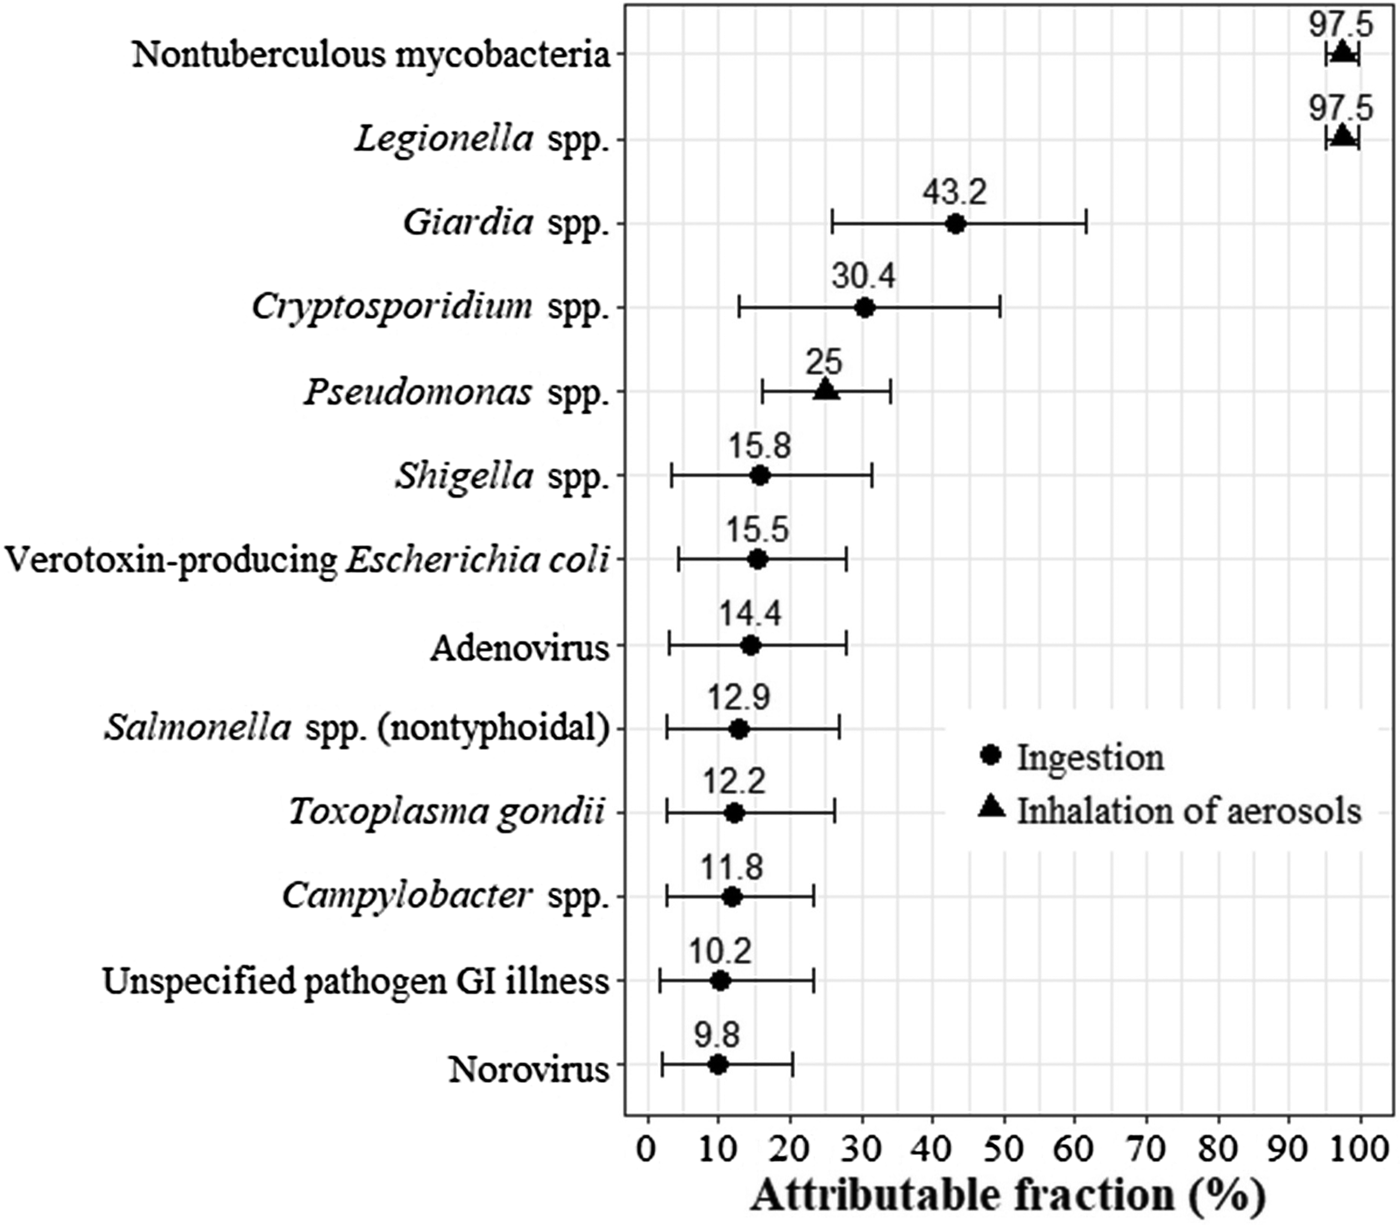
Fig. 1. Fraction of disease attributable to water transmission by a pathogen with thepredominant route of exposure (ingestion or inhalation) indicated. Mean shown by dot (for pathogens that are ingested) or triangle (for pathogens that are inhaled) and 5th and 95th percentiles shown by whiskers. GI, gastrointestinal.
Calculation of waterborne disease burden
The waterborne attributable disease burden (AD) is the waterborne attributable fraction (AF) multiplied by the disease count (D): AD = AF × D. The waterborne attributable disease (crude) rate burden (ADR) is the attributable disease divided by the population (P): ADR = AD/P. The Ontario population for the year 2016 was 13 875 394 [27].
We conducted a Monte Carlo analysis (10 000 iterations) using @RISK, a Microsoft Excel add-in (version 7.5, Palisade Corporation, USA). Attributable burden counts and rates were summarised using the simulation mean and 5th and 95th percentile estimates. The number of iterations was sufficient for convergence of the results. We also fit distributions to attributable fraction inputs using @RISK and selecting the fit with the lowest AIC.
Attributable fractions
All attributable fraction distributions are summarised in Figure 1 and fully specified in Table A1. We relied on a Canadian expert elicitation study to develop the attributable fractions for the nine enteric pathogens included in this study. One study compiled estimates from 31 experts on the major transmission routes (foodborne, waterborne, animal contact, person-to-person and other) for 28 enteric pathogens [Reference Butler, Thomas and Pintar28]. They combined expert estimates using triangular probability distributions. Rather than using their pathogen-specific results for the waterborne transmission route directly, we constrained each waterborne attributable fraction to be consistent with the attribution from the other four major transmission routes (i.e. all routes summed to 100%) and used the best fitting distribution type for each pathogen.
We developed the remaining four attributable fractions from other literature sources and clinical input. Water is the major environmental reservoir and water aerosols the main source of exposure for Legionella spp. and NTM in Canada [29], although cases of the disease can also occur via aerosolised soil [Reference van Heijnsbergen30, Reference Nishiuchi, Iwamoto and Maruyama31]. As such, we attributed 95–100% of infections to waterborne transmission for these pathogens. Pseudomonas spp. infections are often healthcare-acquired, with transmission routes including the hands of healthcare workers, direct patient-to-patient contact and contamination of the environment (e.g. faucets, sink drains) and equipment [Reference Bedard, Prevost and Deziel32, 33]. We attributed 15–35% of Pseudomonas spp. infections to waterborne transmission based on our review of the literature (e.g. systematic review of its transmission in hospital intensive care units [Reference Loveday34]) and input from Ontario-based infectious disease experts.
For unspecified pathogen GI illness, we developed an attributable fraction by fitting a distribution to the mean estimates of the proportion of GI illness attributable to waterborne pathogens in Canada that were published in the last 10 years [Reference Murphy8, Reference Vrbova9, Reference Keegan35–Reference Whitfield37]. The mean estimates, ranging from 2% to 20%, were based either on selected groups of known pathogens for which surveillance data were available or the risk of acute GI illness attributable to drinking water.
Disease counts
We expressed disease in terms of deaths and healthcare utilisation as their importance is readily understood and reliable data exist for nearly all Ontario residents. We obtained counts of deaths, hospitalisations and ED visits corresponding to specific disease diagnoses. For unspecified pathogen GI illness, we were also able to estimate the counts of physician office visits using the physician billing claims database for the province (Ontario Health Insurance Plan; see [Reference Drudge38] for method). However, we do not present these results formally because there was insufficient detail to provide estimates at the pathogen level.
The diagnostic codes shown in Table 1 are from the International Statistical Classification of Diseases, 10th Revision (ICD-10) or ICD-10-CA (the Canadian modification of ICD-10). Most diseases were captured by one or two diagnosis codes. We also included Guillain–Barré syndrome due to Campylobacter spp. and haemolytic–uraemic syndrome due to verotoxin-producing E. coli (VTEC) because of their expected major contribution to the burden for these pathogens. The disease counts reflect the year 2016 (the latest year for which full data were available). Additionally, given the sporadic nature of outbreaks, we examined disease counts over the most recent 5-year period (2012–2016), though we did not identify any discernible trends over that period (Tables A2a–c).
Table 1. Emergency department visit, hospitalisation and death counts corresponding to diagnosis codes (from all exposures) in Ontario for the year 2016

GBS, Guillain–Barré syndrome; HUS, haemolytic–uraemic syndrome; Max, maximum; Min, minimum; NTM, non-tuberculous mycobacteria; VTEC, verotoxin-producing Escherichia coli.
a Counts with small cell sizes (<6) were suppressed; indicated by a dash.
b Minimum was for the main problem only. Maximum was for any diagnosis type. ICD-10-CA diagnosis code used.
c Minimum was for the most responsible diagnosis only. Maximum was for any diagnosis type. ICD-10-CA diagnosis code used.
d Minimum was for the underlying cause of death only. Maximum was for any cause of death. ICD-10 diagnosis code used.
e Selected based on literature survey and clinical expert judgment; all others selected by the examination of surveillance case and modelled hospitalisation/death data (see methods for details).
f The diagnosis code captured all causes of the syndrome, so we estimated the proportion due to the specified pathogen for each year. The proportions were 0.09–0.47 (uniform distribution) for Campylobacter-associated GBS and 0.75–1.00 (uniform distribution) for VTEC-associated HUS (see Drudge et al. [Reference Drudge38] for details).
g The diagnosis code A41.51 (sepsis due to Pseudomonas) was not included in ICD-10 (used to describe deaths), so we estimated the proportion of deaths captured by ICD-10 code A41.5 (sepsis due to other Gram-negative organisms) that were specifically due to Pseudomonas spp. sepsis. We used the proportion of hospitalisations captured by ICD-10-CA code category A41.5 × that specifically were A41.51 (sepsis due to Pseudomonas) (most responsible diagnosis only).
h These diagnosis codes collectively captured gastroenteritis from any cause, so we estimated the proportion not due to pre-existing conditions (e.g. irritable bowel syndrome). The proportion was 0.81–0.88 (uniform distribution) (see Drudge et al. [Reference Drudge38] for details).
Note: in 2016, there were 449 656 physician office visits billed for gastroenteritis (Ontario Health Insurance Plan diagnostic code 009). After applying footnote (h), the central estimate is 379 959 visits.
For all Ontario residents, we acquired annual counts (de-identified aggregate data) from the National Ambulatory Care Reporting System, the Discharge Abstract Database and the Ontario vital statistics death data. Since any health record may include multiple diagnoses, we modelled the disease counts as uniform distributions as follows. For deaths, the minimum count reflects the underlying cause of death only, while the maximum reflects any cause of death (i.e. underlying, immediate, all antecedent and other significant contributing). For hospitalisations or ED visits, the minimum count reflects the ‘most responsible diagnosis’ or the ‘main problem’, respectively, while the maximum reflects any diagnosis type. All disease count characterisations are provided in Table 1.
Results
The estimated attributable disease rates for deaths and health care utilisation are presented in Table 2. We presented estimates where the mean attributable rate (per 100 000 population) was at least 0.01 for deaths, 0.1 for hospitalisations or 0.1 for ED visits. These rates roughly correspond to one death and 10 hospitalisations or ED visits in the study population and are referred to as the presentation thresholds. Seven of the 13 pathogen groups met at least one of the presentation thresholds: unspecified pathogen GI illness, all three pathogens transmitted by inhalation of aerosols and three of the nine enteric pathogens. We also include the rates for the sum of the six enteric pathogens that did not meet any presentation threshold. Overall, the mean attributable rates were 69 (5th and 95th percentiles: 13, 158) per 100 000 for ED visits, 12 (5th and 95th percentiles: 5, 22) per 100 000 for hospitalisations and 0.52 (5th and 95th percentiles: 0.29, 0.83) per 100 000 for deaths attributable to waterborne pathogens in Ontario. In Ontario, the mean attributable estimates corresponded to 9600 ED visits, 1600 hospitalisations and 70 deaths for the year 2016 (Table A3). The ratio of ED visits to hospitalisations to deaths was approximately 130:20:1.
Table 2. Estimated attributable ED visit, hospitalisation and death rates (per 100 000 population) to identify waterborne pathogens and unspecified waterborne pathogens causing GI illness in Ontario in the year 2016

ED, emergency department; GBS, Guillain–Barré syndrome; GI, gastrointestinal; NTM, non-tuberculous mycobacteria.
a Results presented when the rate per 100 000 population was at least 0.1 ED visits, 0.1 hospitalisations or 0.01 deaths. The sum of the pathogens that did not meet the presentation threshold is shown as a separate row. Results may not add up due to rounding (to two significant figures).
b The simulation is summarised by the mean and 5th and 95th percentiles of the 10 000 iterations.
c This is the sum for the six pathogens that were below the presentation threshold (and thus not included elsewhere in this table): adenovirus, Cryptosporidium spp., norovirus, Shigella spp., Toxoplasma gondii and verotoxin-producing Escherichia coli.
d This is a sum of all enteric pathogens: adenovirus, Campylobacter spp., Cryptosporidium spp., Giardia spp., norovirus, Salmonella spp., Shigella spp., Toxoplasma gondii and verotoxin-producing Escherichia coli.
e This is the sum for the largely inhaled pathogens Legionella spp. infection, NTM infection and Pseudomonas spp. pneumonia and sepsis from the rows above.
f This is the sum for all identified pathogens. It includes all nine enteric pathogens (including those below the presentation threshold) and all three opportunistic (respiratory) pathogens, but excludes unspecified pathogen GI illness.
Note: we estimated a physician office visit rate per 100 000 for unspecified pathogen GI illness of 280 (5th and 95th percentiles: 50 630).
The estimated attributable rates for GI illness without a specified pathogen were strikingly higher than for any identified pathogen, and in some cases, higher than the sum of all 12 identified pathogens. At the mean, the attributable rate of unspecified pathogen GI illness was over 70 times higher for ED visits compared to the sum of all 12 identified pathogens (68 compared to 0.94 per 100 000). For hospitalisations, the mean was nearly twice as high (7.5 vs. 4.1 per 100 000), while for deaths, the mean rate was lower (0.21 vs. 0.32 per 100 000).
When considering only identified pathogens, the results varied by the type of healthcare encounter. The attributable rates for hospitalisations and deaths were highest for NTM, Pseudomonas spp. and Legionella spp. The sum of these three pathogens represented 83% of hospitalisations and 97% of deaths for identified pathogens. Furthermore, the pathogen NTM had the highest attributable ED visit rate. For ED visits, all enteric pathogens comprised 65% of the sub-total for identified pathogens. While there was some year-to-year variability, the rankings of the top pathogens, based on the mean attributable rates, did not change over the years 2012–2016 (underlying data in Tables A1 and A2a–c).
Figure 2 shows how the results vary by the type of healthcare encounter when the results are split into three categories: unspecified pathogens, enteric pathogens and inhaled aerosol pathogens. Again, the mean burden attributable to unspecified pathogens is greatest for ED visits and hospitalisations, while the mean attributable burden to inhaled aerosol pathogens is greatest for deaths. The mean attributable burden for enteric pathogens was lowest for all types of healthcare encounter.

Fig. 2. Estimates of emergency department (ED) visits, hospitalisations and deaths attributable to gastroenteritis when the causative pathogen was (a) not identified, (b) enteric pathogens or (c) inhaled aerosol pathogens. Notes: ‘Pathogen not identified’ reflects the estimates of healthcare utilisation and deaths where the causative pathogen was not identified. ‘Enteric pathogens’ represent the sum of adenovirus, Campylobacter spp., Cryptosporidium spp., Giardia spp., norovirus, Salmonella spp., Shigella spp., Toxoplasma gondii and verotoxin-producing Escherichia coli. ‘Inhaled aerosol pathogens’ represent the sum of Legionella spp., non-tuberculous mycobacteria and Pseudomonas spp. The box encloses the 25th to 75th percentile simulation results for attributed ED visits, hospitalisations or deaths. The line in each box represents the median of the distribution, while the ‘x’ represents the mean. The whiskers represent 1.5 times the interquartile range and points beyond this range indicate outliers.
Discussion
This work estimated the burden of disease for 12 pathogens and for unspecified pathogen GI illness transmitted through water in Ontario, Canada. It provides several unique contributions to the literature. First, it uses comprehensive administrative data to quantify healthcare utilisation and mortality, and apportions a fraction of these outcomes to the waterborne route of transmission. Second, it highlights the importance of waterborne GI illness where no causative pathogen was identified as well as infections transmitted through inhalation of water aerosols. Estimates of pathogen-specific enteric illness do not include these important contributors to waterborne disease. Third, it provides estimates of annual ED visits, hospitalisations and deaths attributable to infections transmitted through water that can be compared with other environmental hazards and over time. This analysis is part of a larger initiative by Public Health Ontario to estimate the environmental burden of disease in the province in order to compare the relative mortality and healthcare burden across a suite of environmental hazards using a consistent framework. The results can inform local and provincial decision-making regarding environmental, public health and planning priorities, with the ultimate goal of protecting and improving the health of the population.
We did not report individual results for the burden attributable to adenovirus, Cryptosporidium spp., norovirus, Shigella spp., Toxoplasma gondii or VTEC as the estimates did not meet our reporting threshold. We did not locate other burden estimates for these pathogens, save a study [Reference Xiao39] that assessed the burden of Cryptosporidium spp. mortality in China by quantitative microbial risk assessment (QMRA) and also estimated a low attributable death rate (range: 0.011–0.17 per 100 000 depending on the treatment type used). Differences in the estimation approach can partially explain why these estimates are higher than our corresponding values (they did not meet the reporting threshold for the mortality of 0.01 per 100 000).
We compared our reported results with others available for Canada and the USA to provide context. The corresponding crude hospitalisation and death rates are shown in Table 3. The Global Burden of Disease 2015 Study reported an unsafe water, sanitation and handwashing mean death rate for Canada of 0.56 per 100 000 [6], which is about 8% higher than our mean waterborne attributable death rate. This is a relatively close level of agreement, considering differences in inputs, exposures and diseases considered, and models. As expected, our estimates of healthcare utilisation and deaths are lower than other reported estimates for the total number of cases of waterborne infections. Supporting this finding, telephone surveys to determine the levels of acute GI illness in Canada found that only 9–22% of respondents who reported illness sought medical care [Reference Sargeant, Majowicz and Snelgrove40, Reference Thomas41]. One study estimated acute GI illness in Canada by modelling data on drinking-water treatment systems, randomised control trials of drinking-water interventions and GI illness risk associated with distribution systems [Reference Murphy8]. They estimated approximately 1200 cases per 100 000 population, which is over four times greater than our rate of 280 physician office visits per 100 000 population for unspecified pathogen GI illness (see note under Table 2). Since our approach only captures cases who had contact with the healthcare system, our results should be considered an underestimate of the total number of illnesses from waterborne pathogens.
Table 3. Comparison of results from this study (year 2016) to comparable crude hospitalisation and death rates from other studies and surveillance data

GI, gastrointestinal; NTM, non-tuberculous mycobacteria; NE, not estimated.
a This estimate for foodborne illness can be used to compare the foodborne and waterborne transmission routes for Ontario.
b These estimates are not specific to waterborne transmission. The crude rates were calculated using a population estimate for the USA of 316.2 million (year 2013) for Adam et al. [Reference Adam22] and of 298.4 million (year 2006) for Gargano et al. [Reference Gargano16]. Table 1 of Adam et al. [Reference Adam22] reported a hospitalisation total for 13 pathogens that converts to 32 per million and is used as the total when examining the contribution of specific pathogens.
c We obtained or back-calculated the unspecified estimates for all transmission routes and reflecting both domestic and travel-acquired illness. We then multiplied the all transmission route estimate from the studies by our unspecified GI illness attributable fraction (mean of 0.102) for waterborne transmission.
d These estimates are not specific to waterborne transmission. They reflect confirmed and probable cases reported to public health authorities in 2016. Hospitalisations reflect admissions up to 60 days before or 90 days after the episode. Deaths reflect any cause of death, unless there was an indication that the reportable disease was unrelated to the cause of death.
We observed GI illness without a specified pathogen to dominate the ED visits attributable to waterborne pathogens, with only 1% of the burden attributed to specific pathogens. For hospitalisations and deaths, however, the burden attributed to specific pathogens was higher (36% and 60%, respectively), which suggests a higher likelihood of pathogen testing for more severe outcomes. The importance of unspecified pathogen GI illness has also been noted for foodborne illness [Reference Scallan20]. Our estimates for hospitalisations and deaths for unspecified GI illness are in line with unspecified agent estimates reported in two studies [Reference Scallan20, Reference Thomas21] that we scaled for waterborne transmission (see Table 3).
Two studies used administrative data to estimate the disease due to 13 pathogens that can be transmitted by water in the USA [Reference Gargano16, Reference Adam22]. There was overlap with our study for nine pathogens (Campylobacter spp., Cryptosporidium spp., E. coli, Giardia spp., Legionella spp., NTM, Pseudomonas spp., Salmonella spp. and Shigella spp.). In contrast to our study, the authors reported 100% of ED visits, hospitalisations and deaths that were linked with a pathogen (we applied a lower percentage, reflecting the portion attributable to water), counted any diagnosis type/cause of death (we used the range from only the principal diagnosis/underlying cause of death to any diagnosis type/cause of death) and did not estimate unspecified pathogen GI illness (we did). In terms of total waterborne illness, one study's hospitalisation rate was 3.2 times higher [Reference Adam22] and another study's death rate was 4.5 times higher [Reference Gargano16] than the present study (Table 3). Corresponding estimates were in closer agreement for Legionella spp., for which nearly all the burden could be attributed to water. In contrast, the estimates were more divergent if other transmission routes were important (e.g. Pseudomonas spp.). The higher rates for NTM, for which most of the burden could be attributable to water, may represent true differences in incidence.
Legionella spp., NTM and Pseudomonas spp. were substantial contributors to waterborne hospitalisations and deaths. From Table 1 of Adam et al. [Reference Adam22] and Table 5 of Gargano et al. [Reference Gargano16], 69% of hospitalisations and 91% of deaths were associated with these three pathogens. Our corresponding estimates were 82% of hospitalisations and 95% of deaths from all identified pathogens, and 29% of hospitalisations and 58% of deaths from the overall waterborne burden, indicating the large contribution of unspecified pathogen GI illness to the total burden in our analysis. Unlike enteric pathogens, Legionella spp., NTM and Pseudomonas spp. may not be adequately controlled by disinfection occurring at a treatment plant or other location within the municipal distribution system. These three pathogens are distinct from enteric pathogens with respect to their health effects and strategies for preventing disease. A QMRA study focused on potential activities using roof-harvested rainwater and indicated that drinking water, showering and garden hosing pose the highest risks for Legionella spp. and NTM infection [Reference Hamilton42]. They tend to inhabit biofilms in pipes and fixtures, such as showerheads and faucets, and in other non-potable water reservoirs which can then serve as sources of infections [Reference Falkinham11, Reference Bedard, Prevost and Deziel32, Reference Kanamori, Weber and Rutala43]. Establishing water system management programmes can help control these pathogens, through actions such as maintaining water temperatures outside the optimal growth range, altering plumbing to minimise water stagnation or low flow rates, and enhancing plumbing disinfection [Reference Cunliffe44, Reference Gamage45].
In Ontario, data on 70 reportable diseases are collected from clinicians, laboratories and others, and disease cases are investigated by local public health units [46]. During case follow-up, information on whether the individual was hospitalised or died due to the disease is recorded. While reportable disease information reflects all transmission pathways, Legionella spp. transmission occurs predominantly via water. We note the estimated hospitalisation and death rates for Legionella spp. from this analysis were lower than corresponding reportable disease estimates (Table 3), though counts were small (e.g. 7 vs. 11 deaths). Previous investigators have compared administrative data and reportable disease data in Ontario. A study [Reference Crowcroft47] found neither data source to be complete and both to underestimate the true incidence of pertussis, while another study [Reference Hobbs48] found that administrative data reasonably approximated reportable disease data for influenza hospitalisations. It is likely that the agreement between administrative and reportable disease data varies by disease, with both data sources underestimating the true burden of disease due to medical care not always being sought.
Another comparison of interest is the burden of disease transmitted by food vs. water. Drudge et al. [Reference Drudge38] used a nearly identical approach and data sources to examine the burden of foodborne illness from 11 pathogens, food poisoning and unspecified GI illness in Ontario. Overall, the foodborne illness burden was larger than the waterborne burden by a factor of 4.2 for hospitalisations (Table 3). However, the food and water estimates were similar for deaths, which may be due to the substantial contribution of NTM to the waterborne totals.
As with other burden of disease studies, our study has several limitations. Our burden results are heavily dependent on the proportion of disease attributable to waterborne transmission (i.e. the attributable fraction). These inputs varied by pathogen and were associated with some degree of uncertainty. We attempted to account for this in our Monte Carlo simulation.
There was more information available for some pathogens than others to develop our attributable fraction estimates. In particular, the estimates for identified enteric pathogens were derived from an expert elicitation of 31 experts [Reference Butler, Thomas and Pintar28]. The mean water attributable fractions reported in other studies for Campylobacter spp. (range: 3–11%) and Giardia spp. (range: 41–42%) are in-line with our estimates, while our mean water attributable fraction for Salmonella spp. was higher than in other studies (range: 1–5%) [Reference Vrbova9, Reference Vally49, 50]. The attributable fraction input we developed for unspecified pathogen GI illness is based on five Canadian estimates [Reference Murphy8, Reference Vrbova9, Reference Keegan35–Reference Whitfield37]. Given the lack of available estimates, we had to develop de novo attributable fraction estimates for Legionella spp., NTM and Pseudomonas spp. We based these attributable fraction estimates on available literature on environmental sources and discussion with clinical experts.
In terms of inputs for the burden analysis, administrative databases provided comprehensive counts for ED visits and hospitalisations. However, these data are collected by hospitals for financial and administrative management purposes, not specifically for tracking disease cases and causes, and so data may vary in accuracy across diseases or between medical coders [Reference Hashimoto51]. For instance, previous studies have tried to account for the underestimation and misclassification of pathogen-specific disease. In a foodborne burden of disease analysis, Thomas et al. [Reference Thomas21] applied under-ascertainment multipliers ranging from 1.3 to 16.8 to account for incompleteness in administrative data as well as underdiagnosis due to laboratory testing and test sensitivity. Using such multipliers in our analysis would likely lead to an increase in pathogen-specific burden, particularly for those pathogens that are not routinely tested for, as Thomas et al. [Reference Thomas21] found. We chose not to use such multipliers because we required a consistent analytic approach across diverse outcomes that might result from exposure to environmental hazards (e.g. air pollution) considered as part of our mandate. While our results may underestimate specific pathogens and overestimate unspecified pathogens, they also demonstrate the burden unaccounted for through pathogen-focused surveillance systems.
Our estimates likely underestimate the overall amount of waterborne disease because our approach did not include the cases of disease where medical care was not sought or include an exhaustive list of illnesses transmitted by water, such as otitis media, infections due to Vibrio spp. or free-living amoebae. The persistence of pathogenic human viruses within free-living amoeba, in particular, has recently been identified as a public health concern [Reference Atanasova52].
Other metrics may illustrate different aspects of the burden of waterborne disease. Acute GI illness cases [Reference Murphy8] will capture cases that may not result in healthcare system utilisation given their self-limited nature. Disability-adjusted life years combine mortality and morbidity into one metric, despite being difficult to interpret [Reference Hanninen23, Reference Pruss-Ustun53, Reference Rice54]. Cost estimates attempt to capture direct (e.g. medication) and sometimes indirect (e.g. lost days of work) costs associated with waterborne illness (e.g. [Reference Adam22, Reference Collier55–Reference Goring57]). Similarly, other approaches to burden estimation, like a QMRA model or epidemiological study [Reference Murphy7], may illustrate different aspects of waterborne disease. However, these approaches were not well suited to communicating to a broad lay audience. In our study, death and healthcare utilisation represent robust markers of moderate-to-severe disease and are widely understood by the public, the media and decision-makers. These metrics are also comparable across the range of environmental hazards (e.g. air pollution, temperature) in our larger environmental burden of disease project, so they were the best choice for our analysis. Although our estimates are for Ontario, we suspect they are not appreciably different from what would be found in neighbouring states and provinces and the methods we have used can be applied by others to their own jurisdiction's data.
Finally, our analysis examined population-wide health outcomes and presented plausible ranges of estimates for Ontario, which is useful for provincial-level ranking. It did not focus on sub-populations that may have unique exposure concerns. For example, many residents in Canadian Indigenous communities experience frequent drinking-water advisories, particularly where facilities rely on surface water as the source [Reference Thompson, Post and McBean58]. It should also be noted that the subset and ranking of pathogens may be different than for water, sanitation and hygiene concerns in other parts of the world, such as in low- and middle-income countries [Reference Pruss-Ustun53]. Temporal trends could be examined in future work since at least one study found lower drinking-water intake temperature was associated with a higher risk of GI illness hospitalisation in persons over the age of 65 [Reference Beaudeau, Schwartz and Levin59].
Despite these limitations, this work provides the first estimates (to our knowledge) of waterborne disease that include GI illness from unspecified pathogens and pathogens transmitted through inhalation of water aerosols, and account for the proportion of disease transmitted by water. It highlights the importance of Legionella spp., NTM and Pseudomonas spp., for which current drinking-water treatment may not be adequate to reduce the risk to water users. This work also highlights the importance of GI illness without an identified pathogen. Pathogen-based surveillance systems will not pick up these cases, though syndrome-based surveillance (e.g. tracking based on a constellation of symptoms rather than laboratory-confirmed disease) may be able to. These findings may inform studies that failed to find associations between specific pathogens and outcomes of interest (e.g. a recent study did not find specific pathogens to be associated with recreational waterborne GI illness [Reference Dorevitch60]).
Conclusions
We estimated the burden of disease from waterborne pathogens in Ontario, Canada, including GI illness that was not traced back to a particular pathogen. We identified unspecified GI illness and the opportunistic pathogens Legionella spp., NTM and Pseudomonas spp. as key contributors to waterborne disease burden. Our study can inform decision-makers about the relative importance of enteric and non-enteric infections to the waterborne disease burden, and the need to address the latter with actions on infectious water aerosols. It also provides a template for other jurisdictions wishing to undertake a similar analysis.
Supplementary material
The supplementary material for this article can be found at https://doi.org/10.1017/S0950268820000631.
Acknowledgements
The authors would like to acknowledge John Wang for his efforts obtaining the disease count data, Dru Sahai and John Minnery for their helpful review and feedback on an earlier version of this manuscript, and Samantha Akingbola for her contributions (all from Public Health Ontario). We also extend thanks for insightful clinical input from Fran Jamieson of Public Health Ontario and Ted Marras of University Health Network on NTM and from Allison McGeer and Cheryl Volling of Mount Sinai Hospital on Pseudomonas spp. This research did not receive any specific grant from funding agencies in the public, commercial or not-for-profit sectors.
Author contributions
SG, JHK and RC designed and directed the project. CD and SG prepared the input data, performed the analysis and drafted the manuscript. RF aided with the analysis and worked on the manuscript. RC and JHK provided clinical input. All authors discussed the results and contributed to the manuscript.
Conflict of interest
None to declare.
Disclaimer
The opinions, results and conclusions reported in this paper do not necessarily represent the views of the Institute for Clinical Evaluative Sciences (where the health outcome data was obtained) or Public Health Ontario.


 Open access