


INTRODUCTION
Bovine tuberculosis (TB: infection with Mycobacterium bovis) is a zoonotic disease with a worldwide distribution. It has a serious impact on livestock profitability, cattle health and welfare, and may present a risk to human health. In England and Wales, despite a variety of control measures (principally based on the test and slaughter of reactor cattle), eradication has not been achieved [1]. One impediment to this is the presence of infection in wildlife, most notably the European badger (Meles meles) which is the principal wild maintenance host of bovine TB in the UK.
Badgers are social mammals that live in stable groups of 2–23 adults, but usually around six [2]. A social group will defend a territory which may contain several setts (burrows), one of which is used as the main sett. Badgers mark the boundaries of territories with their distinctive latrines, collections of shallow pits in which they leave their faeces. Land can be surveyed for setts and latrines indicating the presence of badgers [Reference Delahay3] and hence it is theoretically possible to target particular badger groups for disease investigation and control.
Accurate recognition of the infection status of a host is likely to significantly improve the effectiveness of disease control interventions. In the case of M. bovis infection in live badgers, no gold standard diagnostic test is available. However, it is possible to combine available data on several existing but imperfect diagnostic tests and thereby increase diagnostic certainty [Reference Drewe4]. If this approach were applied at the badger group level, then targeted group-based interventions may become realistic options for M. bovis control.
Disease control measures in wildlife populations are challenging to apply owing to ecological complexities and practical difficulties, including for example, the absence of effective diagnostic tools for wild hosts. Additionally, wild animals tend to be difficult to catch and sample, meaning only a (probably biased) portion of the population (whose total size may be unknown) is available to contribute data. For example, trapping efficiencies have been estimated to range from about 35% in low-density badger populations [Reference Byrne5] up to about 70% in higher density areas [Reference Woodroffe6], meaning that up to about two-thirds of badgers may be missed. It is possible that polymerase chain reaction-based tests for M. bovis in badger faeces collected from latrines may prove useful in the future [Reference Travis7], but this approach – if sufficiently accurate, practical and cost-effective – would not necessarily result in a more complete or representative sampling of the population. Hence, decisions on population management, including how best to manage an endemic disease, are often based on incomplete information. Consequently, it would be useful to quantify the impact of variations in trapping efficiency on the ability to correctly diagnose the infection status of badger groups.
The aim of the present study was to explore and quantify the potential benefits of using three existing diagnostic tests, in isolation and in combination with one another, for the diagnosis of M. bovis infection in live badgers at the individual and group levels. This is a critical question for determining the potential value of existing tests (or those that may be developed in the future) to identify infected badger groups as part of any targeted disease control intervention. The emphasis of our study was on determining the ability to correctly detect infection in live badgers living in groups where not all individuals could be sampled, and where the prevalence of infection may vary. Analysis was conducted in two complementary parts; first, by examining the performance of tests at the individual level and then by examining test characteristics when interpreted at the group level.
MATERIALS AND METHODS
Study site and sample collection
Samples and data were collected from July 2006 to October 2013 from a population of wild badgers living in Woodchester Park, an area of southwest England which is the focus of a long-term study into badger ecology and TB epidemiology (see [Reference Delahay8, Reference Delahay9]). Badgers were trapped using steel mesh box traps deployed at active setts, baited with peanuts and set after 4–8 days of pre-baiting. Traps were located on or near to badger ‘runs’ at active setts. Trapped badgers were anaesthetized with a mixture of ketamine hydrochloride, medetomidine hydrochloride and butorphanol tartrate [Reference de Leeuw10] and on first capture each was given a unique identifying tattoo which allowed individuals to be identified thereafter [Reference Cheeseman and Harris11]. The location, sex, body weight and condition, reproductive status and age group of each animal was recorded.
Samples of faeces, urine, tracheal aspirate, oesophageal aspirate and swabs from bite wounds (where present) were collected for mycobacterial culture and up to 12 ml jugular blood was taken for serological and gamma interferon (IFN-γ) testing (see below). After recovery from anaesthesia, badgers were released at the site where they had been caught. Each social group was trapped four times per year. Trapping was suspended between 1 February and 30 April inclusive when most cubs are very young, confined to the sett, and/or totally dependent on their mother (see [Reference Woodroffe12]). During January (and, weather dependent, during December and May), when some females may be lactating, traps were checked during the night, and females deemed to be lactating or pregnant on the basis of cursory examination, were released immediately without sampling.
Ethical standards
The authors assert that all procedures contributing to this work comply with the ethical standards of the relevant national and institutional guides on the care and use of wild animals in research.
Diagnostic tests
Three diagnostic approaches for use in live badgers were considered: Stat-Pak (Chembio Diagnostic Systems, USA); IFN-γ test; and culture of clinical samples (see [Reference Drewe4] for details). Briefly, Stat-Pak identified antibodies produced in response to antigens associated with M. bovis [Reference Chambers13], giving a binary (positive or negative) test result. The IFN-γ test measured the secretion of the cytokine IFN-γ by T cells following stimulation with purified protein derivatives of bovine (PPD-B) and avian (PPD-A) tuberculin [Reference Dalley14]. Results from the IFN-γ test were available on a continuous scale as optical density (OD) readings of IFN-γ production. For each badger, an IFN-γ OD value was calculated as the amount IFN-γ response produced following stimulation with PPD-B minus the IFN-γ response produced by stimulation with PPD-A. Binary values for the IFN-γ test were produced by using an OD cut-off value of 0·044, as reported previously [Reference Dalley14]. The third test was the mycobacterial culture of clinical samples [Reference Clifton-Hadley, Wilesmith and Stuart15] with a positive result recorded for any sample from which M. bovis was isolated.
Test characteristics
The sensitivity and specificity of each diagnostic test was estimated in the absence of knowledge of true infection status using Bayesian methods [Reference Branscum, Gardner and Johnson16]. These test characteristics were estimated for each of the three tests when used in isolation and in combination with one another. Data were analysed using WinBUGS freeware [Reference Spiegelhalter17] to run a Markov chain Monte Carlo (MCMC) model containing five overdispersed chains. Priors for the sensitivity and specificity estimations of the three diagnostic tests were obtained from previously elicited expert opinion [Reference Drewe4]. Prevalence was expected to vary over the study period and so was estimated on an annual basis using uniform (0, 1) priors. Estimates of sensitivity, specificity and prevalence were generated from 50 000 posterior samples collected after a burn-in of 5000 iterations. Convergence was assessed by visual checking of trace plots of all chains for each parameter. We assumed independence between the three diagnostic tests which was considered appropriate because each test detects a different biological marker (i.e. antibody, cytokine, or bacteria [Reference Cousins and Florisson18]).
Data analysis
We modelled the empirical test result data by simulating a range of approaches to examine how much each test result influenced the diagnosis of infection in groups of live badgers. This allowed us to estimate the usefulness of each test in contributing to detection of infection at the sett or social group level. Where more than one diagnostic test was used at the same time on the same animal, two methods of interpreting test results were trialled: parallel interpretation, whereby results from all tests were considered together and an animal was categorized as infected if one or more of the tests yielded a positive result; and series interpretation, where all test results from the same animal at any given capture event needed to be positive in order for the animal to be considered infected.
A sample size of 15 animals per group was chosen as the unit for analysis in order to allow the effect of wide variations in the proportion of the group that was sampled to be explored. In reality, this number is more likely to represent the total social group size (at the higher end of the expected range in high-density populations) rather than the number of occupants of a single sett. The average number of badgers per social group in Woodchester Park has been estimated at 9·4 (range 4·9–12·4) [Reference Delahay9] and so in reality two main setts in close proximity may be considered together as the unit for this analysis. Results of tests were interpreted at an aggregated rather than an individual animal level, meaning that two or more badgers in a sett (or cluster of setts) would need to test positive in order for this ‘group’ to be considered infected. This threshold was chosen due to the imperfect specificity of some of the tests, and hence it reduced the chances of incorrectly identifying a sett as positive when, in fact, there were no truly infected animals present (see also [Reference Woodroffe, Frost and Clifton-Hadley19]).
The performance of combinations of diagnostic tests was examined across a range of values for TB prevalence from 10% to 50%. Thus the ‘true’ number of infected individuals used for comparison in each case was calculated by multiplying each prevalence level, at intervals of 10%, by the number of badgers in the group. This ‘true’ number of infected animals represents the situation that would be seen if the diagnostic tests were perfectly accurate (i.e. 100% sensitive and 100% specific).
The influence of the proportion of badgers trapped on diagnostic accuracy was another important consideration, so we tested the effects of a range of trapping efficiency values (from 10% to 100%). The results from various combinations of tests were assessed by comparing the numbers of infected animals identified by each combination of tests to the ‘true’ number of infected animals in the group (estimated at varying prevalence intervals, and each time assuming 15 animals per group as the unit of study).
Finally, we used an alternative complementary approach to examine the accuracy of the testing regimen at the group level, by calculating the herd sensitivity and herd specificity. These are epidemiological terms which refer to the ability of test(s) to correctly identify infected groups as positive and uninfected groups as negative [Reference Dohoo, Martin and Stryhn20]. In this instance ‘herd’ is taken to mean badger group, ‘herd sensitivity’ refers to the ability of diagnostic test(s) to correctly identify badger groups infected with M. bovis, and ‘herd specificity’ refers to their ability to correctly identify uninfected badger groups. Herd-level sensitivity was calculated when individual animal test results were interpreted at an aggregated (group) level. A certain (stated) number of animals was required to test positive in order for the herd to be considered positive. Herd-level sensitivities and specificities were calculated as follows (from [Reference Dohoo, Martin and Stryhn20]):
 $${\rm AP} = P \;{\ast}\; {\rm Se} + \left( {1 - P} \right)\left( {1 - {\rm Sp}} \right),$$
 $$\eqalign{{H_{\rm Se}} = 1 - \sum \nolimits_0^{k - 1} \; {\ast}\;C_{k - 1}^n \;{\ast}\; {{\rm AP}^{k - 1}} \;{\ast}\; {\left( {1 - {\rm AP}} \right)^{n - \left( {k - 1} \right)}},}$$
 $$H{_{{\rm Sp}}} = {{\rm Sp}^n}, \; {\rm when}\, k = 1,$$
 $$\eqalign{{H_{{\rm Sp}}} &= \sum \nolimits_0^{k - 1} \;{\ast} \;C_{k - 1}^n \;{\ast}\; {\left( {\rm Sp} \right)^{n - \left( {k - 1} \right)}} \;{\ast}\; {\left( {1 - {\rm Sp}} \right)^{\left( {k - 1} \right)}},\; \cr&\quad{\rm when}\; k \gt 1.}$$
where AP = apparent prevalence (refers to the proportion of animals testing positive which is usually not the same as the proportion of animals actually infected, due to false-negative and false-positive results); P = true prevalence; Se = sensitivity of a diagnostic test (or combination of tests); Sp = specificity of a diagnostic test (or combination of tests); H
Se = herd-level sensitivity (ability to detect infected groups); k = threshold number of animals required to test positive in order to consider the badger group to be infected; n = number of animals tested; $C_k^n $
= number of combinations of k positives when n animals are tested; and H
Sp = herd-level specificity (ability to correctly identify uninfected groups). H
Sp is calculated assuming infection is absent [equations (3) and (4)].
$C_k^n $
= number of combinations of k positives when n animals are tested; and H
Sp = herd-level specificity (ability to correctly identify uninfected groups). H
Sp is calculated assuming infection is absent [equations (3) and (4)].
As can be seen from these formulae, the value of H Se is directly dependent on both the apparent prevalence and the number of animals tested. Conversely, H Sp does not depend on infection prevalence, but is sensitive only to the number of animals tested and the chosen threshold number of animals required to test positive in order for a group to be considered infected. Values of H Sp provide information on how often a typical group of badgers will incorrectly be declared infected when in fact it is disease-free, using diagnostic test(s) with a given H Se. H Sp was calculated using the same scenarios as for H Se, but this time assuming that infection was absent.
Three parameters were modelled at the herd (group) level to determine their impact on the diagnosis of infection. The first parameter was the apparent prevalence of infection, which ranged from 11% to 52%. These figures equate to a true prevalence range of 10–50%, based on the MCMC estimates of test sensitivity and specificity. Second, we considered trapping efficiency (the proportion of badgers that are caught and are therefore available to be sampled), expressed as the integer number of animals sampled per group, and ranging from 2 to 15. Group size was set at 15 badgers (as before). The third parameter was the threshold (trigger) number of animals needing to test positive in order to classify a group as infected, and values ranged from 1 to 3 in the model. The upper bound was constrained by diagnostic sensitivity (if the threshold was set too high then infection would rarely be detected) and to accommodate the possibility of very low levels of trapping efficiency. In order for three badgers from a group of 15 to test positive, at least 20% would need to be sampled. In reality, a better trapping efficiency than this can be expected [Reference Byrne5, Reference Woodroffe6].
RESULTS
A total of 2022 capture (sampling) events involving 541 individual badgers were recorded and analysed in the study. Each sampling event generated results on all three diagnostic tests for one badger.
Test characteristics
The sensitivity and specificity of each test for diagnosing M. bovis infection in live badgers, estimated using Bayesian methods in the absence of knowledge of any individual's true infection status, are presented in Table 1. Sensitivity values ranged widely, from barely above zero (when all three tests were interpreted in series) up to about 0·80 (when two or three tests were interpreted in parallel). Specificity values remained high (>0·93) regardless of the method of interpretation.
Table 1. Estimated values for the sensitivity (Se) and specificity (Sp) of three diagnostic tests for the detection of M. bovis infection in individual live badgers, when the tests were used in isolation and in combination. Values estimated using Bayesian modelling of empirical diagnostic test results from 2022 sampling events involving 541 individual badgers trapped at Woodchester Park from July 2006 to October 2013

CI, Confidence interval; IFN-γ, gamma interferon.
* Separallel = 1 – (1 – Se1)*(1 – Se2) for two tests, and 1 – (1 – Se1)*(1 – Se2)*(1 – Se3) for three tests, where the subscript numbers represent the different diagnostic tests; Spparallel = Sp1*Sp2 for two tests, and Sp1*Sp2*Sp3 for three tests.
† Seseries = Se1*Se2 for two tests, and Se1*Se2*Se3 for three tests; Spseries = 1 – (1 – Sp1)*(1 – Sp2) for two tests, and 1 – (1 – Sp1)*(1 – Sp2)*(1 – Sp3) for three tests.
Ability of tests to detect infection at the group level
Initially, tests were evaluated using a theoretical TB prevalence of 20% and a group size of 15 animals. Under these assumptions, none of the tests when used singly was able to correctly identify all infected animals in the group (Fig. 1). However, in a scenario where the minimum threshold for a sett to be categorized as infected was for two individuals to test positive, then Stat-Pak would be able to detect infection at the group level if 90% of badgers were tested, and IFN-γ would be able to detect infection at the group level if 100% of badgers were tested. Within the parameters of this analysis, culture was not able to detect any infected animal (Fig. 1).

Fig. 1. The comparative ability of three diagnostic tests, when used singly and in combination (parallel interpretation), to detect badger groups infected with Mycobacterium bovis. The scenario illustrated is a simulation using the empirical data described in the main text. In this example, there were three truly infected animals in a group of 15 badgers (20% prevalence) and a minimum of two animals were required to test positive to classify a group as infected. Under these assumptions, none of the tests when used in isolation was able to correctly identify all infected animals in the group. In contrast, when Stat-Pak and gamma interferon (IFN-γ) test results were interpreted in parallel at the group level, a group could be correctly identified as infected if only 50% of the animals were tested. The addition of culture added very little to the diagnostic accuracy.
In contrast, when all three diagnostic tests were interpreted together at the group level, a badger group could be correctly identified as infected if only 50% of the animals were tested (0·5 on the x-axis in Fig. 1). Two combinations of multiple tests (Stat-Pak + IFN-γ and Stat-Pak + IFN-γ + culture) produced virtually identical results (topmost two lines in Fig. 1). This suggests that the addition of culture adds little to the diagnostic accuracy of the remaining tests for TB in live badgers.
Effect of variations in trapping efficiency and prevalence
The influence of the interplay between trapping efficiency and infection prevalence on the ability of tests to correctly detect infected badger groups was modelled. Of the three diagnostic tests investigated, only Stat-Pak can currently be conducted in the field, and hence this test was the focus of these analyses. Under the requirement that ⩾2 badgers must test positive in order for an infected group to be correctly identified as infected, Stat-Pak could achieve this only when a large proportion of the group were sampled and prevalence was high (Fig. 2a ). For example, if prevalence was 20%, then the entire group would need to be sampled in order to be able to achieve the required number of badgers testing positive. The required sample size reduced as prevalence increased so that at 30% prevalence, two thirds of the group needed to be tested, at 40% prevalence, half the group needed to be tested and at 50% prevalence, 40% of the group needed to be tested. Where prevalence was <20%, Stat-Pak was unable to correctly identify an infected group (Fig. 2a ).
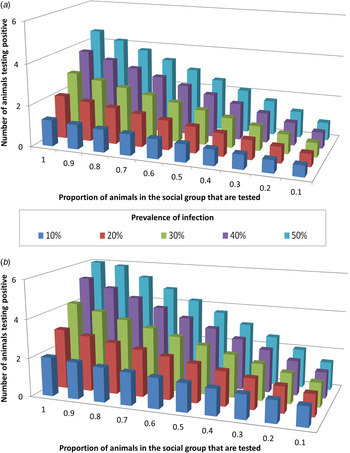
Fig. 2. The influence of Mycobacterium bovis infection prevalence and the proportion of a badger group that is sampled, on the ability of diagnostic tests to identify infected badger groups. Graphs show the number of badgers identified as test-positive across different values of background tuberculosis prevalence, using (a) Stat-Pak in isolation, and (b) Stat-Pak and gamma interferon (IFN-γ) tests in combination (parallel interpretation). In this scenario, which is a simulation using empirical data, two animals were required to test positive in order to identify infection in a group of 15 animals. The combination of IFN-γ and Stat-Pak was able to correctly identify group-level infection status at any prevalence level, but if true prevalence was low (10%) then a high proportion (90%) of the group needed to be tested. In contrast, Stat-Pak alone was unable to correctly identify an infected group when true prevalence was <20%, even if the entire group was tested.
Diagnostic ability was improved by combining Stat-Pak with IFN-γ and interpreting the results in parallel. In this scenario, both tests were run on every sampled animal and if either gave a positive result then it was considered positive. As before, it was necessary for ⩾2 badgers to test positive in order for a group to be identified as infected. The combination of IFN-γ and Stat-Pak was able to correctly identify group-level infection status at any prevalence level if at least 90% of a badger group was tested (Fig. 2b ). The main advantage of using both tests together over using Stat-Pak alone was that a group could be correctly identified as infected at lower (but not very low) prevalence levels. Hence, whereas Stat-Pak alone was unable to correctly identify an infected badger group where the background prevalence was <20% even if the entire group was tested, the addition of IFN-γ meant that an infected group could be detected even when prevalence was as low as 10% (Fig. 2). Furthermore, using this combination of tests enabled an infected group to be correctly identified when prevalence was 20% even when only half of the group were tested (compared to the requirement to test the entire group if using Stat-Pak alone). At 30% prevalence, one third of the group would need to be tested (compared to two thirds of the group with Stat-Pak alone), at 40% prevalence, one quarter of the group would need to be tested (compared to half of the group with Stat-Pak alone), and at 50% prevalence, 20% of the group would need to be tested (compared to 40% of the group with Stat-Pak alone). However, if prevalence dropped below 10%, then the entire group would need to be sampled in order to be able to achieve the required number of badgers testing positive when using Stat-Pak and IFN-γ in combination (Fig. 2).
Impact of false-positive results
It is important to note that because of the imperfect specificity of the tests some positive results were likely to in reality be uninfected false positives, and the impact of this potential problem increased as both (1) the prevalence decreased (resulting in a reduction in the positive predictive value, defined as the proportion of positive test results that are true positives) and (2) the proportion of the group that was sampled decreased. For example, based on the estimates in Table 1, at a relatively high prevalence level of 50%, if 100% of a group was tested, only one in 20 badgers that tested positive would be a false positive. At 20% prevalence the false-positive rate rose to one in five test-positive badgers, and when prevalence was ⩽10%, the false-positive rate was one in three test-positive badgers. The impact of false-positive results increased as the proportion of the group that was tested decreased, such that with a prevalence level of 20% the false-positive rate would be one in four test-positive badgers if 70% of the group were tested, one in three test-positives if 50% were tested and one in two test-positives where only 30% of the group was tested.
Group-level sensitivity
Estimates of sensitivity and specificity at the group level (estimated using the herd-level approach) supported our earlier findings at the individual animal level. The highest values of group-level sensitivity (H Se) for Stat-Pak and IFN-γ when used singly or combined in parallel were observed where prevalence and the proportion of badgers tested were highest (Fig. 3). The highest group-level sensitivity values were obtained when a single badger was required to test positive, but this was at the expense of reduced group-level specificity (i.e. there was an increased risk of incorrectly declaring an uninfected group as infected; Fig. 3). Increasing the threshold for a positive diagnosis at the group level (i.e. more badgers are required to test positive before a group is considered infected) reduced the chance of false positives but also led to lower group-level sensitivity (Fig. 3). Similar to our earlier analysis (Table 1), sensitivity at the group level was higher when Stat-Pak and IFN-γ were interpreted in parallel, than when either was used in isolation. This difference was most pronounced at lower levels of M. bovis prevalence (Fig. 4).

Fig. 3. Effects of variations in prevalence, proportion of badgers sampled, and the threshold (minimum number of badgers required to test positive) for concluding that a badger group is infected, on the group-level sensitivity and specificity of diagnosis of Mycobacterium bovis infection in badgers. Coloured lines = group-level sensitivity at different levels of infection prevalence; black lines = group-level specificity. Note that group-level specificity does not vary with prevalence. The examples shown involve the combined use of Stat-Pak and gamma interferon (IFN-γ) with their results interpreted in parallel. Data shown based on a group size of 15 badgers.

Fig. 4. Variation in group-level sensitivity across a range of infection prevalence values for three different approaches to diagnosing Mycobacterium bovis in badger groups. The scenario shown is based on 50% of badgers in a group being tested, with a threshold of two animals required to test positive for the group to be considered infected. Where two tests are used togther, results are interpreted in parallel. IFN-γ, Gamma interferon.
Group-level specificity
Values of group-level specificity (H Sp) increased as the threshold number of badgers required to test positive increased. For example, when interpreting Stat-Pak and IFN-γ in parallel (when 50% of the group was tested), the group would be incorrectly declared as infected 38% of the time when using a threshold of just one badger required to test positive, but only 9% of the time if at least two positive animals were required (Fig. 3). Conversely, group-level specificity decreased as the proportion of the group that was tested increased (recall that H Sp is calculated assuming the absence of infection, hence any positive results are considered to be false positives and the frequency with which they occur increases with sample size). High values of group-level specificity (>95%) were obtained when 40% of the group was tested and a threshold of two test-positive badgers was used (Figs 3 and 5).

Fig. 5. The influence of the proportion of a badger group that is sampled and the choice of test(s) on group-level specificity for diagnosing Mycobacterium bovis. In this example, a threshold of two animals testing positive is required for a group to be considered infected. Where two tests are used togther, results are interpreted in parallel. Note that the y-axis is truncated. IFN-γ, Gamma interferon.
The H Sp achieved when using Stat-Pak and IFN-γ tests together and interpreting results in parallel was lower than that achieved when either test was used in isolation at any threshold value (Fig. 5). The opposite was true if the two tests were used together but the results were interpreted in series (i.e. both tests needing to be positive for an animal to be considered infected) due to the perfect specificity of this diagnostic approach (Table 1). However, this absence of false positives came at the expense of a high probability of false-negative results (i.e. reduced sensitivity resulting in missing cases of true infection: Table 1).
DISCUSSION
We modelled empirical data from a long-term study of TB epidemiology in a wild badger population to explore the effects of infection prevalence, trapping efficiency and use of three different diagnostic tests on the ability to detect M. bovis infection in groups of badgers. The sensitivity (ability to detect infected individuals) of all three diagnostic tests was low when each test was used in isolation. Even the most sensitive test (Stat-Pak) would be expected to miss about 40% of infected badgers. This level of false-negative test results would be expected to seriously limit the effectiveness of any disease control programme which used the Stat-Pak (or a test of similar sensitivity) as the sole means of detecting infection in individual live badgers.
There was little difference in the specificities of the Stat-Pak, IFN-γ test or the culture of clinical samples, as all were within the range of 97–100%, and are comparable to previous estimates [Reference Chambers21]. This suggests that when used individually, no test would be expected to have a false positive rate >3%, and positive results can be considered to be reliable.
Parallel interpretation of the results of tests used in combination was adopted because this improved sensitivity, by multiplication of individual tests sensitivities. In contrast, the specificity of a combination of tests was lower than that of individual tests. Series test interpretation was also investigated but although it improved the specificity of tests, this was at the cost of markedly lower sensitivity (Table 1) and consequently the risk of missing cases of infection was unacceptably high.
The methods used to estimate the sensitivity and specificity of each diagnostic test (Bayesian latent class analysis [Reference Branscum, Gardner and Johnson16]) did not require knowledge of true infection status. The figures quoted in the present study can be considered an update on the estimates previously published by Drewe et al. [Reference Drewe4] which were based on the same methods and used the same model priors. There are two notable differences in the estimates produced in the current study from those reported previously by Drewe et al. [Reference Drewe4] and Chambers et al. [Reference Chambers21], the latter who calculated sensitivity and specificity by comparing test results to culture of M. bovis from tissues collected during detailed necropsies. First, in the current analysis the Stat-Pak was estimated to be slightly more sensitive than previously calculated (i.e. 58% in the current analyses vs. 50% in Drewe et al. [Reference Drewe4] and 50% (adults) and 56% (cubs) in Chambers et al. [Reference Chambers21]). Second, the sensitivity of the IFN-γ test in the present study was estimated to be markedly lower than previously calculated (i.e. 52% in the current analyses vs. 80% in Drewe et al. and 85% (adults) and 57% (cubs) in Chambers et al.). The likely explanation for differences between the findings of Drewe et al. and those of the current study is the larger sample size which would be expected to increase precision; Drewe et al. [Reference Drewe4] was based on fewer test results (875 capture events of 305 badgers caught over 2 years), whereas the current study involved results from 2022 capture (sampling) events involving 541 individual badgers caught over 7 years. Further, the method used by Chambers et al. [Reference Chambers21] of estimating sensitivity and specificity by comparing the results of Stat-Pak and IFN-γ tests with tissue culture is likely to overestimate test sensitivity because culture is itself of limited sensitivity, even when performed on necropsy tissues [Reference Crawshaw, Griffiths and Clifton-Hadley22]. Although Chambers et al. employed a comprehensive necropsy, histology and extended culture method, this is unlikely to have had perfect sensitivity and this could be sufficient to account for the apparent discrepancy with estimates from the present study.
The implications of our findings are that the interpretation of IFN-γ and Stat-Pak test results in parallel would be advisable during the initial stages of a disease control programme when prevalence is high, because in this scenario the proportion of test positives that are true positives is highest and the proportion of false positives is at its lowest. At this stage, where detection of infection is important, a diagnostic approach with a high negative predictive value (i.e. the proportion of negative test results that are truly uninfected) is likely to be preferred. As the control programme progresses so higher specificity becomes more important, to minimize the false-positive fraction by correctly identifying all negative animals, and a diagnostic approach with a high positive predictive value is likely to be preferred. As the prevalence of infection is reduced, as would hopefully be the case later during the disease control programme, then it becomes increasingly undesirable to have high numbers of false positives, particularly in relation to demonstrating freedom from infection. The desired sensitivity and specificity of diagnosis [and therefore the choice of which test(s) to use] should therefore be chosen in relation to the objectives of intervention and the stage of the disease control strategy.
Importantly, sensitivity analyses suggested that for the combination of IFN-γ and Stat-Pak tests to provide accurate results at the group level (where a group consists of 15 badgers in either a single sett or a cluster of nearby setts), estimates of trapping efficiency derived from the Randomized Badger Culling Trial of 35–70% [Reference Smith and Cheeseman23] would be sufficient when infection prevalence levels are moderate or high (i.e. prevalence is in the region of 15–30%, as might be expected at the start of a disease control programme). However, as prevalence was reduced to <10%, a higher proportion of the group residents would need to be sampled in order to accurately detect infected groups. Because the size of badger social groups in our study population was relatively large compared to other regions and countries (e.g. in upland and moorland areas of Scotland and Northern Ireland, there are about three badgers per social group [Reference Reid24]), it might not initially appear to be straightforward to apply our findings to areas where badger groups are smaller. We do not consider this to be a major limitation, however, because several nearby small groups could be treated as a cluster for analytical purposes (as we did here: 15 animals per ‘group’ were used simply to make it easier to interpret results in terms of whole animals).
These findings help inform us on the desired characteristics that we may seek in novel diagnostic tests for use in selective management of TB in badger populations. Hence, in order to improve on diagnostic performance at the group level beyond that potentially provided by existing tests, the sensitivity of any new test would need to be >80% (the level achieved when using Stat-Pak and IFN-γ in combination). Such a high level of sensitivity is likely to be difficult to achieve with a single test without compromising specificity, and hence the use of a combination of two (or even three) independent tests with slightly higher sensitivities than Stat-Pak or IFN-γ has the potential to make a substantial practical difference in our ability to detect infection in badger groups. For example, if a diagnostic sensitivity of 90% could be achieved, this would allow a group to be correctly identified as infected when as few as 10% of badgers were tested (under the model assumptions of 20% prevalence and a group size of 15 badgers, and with the same threshold of two badgers required to test positive). The benefits of increased sensitivity include a reduction in the proportion of badgers that need to be tested and the ability to detect infection at lower prevalence.
In conclusion, of the options investigated, the most sensitive and specific diagnostic approach to detect M. bovis in badgers at the group level using tests which are currently available would appear to be to use the Stat-Pak and IFN-γ tests together, interpret their results in parallel, and use a threshold of two badgers required to test positive. Importantly, this would appear to be achievable at levels of trapping efficiency that have been observed in previous field studies, meaning that not every badger needs be tested. However, there are considerable practical challenges to this approach given the requirement for blood samples to be rapidly transported to specialist laboratory facilities with experienced staff to run the IFN-γ test. In contrast, the Stat-Pak is available in a rapid test format akin to a pregnancy test and can be conducted in about 30 min in the field. In contrast, the 16–24 h required to get a IFN-γ test result is likely to be impractical for real-time management interventions in the field. However, if Stat-Pak was used as the first (screening) test and ⩾2 positive results are obtained, then the group would be considered infected and there would be no requirement for the IFN-γ test to be run in such circumstances. An alternative, if one were prepared to accept a lower diagnostic sensitivity, would be to use the Stat-Pak alone. This would mean higher numbers of badgers would need to be tested in order to detect infection and our model suggests Stat-Pak would struggle to detect infected badger groups at prevalences below ~20%. Notwithstanding questions of cost-effectiveness and field readiness, in order to improve diagnostic performance at the same scale, any new test developed in the future would need to be more sensitive than the IFN-γ test while maintaining a sufficiently high specificity. Even better would be a single test that is more sensitive than the combined use of Stat-Pak and IFN-γ.
ACKNOWLEDGEMENTS
This research was funded by Defra (project SE3265). RVC manuscript number: PPH_01113.
DECLARATION OF INTEREST
None.


