


1. Introduction
Although forest fires are considered an integral part of many ecosystem dynamics around the world, the severity and the length of the fire season in several areas of the world is expected to increase substantially due to climate change (IPCC, 2014). Higher temperatures will be associated with earlier and dryer springs, while rarer rains will lead to drier and more flammable vegetation (Yohe and Schlesinger, Reference Yohe and Schlesinger2002; Marques et al., Reference Marques, Borges, Garcia-Gonzalo, Moreira, Carreiras, Oliveira, Cantatinha, Botequim and Pereira2011). As a result, wildfires, droughts, storms and other natural disruptions will increasingly become major causes of life and property losses globally, present a challenge regarding the sustainability of the ecosystem services provided to society, and increase the likelihood of conflicts (Maystadt et al., Reference Maystadt, Calderone and You2015; FAO, 2016).
The Mediterranean region is one of the areas in the world most vulnerable to climate change (Santos et al., Reference Santos, Stigter, Faysse and Lourenςo2014). The climate of this region is characterized by mild winters and warm, dry summers, but will change as extreme weather events such as droughts, heat waves, fires and floods become more frequent. In fact, most climate change scenarios forecast an increase in temperature and a decrease in precipitation in the Mediterranean region (García-Ruiz et al., Reference García-Ruiz, Lopez-Moreno, Vicente-Serrano, Lasanta-Martınez and Beguerıa2011). Greece, Italy, France, Croatia, Spain and Portugal are already experiencing the consequences of climate change. In these countries the number of wildfires has increased considerably. In fact, about half of the largest fires in Europe in the last decade were in Spain and Portugal, destroying around 90,000 hectares of forest per year (Hoinka et al., Reference Hoinka, Carvalho and Miranda2009).
For many countries in the world, the tourism sector is an important driver of economic development, and this is worrisome because this sector is especially vulnerable to increasing risks of forest fires. While the immediate consequences of forest fires are easily visible, namely in the destruction of property values and the direct negative impact on recreation values (Vaux et al., Reference Vaux, Gardner and Mills1984), the computation of the full economic costs associated with lower tourist arrivals in the future is a challenging task. An increased number of fire threats makes the endangered areas less attractive for tourists, which, in turn, leads to a negative impact on local businesses. These may include small, medium and large scale businesses such as hotels, restaurants, transportation services and museums, which are important contributors to the local economies (Cioccio and Michael, Reference Cioccio and Michael2007; Brida and Risso, Reference Brida and Risso2009; Seetanah, Reference Seetanah2011; Becken and Hughey, Reference Becken and Hughey2013).
In this study we focus on the particular case of Portugal. The tourism sector represents an important portion of GDP and employment (almost 10 per cent each) and climate change scenarios suggest that the severity of forest fires will increase (Marques et al., Reference Marques, Borges, Garcia-Gonzalo, Moreira, Carreiras, Oliveira, Cantatinha, Botequim and Pereira2011). The combination of these two factors makes Portugal a valuable case to study. The objective is to estimate the impact of the increasing risk of forest fires on the tourism industry in Portugal.
Using data from 2000 to 2016 on 278 municipalities, we estimate the impact of burned areas on the number of inbound and domestic tourists. We go beyond the traditional impact analysis and provide predictions for 2030 and 2050. To the best of our knowledge, there are no reported studies addressing the impact of climate change and fires on tourism at such a fine scale within a country.
We find that burned areas have a considerable negative impact on the number of tourist arrivals. Under the A1B scenario for future burned area projections, results show that in 2030 most municipalities will face a reduction in domestic and inbound tourist arrivals up to 2 and 0.5 per cent, respectively.Footnote 1 This situation will be aggravated in 2050 when the reduction in domestic and inbound tourist arrivals for most municipalities will range between 2–4 per cent and 0.5–1 per cent, respectively. Overall, the estimated annual costs to the Portuguese economy due to the impact of increased burned areas in the year 2030 range between €17.03 and 24.18 million for domestic tourist arrivals and between €18.26 and 38.08 million for inbound tourist arrivals, depending on the assumptions made about overall growth of the tourism sector. In 2050, those costs will increase by a factor of at least four.
This paper is organized as follows. Section 2 describes the case study and section 3 reviews the literature. The methodology is presented in section 4 and the data in section 5. Section 6 presents the estimation results. The final section, section 7, offers conclusions and discusses the avenues for future research.
2. Case study
Continental Portugal is located between 37°N and 42°N latitude and 6°W and 10°W longitude in the Iberian Peninsula, which is the southwestern corner of Europe. Portugal shares the border with Spain on its eastern side and has the Atlantic Ocean on the west. The capital city of Portugal is Lisbon and the second largest city is Porto. The country also includes the archipelagos of the Azores and Madeira in the Atlantic Ocean. Based on the census of 2011, the population of Portugal was about 10.5 million inhabitants. The area covers 92,212 km2. The average annual temperature ranges between 7 °C and 18 °C and the amount of rainfall is between 400 and 2,000 mm. Regarding vegetation, one-third of Portugal is covered by forests and woodlands and one-quarter by shrubs (see Marques et al., Reference Marques, Borges, Garcia-Gonzalo, Moreira, Carreiras, Oliveira, Cantatinha, Botequim and Pereira2011). In fact, as argued by Bento-Gonçalves et al. (Reference Bento-Gonçalves, Vieira, da Vinha and Hamada2018), a large area of mainland Portugal is occupied by forests. Many important tourist destinations such as seasides, lakes, UNESCO world heritage sites, national parks and many hotel establishments are very close to forests, as described in Moreira (Reference Moreira2018).
Portugal is a country with a long history, starting as an independent state in the beginning of the twelfth century. Currently it has 15 UNESCO World Heritage Sites, ranking Portugal in this regard 17th in the world, out of 167 countries.Footnote 2 Given the appeal and cultural diversity of the country, Portugal attracts many tourists from around the world, and the tourism industry is an important pillar of the Portuguese economy. In 2016 tourism in Portugal directly contributed 9.2 per cent of GDP and 9 per cent of the total employment, generating a total of €12.7 billion in international tourism revenues. This is the second highest place as a percentage of GDP among the OECD countries, just after Spain (OECD, 2018). Also, tourism is the largest export industry, constituting 16.7 and 48.3 per cent of total exports and service exports, respectively.
Changes in climate became evident in Portugal as early as the end of the nineteenth century (Carvalho et al., Reference Carvalho, Schmidt, Santos and Delicado2014). Since then the annual precipitation has been falling while the annual temperature has been increasing. Moreover, temperature in Portugal is above the global mean and heat waves have become more frequent and pronounced. As a result, weather conditions and fuel loading are today the main causes of forest fires in Portugal (Hoinka et al., Reference Hoinka, Carvalho and Miranda2009). In the last decades forest fire severity has increased and climate change scenarios suggest that this trend will continue (Marques et al., Reference Marques, Borges, Garcia-Gonzalo, Moreira, Carreiras, Oliveira, Cantatinha, Botequim and Pereira2011).Footnote 3
3. Literature review
The incidence of forest fires has increased in the Mediterranean region (see Pereira et al., Reference Pereira, Trigo, Camara, Pereira and Laite2005; Pausas et al., Reference Pausas, Llovet, Rodrigo and Vallejo2008; and Marques et al., Reference Marques, Borges, Garcia-Gonzalo, Moreira, Carreiras, Oliveira, Cantatinha, Botequim and Pereira2011). A number of studies show that forest fires in Portugal can be explained by changes in weather conditions such as the number of days with extreme fire hazard weather (Viegas and Viegas, Reference Viegas and Viegas1994; Pereira et al., Reference Pereira, Trigo, Camara, Pereira and Laite2005; Gomes and Radovanovic, Reference Gomes and Radovanovic2008). This is also supported by Pereira et al. (Reference Pereira, Trigo, Camara, Pereira and Laite2005) who state that two-thirds of fires in Portugal are due to changes in weather conditions. As stated by Marques et al. (Reference Marques, Borges, Garcia-Gonzalo, Moreira, Carreiras, Oliveira, Cantatinha, Botequim and Pereira2011), the burned area reached about 40 per cent of Portugal in the 1975–2007 period. Gomes (Reference Gomes2006) also highlights that wildfires affect much of the territory in Portugal, leading to substantial economic, social and environmental impacts. However, determining the resulting total economic loss and the impacts on local economies is a challenging task.
A growing body of literature presents evidence on the consequences of fire for the tourism industry. Yet, to the best of our knowledge, all of them are case studies. For instance, the 2003 summer in Canada was dry and hot, leading to about 2,500 forest fires. The estimated costs of those fires in terms of property losses and costs of fighting amounted to about 700 million Canadian dollars (Hystad and Keller, Reference Hystad and Keller2006).
Hystad and Keller (Reference Hystad and Keller2006) conduct an interview of businesses related to tourism in the region of Kelowna in British Colombia, Canada, where the largest fire occurred in 2003. They find that the tourism industry experienced considerable losses in the subsequent months. In the follow-up study, Hystad and Keller (Reference Hystad and Keller2008) explore the long-term impact of this fire. They find that in 2004 about 20 per cent of businesses were still experiencing the negative impact, while in 2005 it was still about 5 per cent. This emphasizes that fires may have a long-lasting impact on local businesses.
In 2003, bushfires greatly damaged the regional tourism industry in Victoria, Australia, where some tourist operators lost their livelihoods and others had to close their businesses (Cioccio and Michael, Reference Cioccio and Michael2007). Over a three-month period about 1.1 million hectares of National Park lands were burned. In the face of such a threat, many tourists left the region or postponed their visits. This led to the loss of US$20 million during the first month alone and affected more than 1,000 tourism businesses.
Rahn (Reference Rahn2009) reviews wildfire history from 1978 to 2002 in California, in the US. The author points out that, in order to estimate the economic loss, five indicators – state (i.e., costs of suppression), infrastructure (i.e., replacement costs), natural areas (i.e., species, habitats and ecosystem services), community (i.e., lives, health, homes and quality of life), and businesses – have to be considered. The last indicator is used to estimate the impact of fires on economic activity (i.e., employees do not work during those days, costs related to shipping and distribution, air transportation), employment impacts (i.e., businesses may incur costs related to unemployment insurance claims), building and property loss (i.e., buildings, materials and equipment might be lost or damaged), tourism impacts (i.e., diminished visitors' spending). Overall, the share of business activity loss is only one-third of the total.
Kountouris and Remoundou (Reference Kountouris and Remoundou2011) explore the relationship between the individual life satisfaction and fires in Spain, France, Italy and Portugal. The authors find that burned areas as well as large- and medium-scale fire incidents substantially decrease the life satisfaction of individuals. Moreover, the authors point out that fires affect the emotional state of other people who were not directly affected by such disasters. Kountouris and Remoundou (Reference Kountouris and Remoundou2011) and Maida et al. (Reference Maida, Gordon, Steinberg and Gordon1989) explain this negative relationship by the consequences of fires on psychological disorders (i.e., depression, sleep disorders, etc.) and, in extreme cases, with loss of lives. In addition, Maida et al. (Reference Maida, Gordon, Steinberg and Gordon1989) state that the media coverage of fires affects the psychological conditions of individuals. Thus, we may conclude that fires affect not only ‘forest’ tourists, those who use forest-type products and services only, but also other tourists who conduct different activities.
Thapa et al. (Reference Thapa, Cahyanto, Holland and Absher2013) explore the impact of wildfires on tourists' behavior in Florida, US. The authors find that 25 per cent of tourists in their sample are willing to cancel a trip in the presence of wildfires and 42 per cent are most likely to cancel. The authors point out that wildfires negatively affect residential communities and the tourism industry. The lodging sector experienced US$61 million losses and other sectors lost about US$77 million due to the historic fire in Florida in 1998 (Butry et al., Reference Butry, Mercer, Prestemon, Pye and Holmes2001).
There are a number of studies on the impact of fires on recreational demand. For instance, Boxall and Englin (Reference Boxall and Englin2008) examine the impact of forest fires on recreational activity such as canoeing in the Canadian Shield region. The authors find a negative impact on the number of canoe trips in this area in the first years following a fire. Hilger and Englin (Reference Hilger and Englin2009) confirm this finding, exploring the impact of the 40,000 acre Rat Creek Hatchery forest fire on the recreational demand within the Alpine Lakes Wilderness Area.
Hesseln et al. (Reference Hesseln, Loomis and Gonzáles-Cabán2004) also find that forest fires decrease hiking demand at National Forests in Colorado and Montana. On the other hand, Loomis et al. (Reference Loomis, Gonzáles-Cabán and Englin2001) find that forest fires increase the post-fire hiking demand and decrease mountain biking demand at National Forests in Colorado. This controversial effect is due to the fact that bikers need to dismount and carry their bikes over large logs which is not an issue for hikers. Note that Hilger and Englin (Reference Hilger and Englin2009) also point out that post-fire recreational demand may, in fact, increase. However, the authors highlight that this increase occurs if the post-fire ecosystem recovers and there are no frequently repeated fires.
4. Econometric model
In this section we present the models to estimate the relationship between (1) burned areas and the number of tourist arrivals in a particular municipality, and (2) temperature, precipitation and burned areas.
Due to data confidentiality, the Portuguese Statistical Office (see www.ine.pt) presents the number of tourist arrivals only for those municipalities that have more than three hotels. Thus, using only these data in the analysis creates a sample selection problem since the information on some municipalities is non-randomly missing. Ignoring this problem would bias the estimates and might lead to incorrect conclusions. To cope with this issue, we apply Heckman's sample selection model (Heckman, Reference Heckman1979). The estimation method consists of two steps. In the first, we estimate the selection equation with a binary dependent variable that equals one when the number of tourist arrivals is observed in a particular municipality and year, and zero when it is missing. This equation includes as an independent variable the number of hotels in a particular municipality and the year that which is causing the selection problem. The complete selection equation to be estimated is a probit model with fixed effects as suggested by Fernández-Val and Weidner (Reference Fernández-Val and Weidner2016). This equation can be written as:

where the subscripts i and t stand for a municipality and year, respectively. ${Z_{it}}$ is a binary variable and equals one if the number of tourist arrivals is observed in a particular municipality i and year t. $Hotel{s_{it}}$
 is the number of hotels. ${X_{it}}$
 is a vector of explanatory variables including the share of burned area in the current and past year, population density and crime rate.Footnote 4 The terms ${\mu _i}$
 and ${\omega _t}$
 are municipality and time fixed effects, respectively; ${\vartheta _{it}}$
 is the error term; and ${\delta _0}$
 , ${\delta _1}$
 and ${\boldsymbol{\Psi} }$
 are parameters to be estimated.
Using the estimated probit model, we compute the following ratio for each municipality and year:

where $\phi (\cdot )$ and $\Phi (\cdot )$
 are the normal probability density and cumulative distribution functions, respectively. $Lambd{a_{it}}$
 is also known as the inverse Mill's ratio.
In the second step we estimate the main equation, in which $Lambd{a_{it}}$ is included as an additional regressor to correct the selection problem. For this case, we adopt a panel linear regression model with fixed effects as suggested by Vogelsang (Reference Vogelsang2012). This model is robust to heteroskedasticity, autocorrelation and spatial correlation. The equation is:

where $Arrival{s_{it}}$ stands for the number of tourist arrivals. The lagged dependent variable captures habit persistence or ‘word of mouth’. That is, when people visited a site and liked it, they may revisit it or spread information about the site and recommend it to friends and relatives (Witt and Witt, Reference Witt and Witt1995). $Popde{n_{it}}$
 and $Crim{e_{it}}$
 stand for population density and crime rate, respectively. As Hamilton (Reference Hamilton2003) and Onofri and Nunes (Reference Onofri and Nunes2013) point out, these variables represent the economic development of a region. $Burned\; Are{a_{it}}$
 and its lag stand for the share of burned area that includes burned forest and shrub.Footnote 5
It might be the case that the trends in tourism and economic outcomes in certain municipalities correlate with burned areas. Thus, to control for this over the period studied, we introduce municipality-specific trends, ${\theta _i}t$ , where ${\theta _i}$
 are municipality specific trend-slopes and t is the linear time trend. This municipality-specific trend may affect the outcome of interest and might correlate with burned areas. For instance, Otrachshenko et al. (Reference Otrachshenko, Popova and Solomin2017, Reference Otrachshenko, Popova and Solomin2018, Reference Otrachshenko, Popova and Tavares2021) include the regional time trend when estimating the relationship between temperature and mortality in Russia, and Deschênes and Greenstone (Reference Deschênes and Greenstone2011) include state-year effects when estimating the same relationship for the US.
The terms ${\gamma _i}$ and ${\mu _t}$
 are the municipality and time fixed effects, respectively. The municipality fixed effects control for time invariant unobserved regional characteristics that may affect the number of arrivals (i.e., landscape, the area of a municipality, infrastructure, the presence of coastline, the number of cultural heritage attractions, etc.). The time fixed effects control for any common changes across municipalities. For instance, the tourism boom experienced during the 2003–2007 period or the financial crisis in 2008 (Witt and Witt, Reference Witt and Witt1995; Otrachshenko and Bosello, Reference Otrachshenko and Bosello2017). Finally, ${e_{it}}$
 is the error term.
In order to make predictions for the number of tourist arrivals that will be affected by burned areas in 2030 and 2050, we estimate the relationship between weather conditions and burned areas. We use a panel data model with fixed effects as described by the following equation:Footnote 6

where $Tem{p_{it}}$ and $Preci{p_{it}}$
 represent the average temperature in Celsius (°C) and amount of precipitation in millimeters (mm) during the third quarter (July–September), the period when fires are most frequent in Portugal. All other explanatory variables have the same explanation as above.
5. Data
In this study we use data on the number of tourist arrivals, the share of burned areas, population density and crime rate in 278 municipalities from Statistics Portugal (INE) from 2000 to 2016 (INE, 2018). The data on the number of inbound and domestic tourists account for arrivals at different types of establishments such as hotels, hostels, pensions and others. Burned areas include forest and shrub lands. Population density is the number of people per km2. Crime rate is the number of crimes per 1,000 inhabitants.
The weather data are taken from the National Water Resources Information System (SNIRH, 2019). This database includes about 790 ground stations located across Portugal. Temperature and the amount of rainfall are measured in Celsius (°C) and millimeters (mm), respectively.
6. Estimation results
In this section we present and discuss estimation results. The section is divided into three parts. In the first, we show the results on the impact of burned areas on the number of domestic and inbound tourist arrivals for each municipality. In the second, the impact of temperature and precipitation on the share of burned areas and its future projections in 2030 and 2050 are presented. In the third, we compute losses in terms of the number of domestic and inbound tourist arrivals due to the future projected burned areas.
6.1 Impact of burned areas on tourism
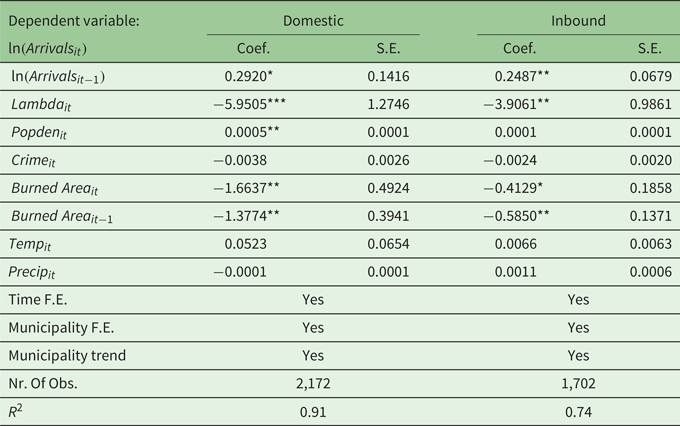
Table 1 presents the results of the impact of burned areas on the number of tourist arrivals. As shown, the lag of the dependent variable is significant in all equations, suggesting the strong effect of ‘word of mouth’. That is, tourists may spread information about the place visited to others. Also, tourists who have visited a particular place and liked it, may visit it again in the next period. It is estimated that, ceteris paribus, a 1 per cent increase in visitors in the current year contributes on average to a future increase in domestic and inbound tourist arrivals by 0.29 and 0.25 per cent, respectively.
Table 1. Impact of burned areas on the number of tourist arrivals
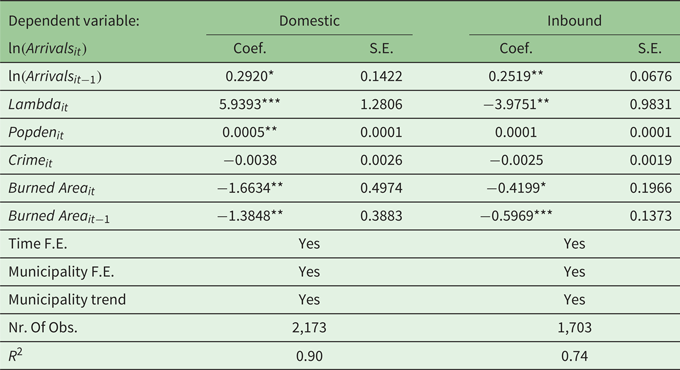
Notes: ***, **, and * stand for 1 per cent, 5 per cent, and 10 per cent significance levels, respectively. Coef. and S.E. stand for the estimated coefficients and for standard errors, respectively. Standard errors are robust to heteroskedasticity, autocorrelation, and spatial correlation. F.E. stands for fixed effects. Lambda is the Mill's inverse ratio from equation (2).
The estimated coefficient on $Lambd{a_{it}}$ is significant in all equations, indicating that the correction in the presence of non-random missing values is required. In fact, the coefficients estimated on the main explanatory variables are larger without the Heckman procedure for both domestic and inbound arrivals, indicating the presence of upward biases. The coefficients on population density ($Popde{n_{it}}$
 ) and crime rate $(Crim{e_{it}})$
 have an expected sign but they are either marginally or not statistically significant.
The sign and significance of the coefficients on the burned areas of the previous and current periods suggest a considerable impact on the number of domestic and inbound tourist arrivals. Overall, a 1 per cent increase in burned areas in a given year reduces the number of domestic and inbound tourist arrivals in that year and in the following year by 3.53 and 1.12 per cent, respectively.Footnote 7 Interestingly, the impact of burned areas is quite persistent in all estimated models: the current impact constitutes less than half of the total cumulative impact. This confirms that fires may be associated with psychological disorders (i.e., depression, sleep disorders, etc.) and the likelihood of losing life. People who have visited a place and faced such a threat might not want to visit this place in the subsequent period. This finding is of particular interest to policy makers since it suggests that the current period burned areas also affect the future number of visitors. As a result, government and local businesses should not ignore this risk in management and investment decisions.
6.2 Burned areas and weather conditions
As discussed in the previous section, the many burned areas in Portugal are largely due to changes in weather conditions. Table 2 presents the impact of temperature and precipitation in the third quarter on the annual share of burned areas. As shown, estimates on both temperature and precipitation are statistically significant. If temperature increases by 1 °C during the third quarter of the year, the share of burned areas increases by 0.14 per cent. Regarding the precipitation variable, we find that the reduction in the amount of rainfall by 10 mm increases the share of burned areas by 0.1 per cent. These weather factors contribute to an additional 12,909 and 9,921 hectares burned, respectively, which in total represent approximately 20 per cent of the average annual burned area in Portugal.Footnote 8
Table 2. Impact of weather on burned areas
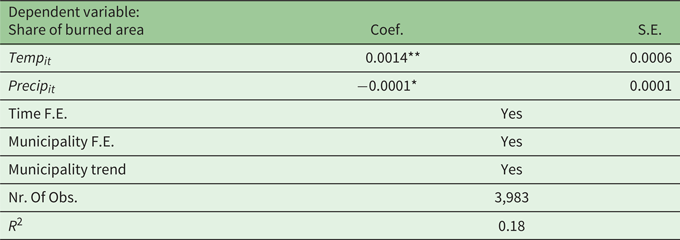
Notes: ** and * stand for 5 per cent and 10 per cent significance levels, respectively. Temperature and Precipitation in this table are from the third quartile. Coef. and S.E. stand for the estimated coefficients and for robust standard errors, respectively. F.E. stands for fixed effects. Lambda is the Mill's inverse ratio from equation (2).
Next we compute the share of burned areas for each municipality in 2030 and 2050. The future projection values of temperature and precipitation for each municipality are taken from the study by Palma (Reference Palma2017). The resolution of data is 12 km. These data are based on the A1B scenario, which corresponds to rapid economic growth, a population peak in 2050 and decline thereafter, the introduction of new and efficient technology, and substantial reduction in regional differences in per capita income (see IPCC, Reference Nakicenovic and Swart2000). This scenario is the one most likely for Portugal (Palma, Reference Palma2017). Note that the results on future projections in all figures are interpreted with respect to the average temperature and precipitation of the period studied.
As shown in figure 1, each municipality is highlighted by one of four colors. White corresponds to the case when the share of burned areas decreases, while the other three colors correspond to the opposite case. The colors stand for the following ranges of increase: the lightest shade is 0–0.5 per cent, the medium shade is 0.5–1 per cent, and the darkest shade is 1–1.32 per cent.

Figure 1. Estimated increase in the share of burned areas in 2030 and 2050.
Note: Results are based on the A1B scenario and are interpreted with respect to the average temperature and precipitation of the period studied.
Figure 1a shows that the majority of municipalities will face a 0–0.5 per cent increase in burned areas and a few will face a 1–1.32 per cent increase in 2030. The situation will be exaggerated in 2050. As shown in figure 1a, there is a substantial increase in the number of municipalities facing a 1–1.32 per cent rise in burned areas. The majority of municipalities will be in the range of 0.5–1 per cent increase in burned areas. In both years, several inland municipalities close to Spain are among the ones suffering the most.
We also estimate equation (4) using the annual average values of temperature and precipitation.Footnote 9 However, when comparing the annual weather data from one period to another, one might find no substantial difference over the years even though a tremendous difference might occur in terms of the corresponding quarterly data. This happens because the amount of rainfall might be offset during the first and/or fourth quarter of the year, smoothing the average annual values.
Note that modeling the relationship between burned area and weather conditions can be more complex than in equation (4). We also included the speed of wind. However, the sign of the estimate on wind does not make sense. This may happen because we are not able to control for the direction of the wind. We therefore decided to exclude this variable from our analysis. Nevertheless, our results related to the burned area in equation (4) are similar to those of Le Page et al. (Reference Le Page, Morton, Bond-Lamberty, Pereira and Hurtt2015: 897). Using a global fire model, Le Page et al. (Reference Le Page, Morton, Bond-Lamberty, Pereira and Hurtt2015) show the relationship between fires and weather conditions for the world, including Portugal.
6.3 Losses due to the burned area projections for the future
We next estimate the future cost for the tourism sector due to the increase in burned areas. In order to simplify the exposure of our results for each municipality, we present them in figures. Figures 2a and 2b present the impacts of the burned area projections on domestic tourist arrivals in 2030 and in 2050, respectively.
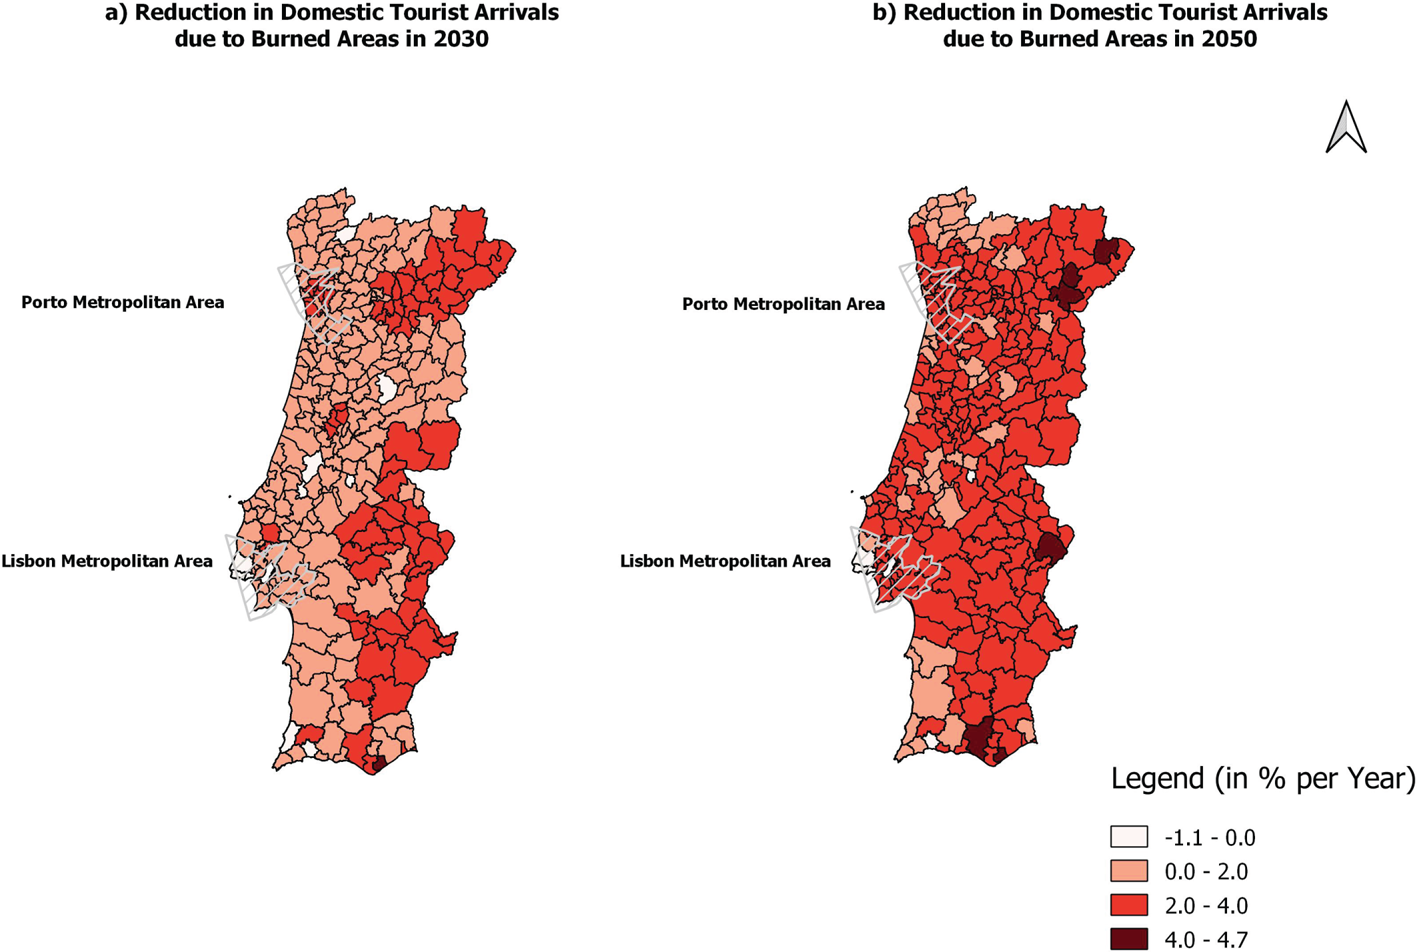
Figure 2. Impact of future burned area projections on domestic tourist arrivals.
Note: Results are based on A1B scenario and are interpreted with respect to the average temperature and precipitation of the period studied.
In figure 2a, 10 municipalities out of 278 are in white. Those municipalities benefit from climate change in 2030 while in 2050 only half of them continue to benefit.Footnote 10 We find that 193 municipalities, 74 municipalities, and 1 municipality will face the reduction in domestic tourist arrivals in the 0–2, 2–4, and above 4 per cent range, respectively. One municipality in the south of Portugal will face the largest reduction in the domestic tourist arrivals in 2030. In 2050 the situation will worsen. While the number of municipalities that will face reductions in the domestic tourist arrivals in the 0–2 per cent range will fall to 52, in the ranges between 2–4 per cent and above 4 per cent their number will increase tremendously, to 215 and 6 municipalities, respectively. Considerable changes will also occur in the north of Portugal, in the Porto metropolitan area, including the city of Porto, and in the Lisbon metropolitan area, where many municipalities shift from the 0–2 per cent range to the 2–4 per cent range. These areas are very popular tourist destinations and currently are the object of several tourism development programs. Therefore, those metropolitan areas require special attention from government and businesses.
Next we estimate the impact of the burned area projections on the number of inbound tourist arrivals. As shown in figure 3a, the impact on municipalities in 2030 and 2050 ranges between −0.35–0, 0–0.5, 0.5–1, and 1–1.48 per cent. The impact of the burned area projections on most municipalities (i.e., 135 municipalities) is between 0–0.5 per cent, followed by the range between 0.5–1 per cent (i.e., 125 municipalities), and only 6 municipalities are in the range above 1 per cent.
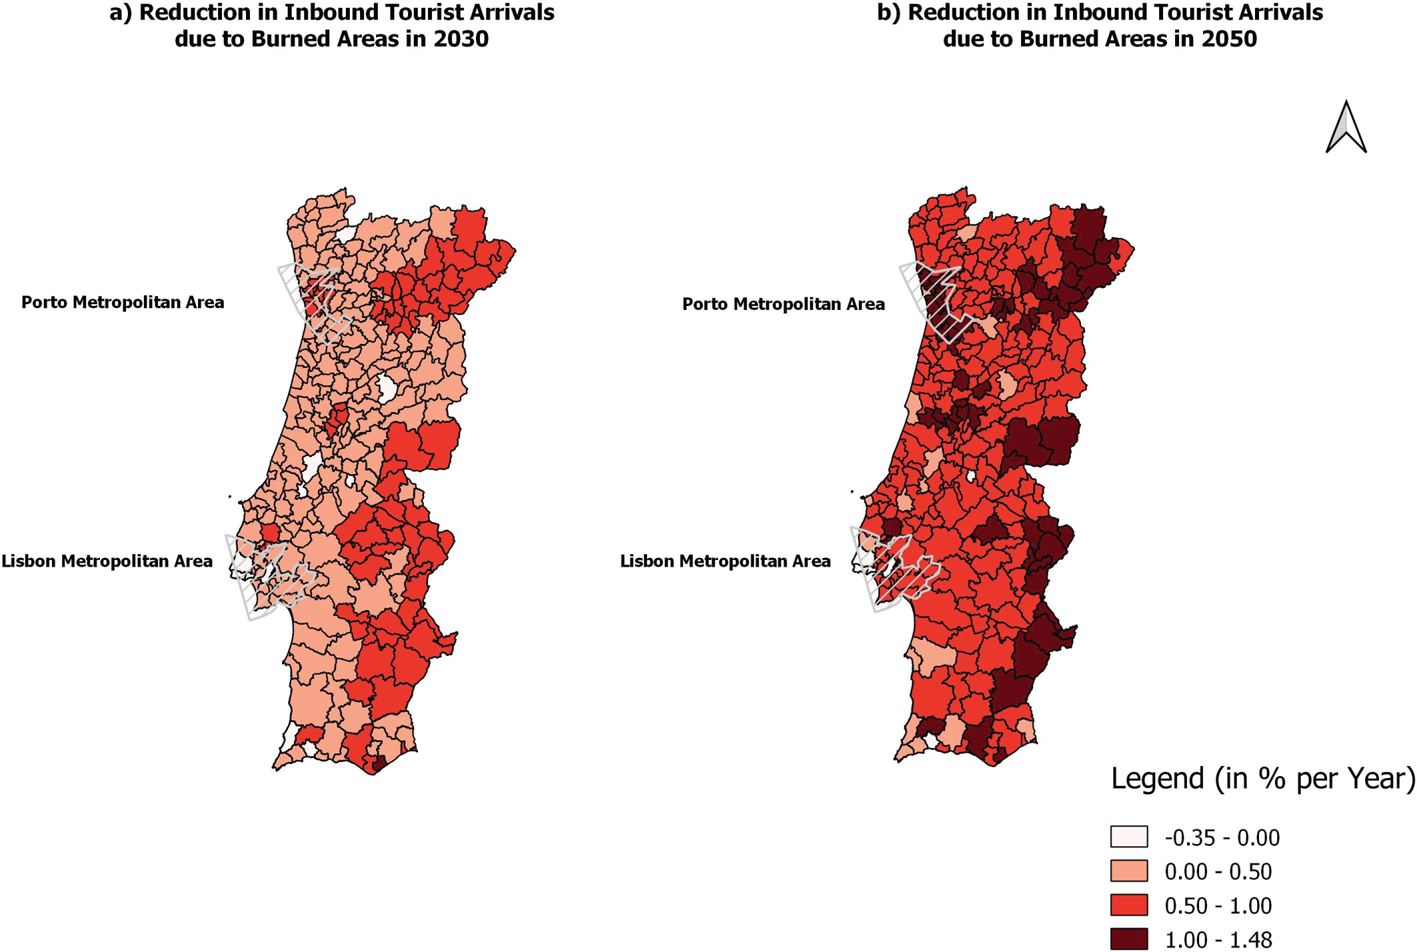
Figure 3. Impact of burned area projections on inbound tourist arrivals.
Note: Results are based on A1B scenario and are interpreted with respect to the average temperature and precipitation of the period studied.
In 2050 the number of municipalities affected in the range between 0.5–1 per cent is almost double (194 municipalities) and the number becomes ten times larger (61 municipalities) in the range above 1 per cent. Note that based on our projections, 10 municipalities will benefit due to weather condition changes in 2030 and only 5 will in 2050. As with domestic tourist arrivals, the greatest impact occurs in part in the Porto metropolitan area. Also, several municipalities close to Spain are among those that are most affected.
In table 3, two scenarios of the estimated losses of Hotels' Revenues in 2030 and 2050 are presented. The first scenario is entitled ‘Realistic’ and corresponds to 2.6 and 5.7 per cent annual growth rates in the overall number of domestic and inbound tourist arrivals, respectively. The second scenario is entitled ‘Optimistic’ and corresponds to overall 5.2 and 11.4 per cent annual growth rates in the number of domestic and inbound tourist arrivals, respectively. The annual growth rate for the ‘Optimistic’ scenario is taken from the OECD report on tourism (OECD, 2018) while the annual growth rate for the realistic scenario is half of those numbers. According this report, the revenue of hotels in Portugal reached €2.9 billion in 2016.
Table 3. Estimated annual losses of hotel revenues in 2030 and 2050
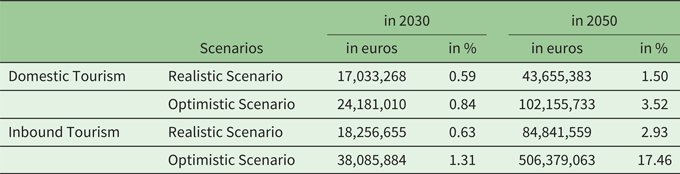
Note: Estimated losses are in 2016 prices. The percentage change is relative to the revenues in 2016. These losses are based on the difference between temperature and precipitation of the 2002–2016 period and of 2030 and 2050 according to the A1B scenario.
As shown in table 3, the estimated losses of hotel revenues due to weather conditions in 2030 when compared to the 2002–2016 period for the domestic tourism segment vary from €17.03 to 24.18 million and for the inbound tourism segment from €18.26 to 38.08 million, depending on scenarios. In 2030 these losses range between 0.59 and 0.84 per cent for domestic tourism and between 0.63 and 1.31 per cent for inbound tourism when compared to the hotel revenues in 2016. In 2050, those losses increase by a factor of about three for domestic tourist arrivals and of about six for inbound tourist arrivals.
6.4 Robustness check
The econometric model presented above may be subject to several potential caveats. First, the relationship between the share of burned area and tourist arrivals in equation (3) may instead represent a relationship between weather conditions and tourist arrivals. To check the robustness of our results, we introduce temperature and precipitation into equation (3). The results are presented in table A1 in the appendix. As shown, the weather variables are not statistically significant and do not change our results. Second, there may exist a potential simultaneity bias issue between burned areas and tourist arrivals. Thus, we run the Seemingly Unrelated Regressions (SUR). That is, we estimate Eqs. (3) and (4) simultaneously. Then we apply the Breusch-Pagan test of independence of the error terms in the two equations. The null hypothesis is H0: errors are not correlated, and the alternative hypothesis is HA: errors are correlated. The P values of the Breusch-Pagan test are 0.99 and 0.96 for inbound and domestic tourist arrivals, respectively. Thus, we cannot reject H0 for both types of arrivals, implying that we do not have evidence of a simultaneity bias problem. Third, our model is based on the assumption that the relationship between weather conditions and burned areas is a stationary process in the long-run. However, this limitation is relevant for most prediction studies and beyond the scope of this paper.
7. Conclusion
This study quantifies the impact of burned areas on the number of domestic and inbound tourist arrivals in Portugal, using municipality level data. We find a negative relationship between burned areas and the number of tourist arrivals. Moreover, this relationship is persistent, suggesting that an increase in the burned area reduces the number of visitors in the following periods. This finding is relevant for policy purposes as the impact of a fire on local economies extends over several years.
We also go beyond the traditional impact analysis by estimating the future burned area projections for the A1B scenario in 2030 and 2050. Then we provide the estimated losses in terms of the number of arrivals for each municipality. The results indicate that the majority of municipalities in 2030 will face a 0–2 per cent reduction in the number of domestic tourist arrivals, while in 2050 this reduction will range between 2–4 per cent. Regarding the number of inbound tourist arrivals, the reduction will range between 0–0.5 per cent in 2030 and 0.5–1 per cent in 2050. These results highlight that risk related to natural disasters should be taken into account when local businesses make investment and management decisions.
Our study can be extended in several different ways. First, our results represent the lower bound estimates since not only may tourist arrivals be affected, but also associated local businesses such as restaurants, shops and taxis. Moreover, there may exist other costs associated with timber and agricultural sectors, property losses (i.e., houses), costs of fire suppression, loss of habitat and ecosystem services, impact on health due to smoke, and damaged infrastructures that should be replaced. Thus, it would be interesting to analyze the impact of fires on other sectors of the economy. Second, even though fires are considered as the main threat in Portugal, it would be interesting to estimate the economic costs related to other natural disasters. Finally, the impact of fires and other disasters on local economies in other Mediterranean countries should be analyzed thoroughly to manage and mitigate the costs of climate change in this region.
Acknowledgements
The paper was drafted while the first author was a Research Associate under the research fellowship from Fundação para a Ciência e a Tecnologia (FCT), Portugal (SFRH/BPD/122946/2016) at Nova School of Business and Economics, and revised at the Leibniz Institute for East and Southeast European Studies and the Center for International Development and Environmental Research, Justus Liebig University, Giessen, Germany. The second author acknowledges Fundação para a Ciência e a Tecnologia (UID/ECO/00124/2019, UIDB/00124/2020 and Social Sciences DataLab, PINFRA/22209/2016), POR Lisboa and POR Norte (Social Sciences DataLab, PINFRA/22209/2016). The first author acknowledges the support from the German Academic Exchange Service (DAAD) from funds of the Federal Ministry for Economic Cooperation (BMZ), SDGnexus Network (Grant No. 57526248), program ‘exceed – Hochschulexzellenz in der Entwicklungszusammenarbeit’. The first version of this paper appeared as FEUNL Working Paper Series wp632 and should be replaced with the current version. All opinions expressed are those of the authors and have not been endorsed by either the FCT or DAAD.
Appendix
Table A1. Impact of burned areas on the number of tourist arrivals


 Open access